


See how liquidity turned random price action into a process.
Compare plans to read liquidity and order flow during the US trading session.
Interviews
September 28, 2026
From Candlesticks That Felt Random to a Liquidity-Based Edge: How TebohoQ Built a Repeatable Process for the US Session
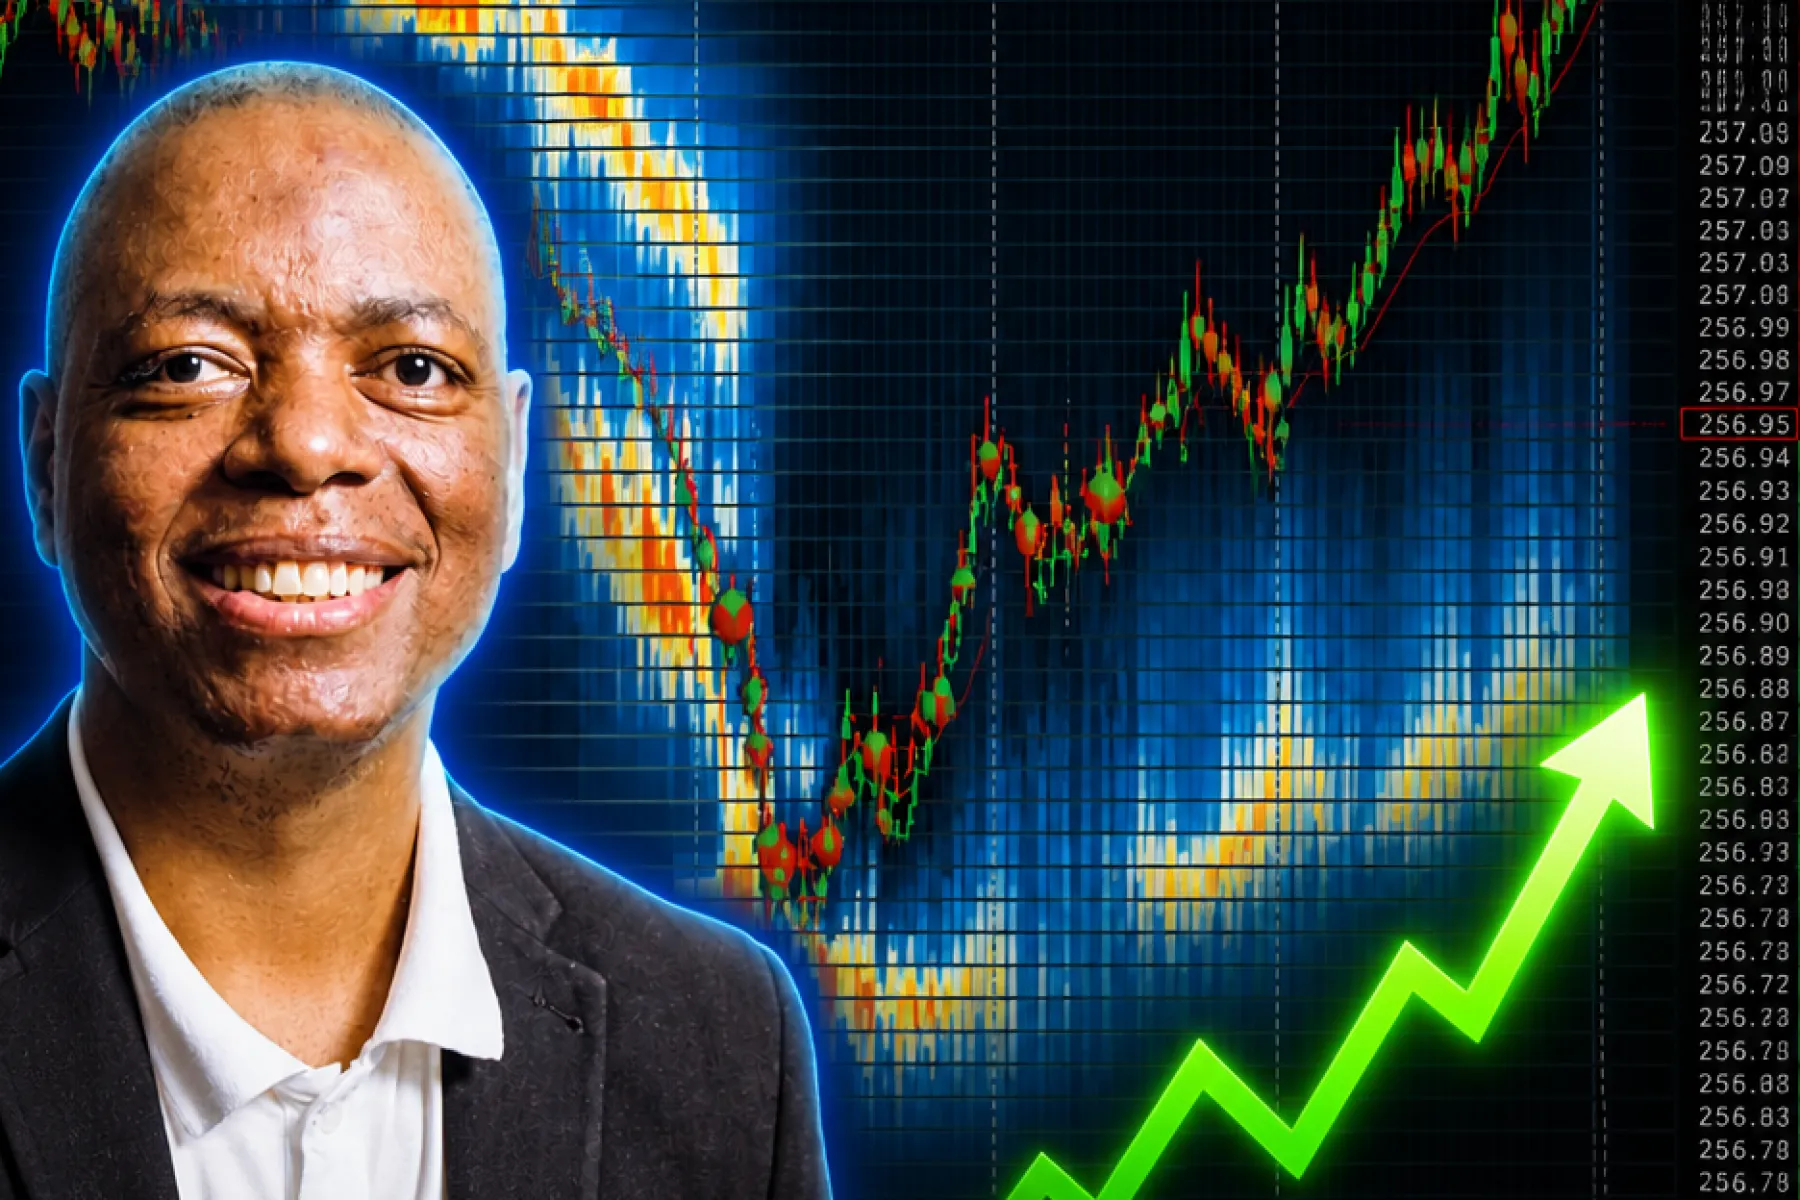
Four years trading · S&P 500 E-mini (ES) · Bruce Pilot Program & Bookmap Academy
For four years, TebohoQ traded without ever finding something he could call a real edge. He’d studied global macroeconomics seriously, built a disciplined pre-market routine around the economic calendar, and still watched price do the opposite of what the fundamentals seemed to promise. Order flow, and a specific structured mentorship program built around it, changed that.
An Economist Trading Around the School Run
TebohoQ describes his style as intraday scalping, small, frequent wins taken from the US cash open through the European close. Based in South Africa, that window happens to line up neatly with his afternoon, right after he picks his kids up from school and gets back to his desk.
He trades the S&P 500 E-mini almost exclusively for now, a deliberate choice tied to the Bruce Pilot Program he’s enrolled in, which keeps its early focus on one instrument so traders can sharpen a single edge before spreading out. He has traded gold and oil in the past, both instruments he understands well through his economics background and South Africa’s own position as a commodity economy, and plans to eventually add MNQ, gold, and oil back in once his ES edge is fully built.
Four Years of Random-Feeling Candles
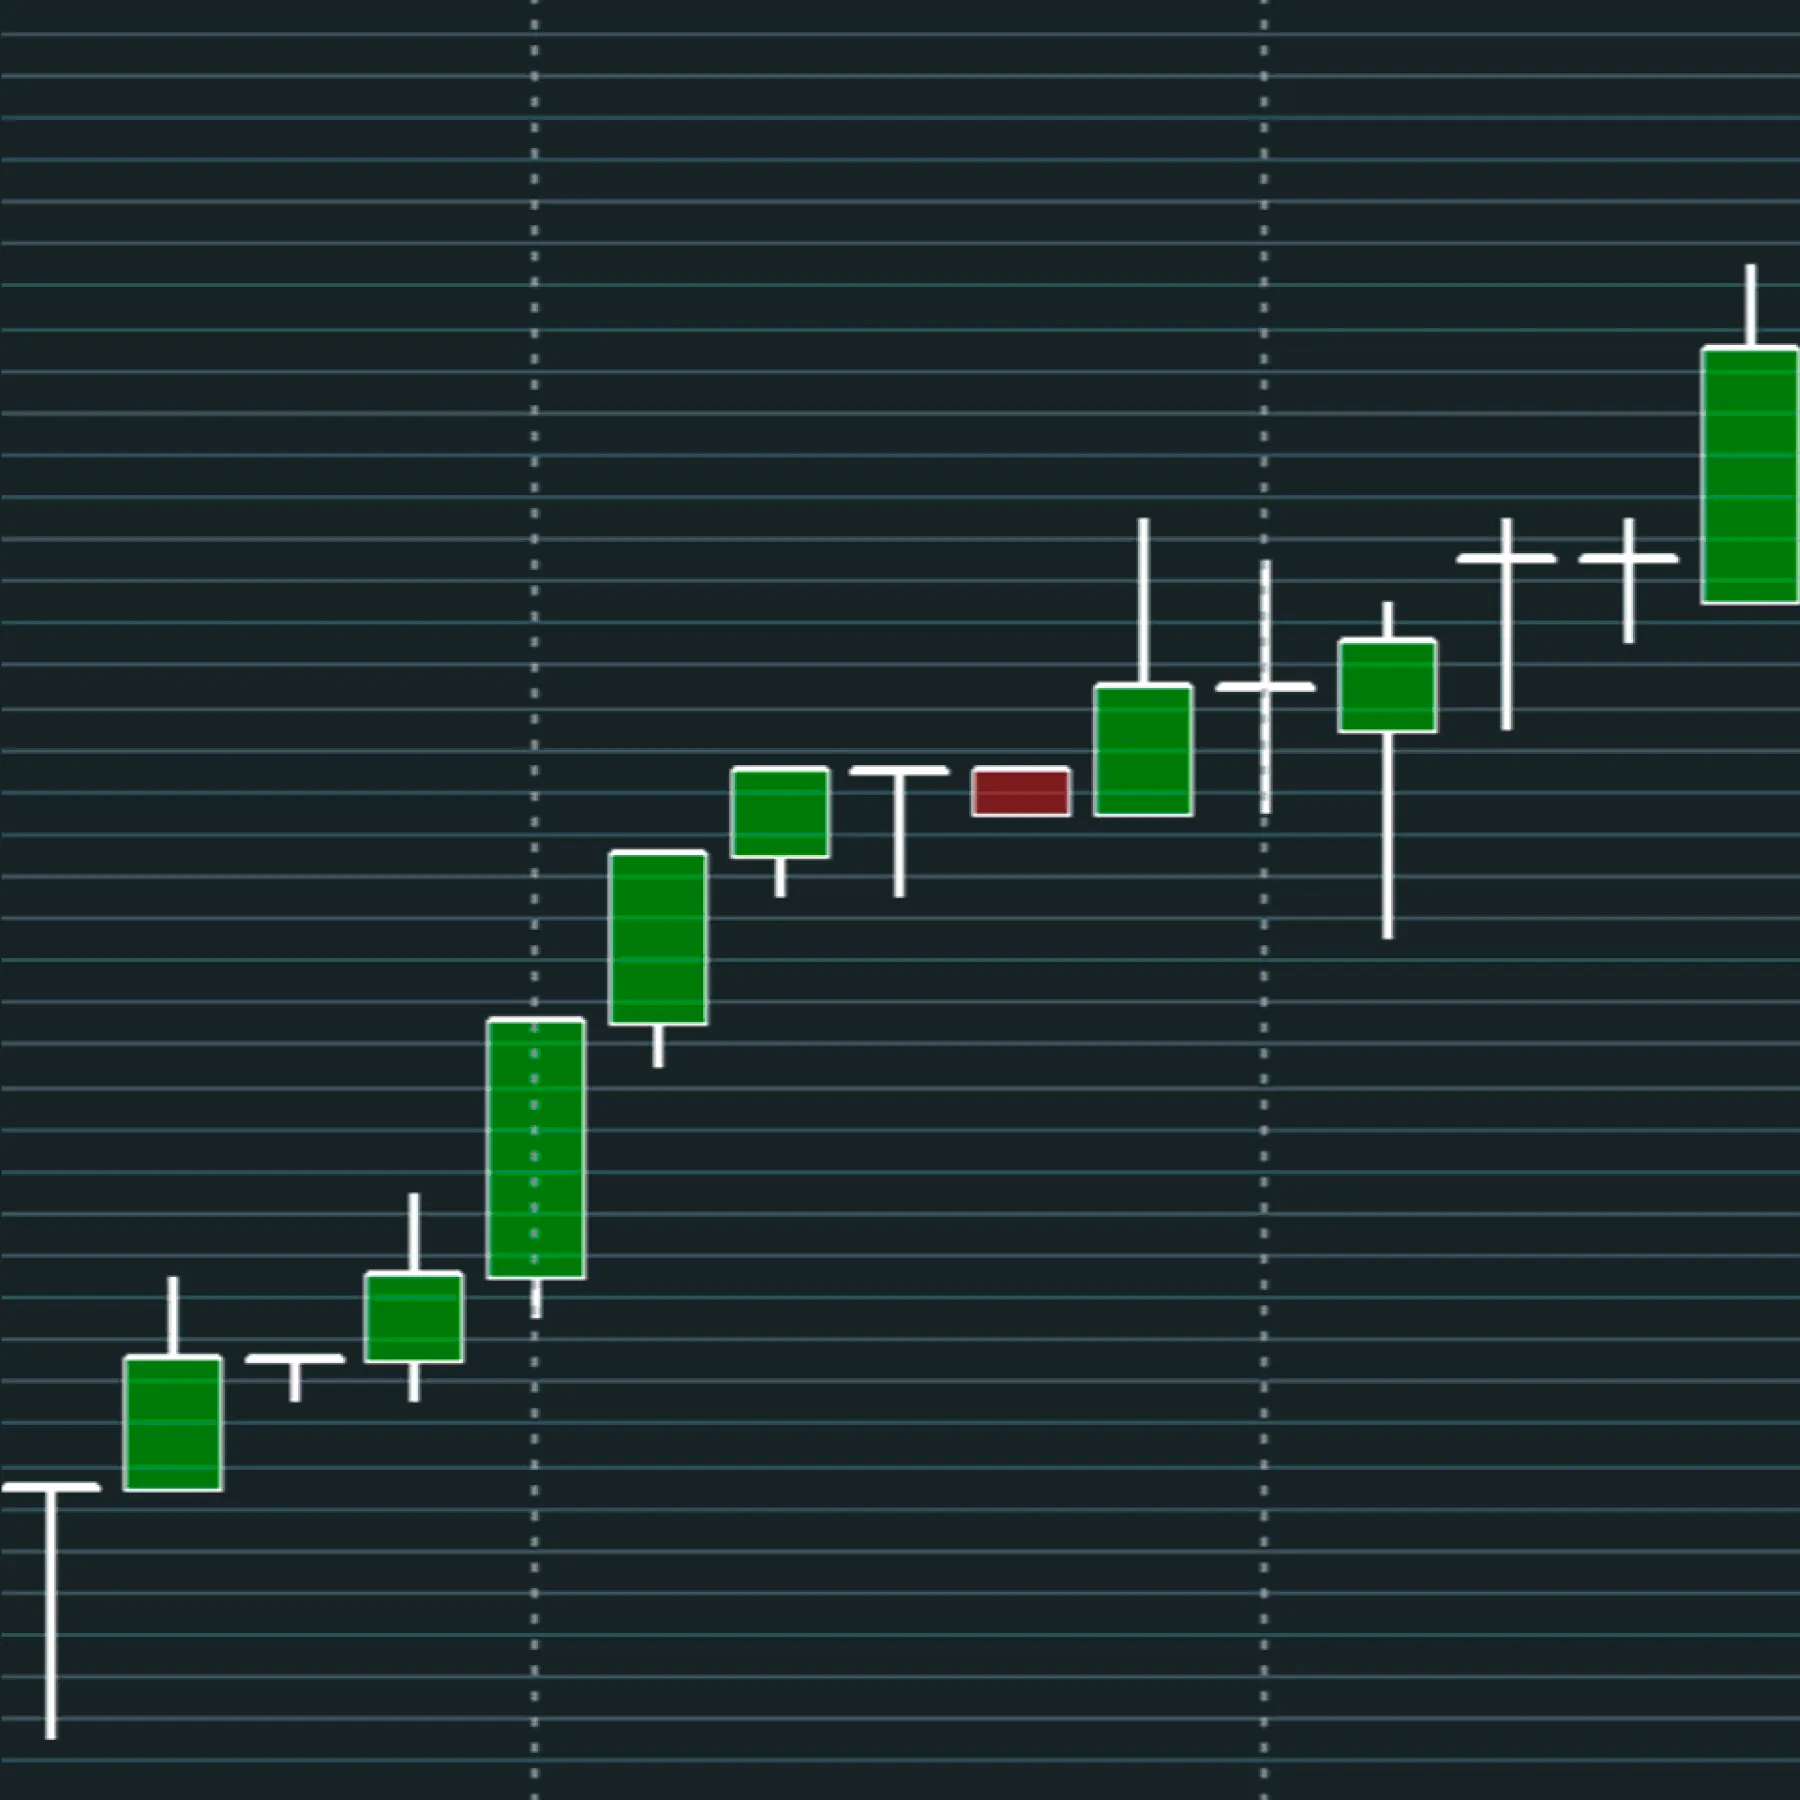
Before Bookmap, TebohoQ traded forex, mainly EUR/USD and USD/JPY, using MetaTrader, Tradovate, and TradingView. His preparation was genuinely rigorous. He enrolled in a global macro program that taught him to read the economic calendar in depth: NFP releases, FOMC statements, CPI prints, and the broader catalysts expected to move currencies.
The problem was that the market kept doing the opposite of what that preparation predicted. He’d go into a session expecting a CPI beat to prop up the dollar, and watch the dollar drop against the euro anyway. He responded the way a lot of traders do: adding more indicators, VIX, commitment of traders data, layering on more inputs rather than fewer. The result was more noise, not more clarity.
“Trading seemed to be very random and dependent on luck rather than a scientific process that could be studied.”
– TebohoQ
That randomness didn’t just cost him trades. It cost him confidence in the idea that he could ever succeed at this, a toll that’s easy to underestimate until you’ve actually sat through it.
Finding Bookmap Through a Trading Room
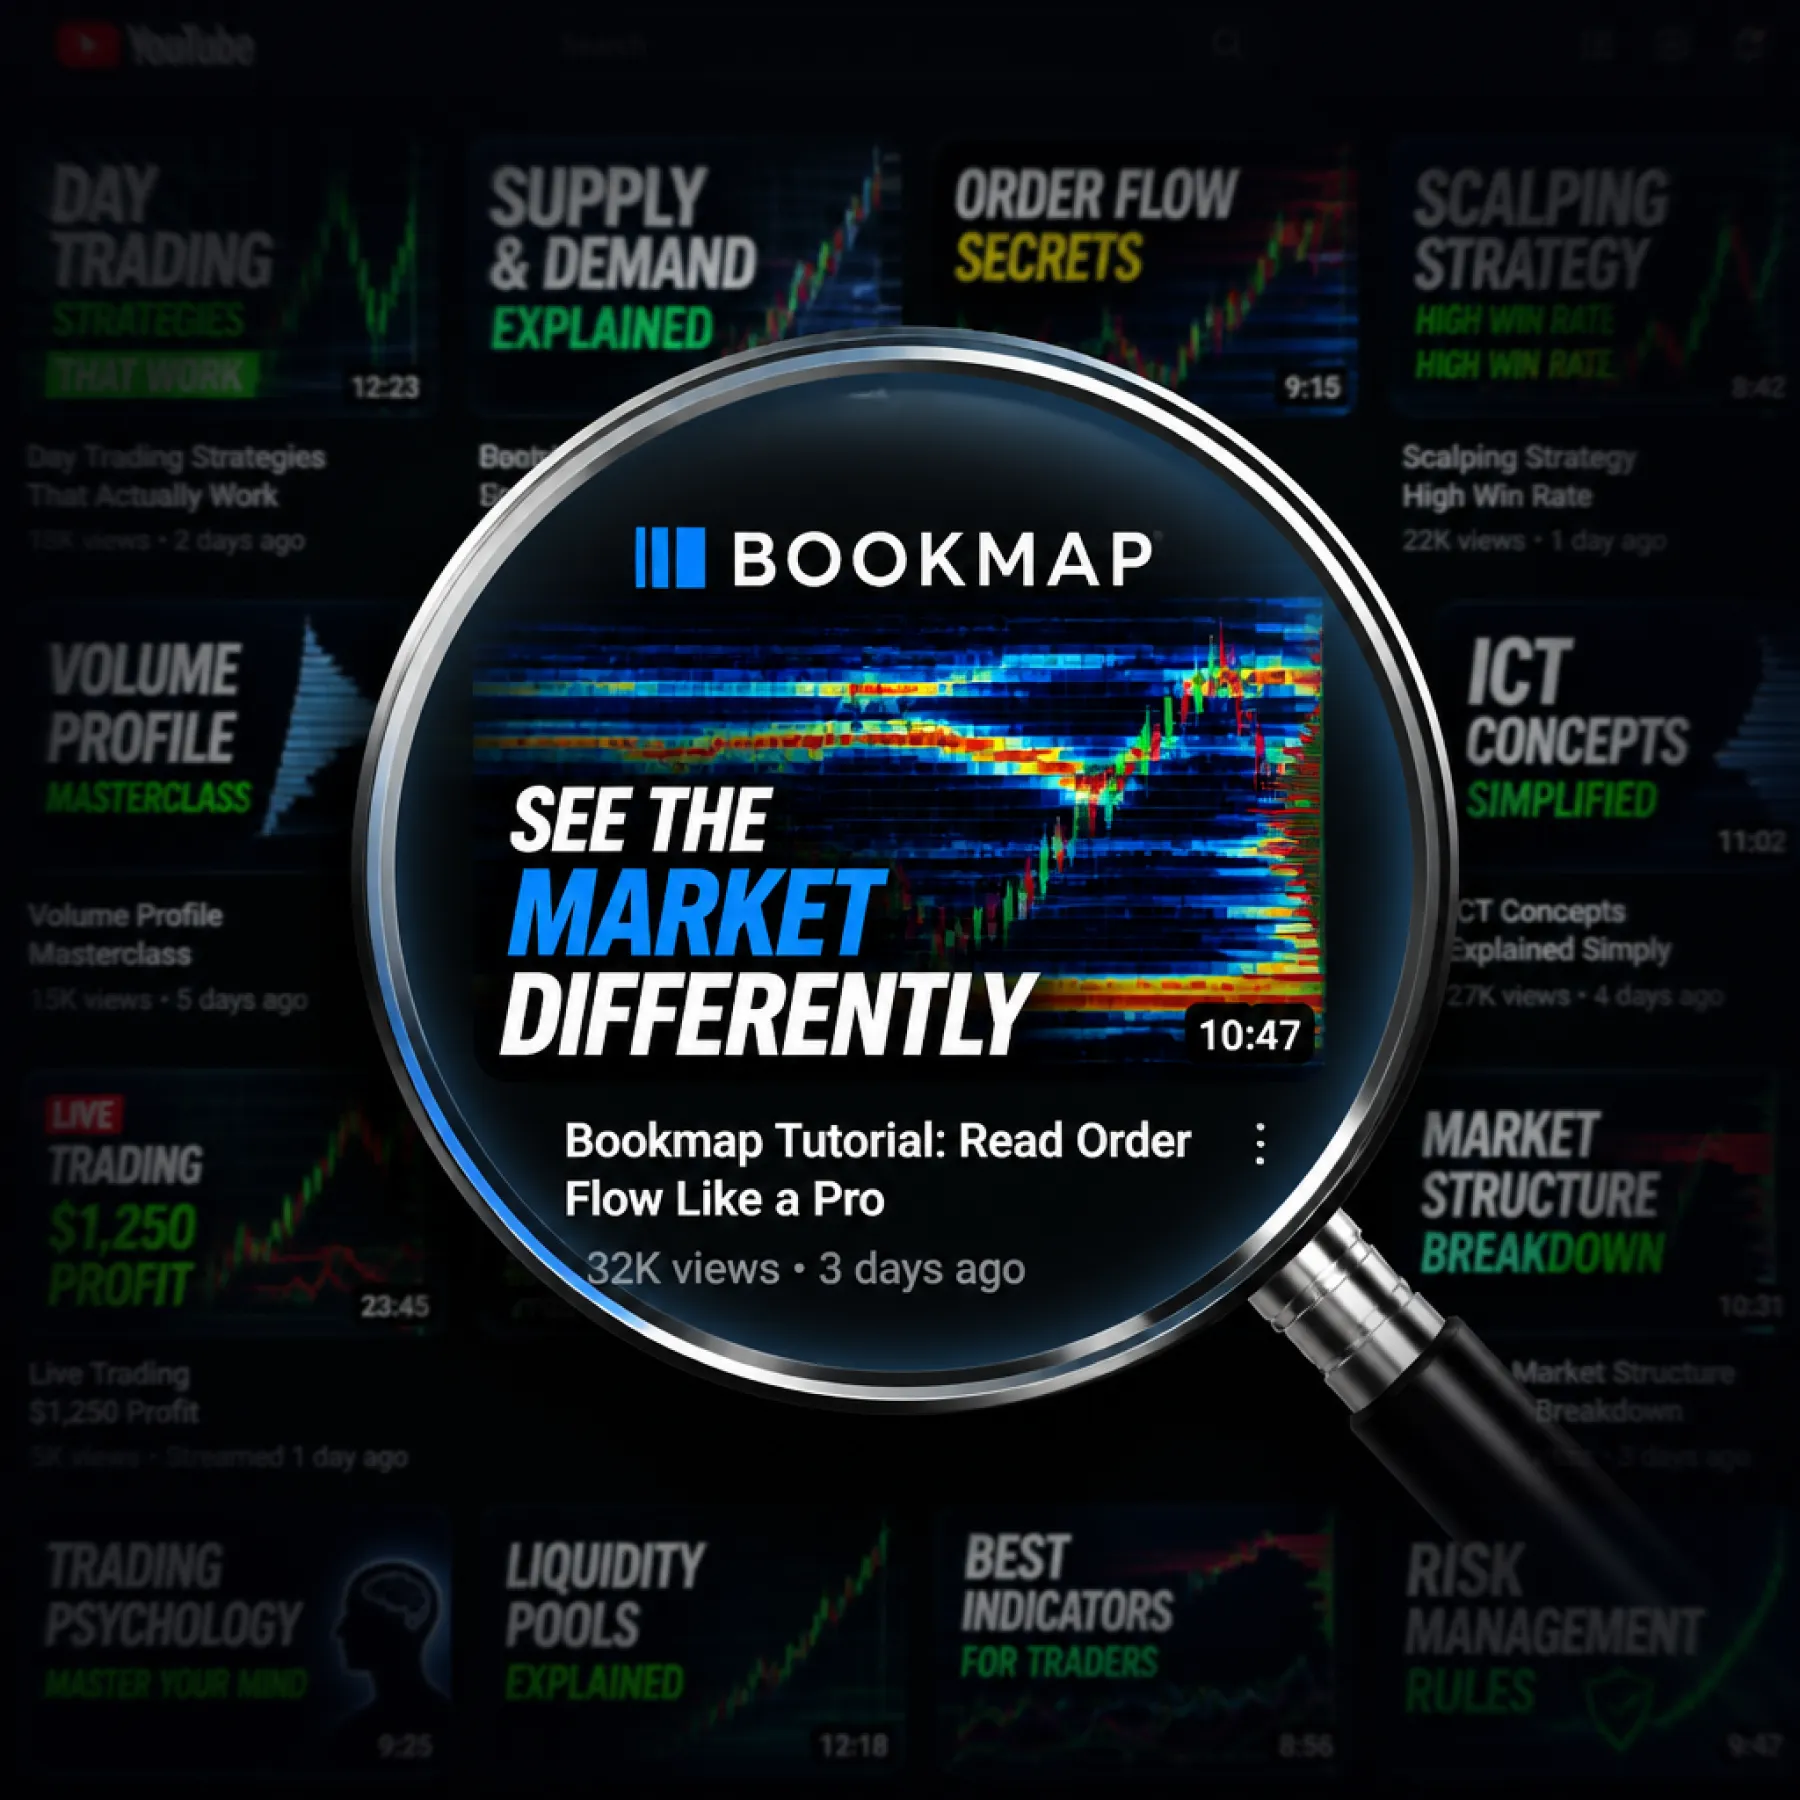
TebohoQ discovered Bookmap in a trading room run by Austin Silver of ASFX, who traded with two screens side by side, one on TradingView, the other on Bookmap, calling out levels based on the orders he could see coming through the book. Watching price react to those orders in real time was exactly what TebohoQ had been missing.
“I wanted something that I could study and be able to anticipate where price is going to go next. I didn’t just want to sit around studying candlestick patterns that were very difficult to make sense of.”
– TebohoQ
He didn’t ease into it. Rather than starting with a trial, he went straight to a Global Plus subscription, timed conveniently with a Black Friday promotion, because he wanted unrestricted access to everything rather than a limited taste of the platform.
When It Clicked: An Economist’s Eye for the Heatmap
The first feature that landed for TebohoQ was the volume dots. As an inexperienced order flow trader at the time, he wasn’t yet reading the platform’s deeper features, but the dots mapped price movement far more clearly than candlesticks, and let him time entries and exits with a precision he’d never had before. He’d heard other traders talk about tick-level movement without it meaning much to him. Seeing it visually is what made the concept real.
The heatmap itself took a bit more work, and some time on Bookmap’s educational site, before it clicked. Once he understood it as a historical visualization of orders moving through the depth of market, his own professional background gave him an unexpected shortcut: as an economist, he was already used to reading intensity of color as a meaningful indicator, the same way a map might shade regions by poverty levels. Once he could map that same instinct onto the heatmap’s color gradients, the picture came together quickly.
“Economics is a very visual discipline as well. That’s where it really clicked for me, and it motivated me to stay on.”
– TebohoQ
Joining the Bruce Pilot Program
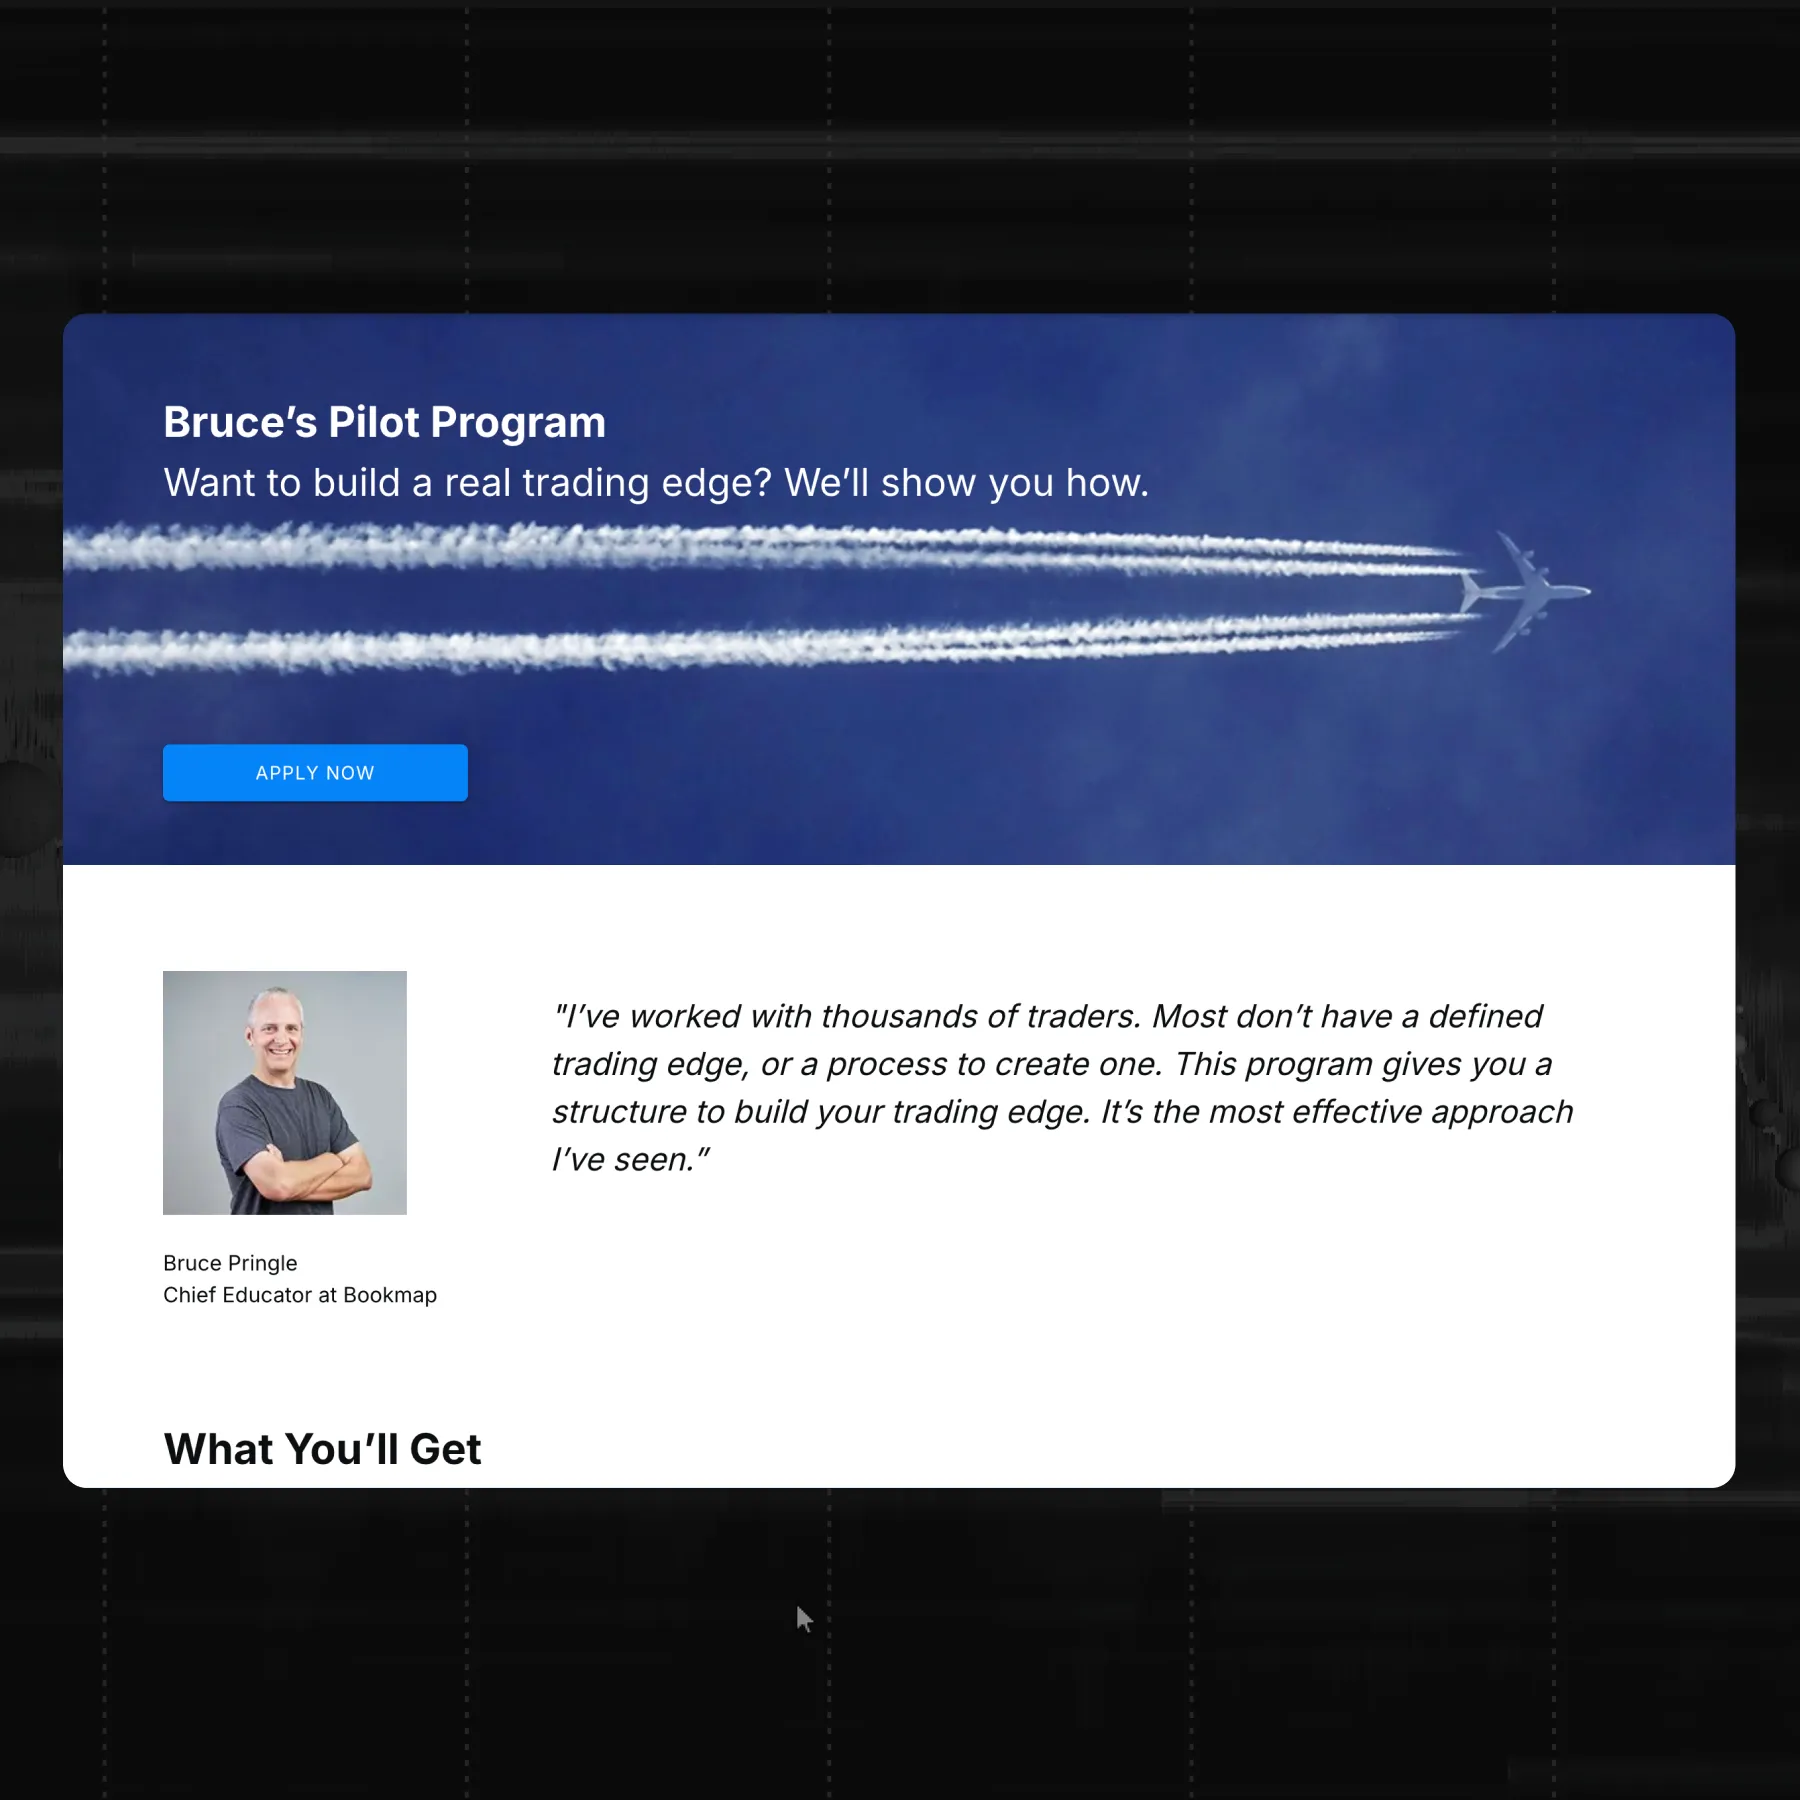
TebohoQ had seen Bruce interviewed by Austin Silver before, which built enough trust that when he saw the Bruce Pilot Program listed on Bookmap’s site, he enrolled without much hesitation. What struck him most wasn’t a feature of the software at all. It was the culture of the community around it.
“The coaches said don’t even look at P&L here. We are looking at your process and the outcomes of your process. That was a game changer for me.”
– TebohoQ
That shift, from judging a trade by whether it made money to judging it by whether the read was correct, reframed how he approached every session. A profitable trade built on a wrong read stopped being something to celebrate, and a well-reasoned trade that lost still counted as good process.
Building an Edge: The Market Structure Setup
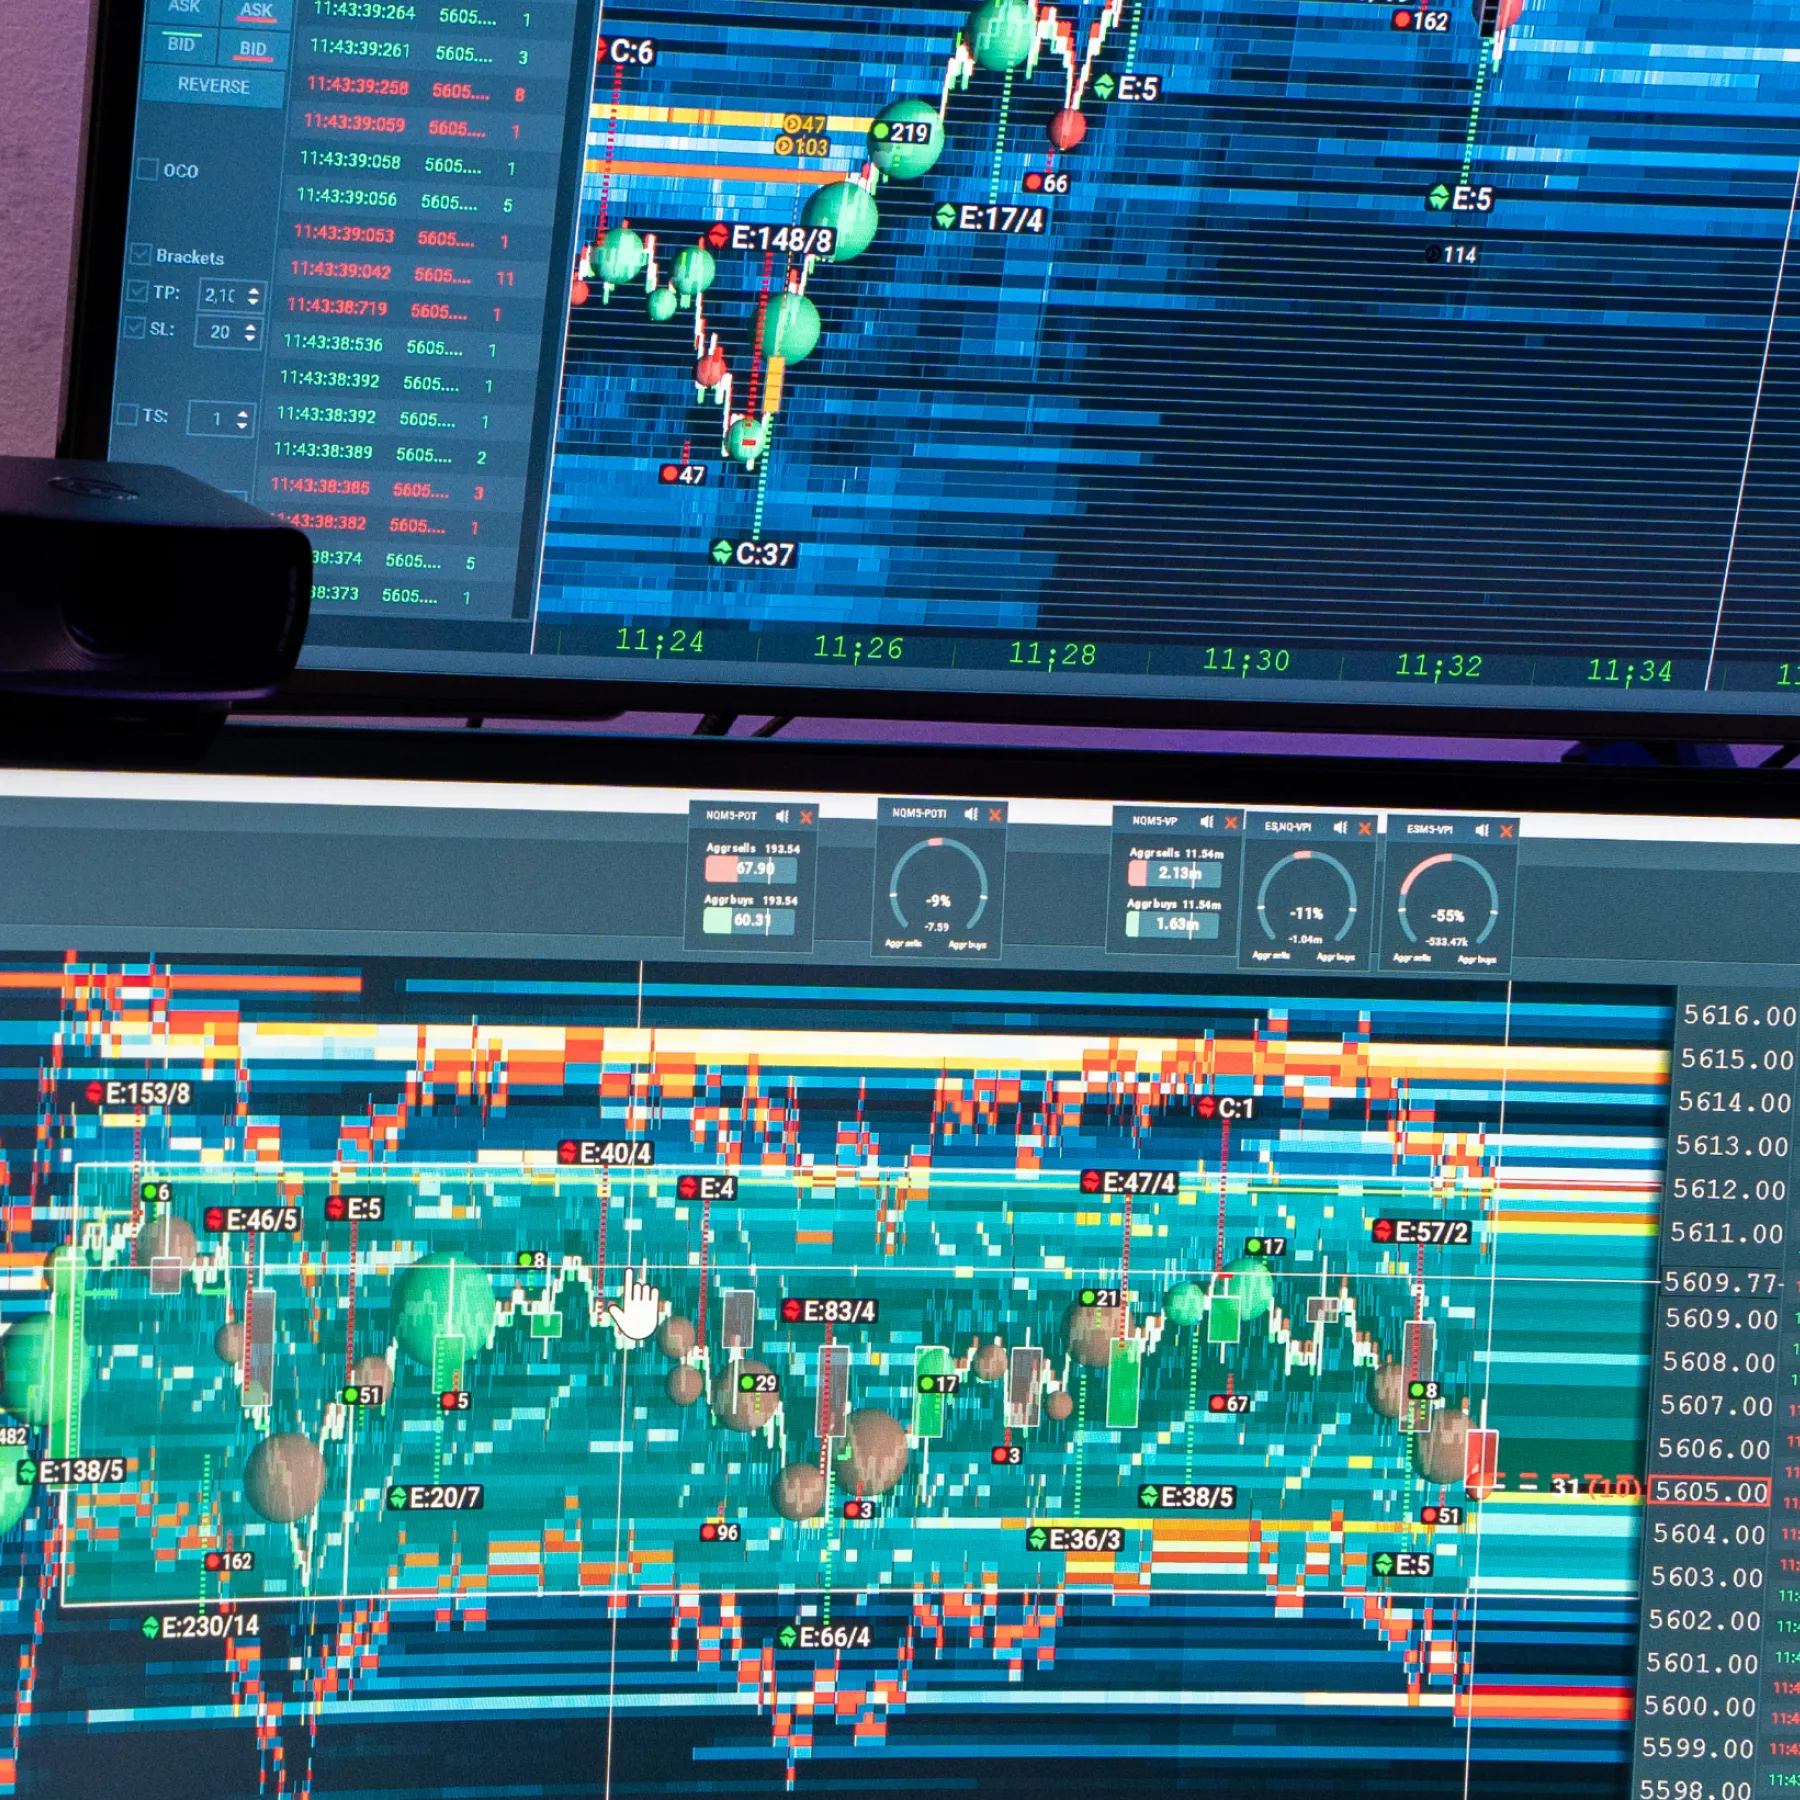
TebohoQ’s edge, the setup that eventually got featured on Bookmap’s Insights page as a Trade of the Week, is one he now calls his market structure setup, built directly from the TLBA framework taught in the Bruce Pilot Program.
The setup starts with watching an aggressive move exhaust itself against resting liquidity. In the trade that made the Insights page, aggressive buyers pushed an impulsive move higher on high volume, straight into a wall of resting sell-side liquidity spread across three levels of passive accumulation. As those buyers transacted through all three levels without gaining further ground, they disappeared from the tape entirely, and sellers took control, breaking the prior diagonal structure.
The harder part, and the one he’d lost trades on before learning it properly, was what came next. Rather than chasing the break immediately, TebohoQ waited for a pullback into a high-volume node on the volume profile. Price did bounce there, briefly putting buyers back in the picture, before sellers reasserted control and continued the move. That retest, not the initial break, was his actual entry.
“The first level of confidence was the liquidity skew at the key level. It’s an indication that sellers are defending that level, which is going to repel the price. Then I looked at the magnetic liquidity for my target, because there should be liquidity there too.”
– TebohoQ
He describes the full setup, borrowing a phrase from fellow trader John, as an A+ setup, and says it needs two things to qualify: a liquidity skew at the entry level showing that participants are actively defending it, and a pocket of magnetic resting liquidity at the target, ideally 10 to 40 ticks away. Any closer than that and there isn’t enough room for the trade to work; any target with no real liquidity behind it isn’t one he considers worth taking, regardless of how the level looks.
His bracket orders are now standardized around a 2:1 risk-to-reward ratio, currently risking 15 ticks against a 30-tick target, a size his coach Bruce has been encouraging him to grow as his consistency improves.
A Routine Built Around the Playbook
TebohoQ has replaced his old approach entirely with the Bookmap Academy playbook, which Bruce updates through sessions each Monday, Tuesday, and Friday. His pre-market routine starts with a check of the news and macro dynamics, but strictly for context now, not for prediction, a distinction that took him a while to properly unlearn from his forex days.
He identifies higher-timeframe key levels in TradingView, exports them as a CSV, and imports them directly into Bookmap’s custom notes so they appear natively on the heatmap. From there, his attention stays almost entirely on the platform, waiting through the initial balance for clearer moves to develop rather than forcing anything in the early, more erratic minutes of the session.
He treats the routine, checking in with the Discord community, attending live webinars when Bruce is hosting, and staying consistent even on the days he isn’t, as close to non-negotiable.
“It has become like a religious activity for me. If I have not done any of these, I just feel like I’m not ready for the day.”
– TebohoQ
On days when the setup isn’t there or he doesn’t feel ready, he doesn’t force a trade. He treats it as an education day instead, running Replay Mode against Bruce’s curated program files to sharpen his read of the same A+ setups, whether or not the live session that day gave him anything to act on.
Learning Through the Community
TebohoQ points to three things that made the difference in his development: Bruce’s live webinars, where he watches the same setups get read in real, fast-moving conditions rather than in the calmer environment of a replay file; the weekly Academy coaching and mentoring sessions, where feedback is structured and delivered in an appreciative style, coaches highlighting what to improve rather than dwelling on mistakes; and daily engagement in the Bookmap Discord community, posting his own trades and giving feedback to others.
That last piece, actively critiquing other traders’ setups rather than only posting his own, is what he credits with deepening his own understanding the most.
“I could not wish for a better trading training platform than this, frankly.”
– TebohoQ
Advice for New Traders

TebohoQ’s advice to anyone just starting out mirrors the same lesson that eventually worked for him: the heatmap looks far more intimidating than it actually is, and the fastest way through that is structure, not shortcuts.
- Don’t panic at the heatmap. Once you understand what the color intensity actually represents, the rest starts fitting together.
- Join a structured program rather than trying to piece order flow together alone.
- Move in lockstep with your coach’s curriculum. TebohoQ traded only the TLBA setup until Bruce introduced LVP, then added that, rather than trying to get ahead of the program.
- Take Replay Mode seriously as a learning tool, not just a backtesting box to check.
- Show up in the community. Giving feedback to other traders sharpens your own reads as much as receiving it does.
“Stick with the process. Don’t try to run ahead of it. Show up, participate, be a positive influence to the community, and pretty soon you’ll have your own edge, as I do.”
– TebohoQ
Conclusion
TebohoQ’s story is, in one sense, a simple one: a trader who spent years chasing an edge in the news and the economic calendar, only to find it in the order book instead. But the more specific lesson is in how he got there. It wasn’t the heatmap alone. It was pairing that visual tool with a structured program that told him exactly what to look for, held him to a process rather than a P&L number, and gave him a community to test his reasoning against.
What he has now is a named, defined setup with clear entry criteria, a standardized risk-to-reward ratio, and the confidence that comes from knowing why a trade worked, or didn’t, rather than hoping it would.
Sign Up Now
Latest Articles