
What Is Market Structure in Trading?
Market structure, as a concept, is nothing new and has been around for as long as financial markets themselves. However, the core principles continue to be extremely important, especially when it comes to analyzing price movement and identifying trading opportunities.
Market structure acts as a guide for understanding upward, downward, and sideways trends. The same principles can be used in any type of market, from stocks, futures, forex, and commodities, to digital assets like cryptocurrencies or even physical assets like real estate.

If you’re wondering why market structure is so relevant or how you can use it, read on. We’ll go through all the fundamentals in this post.
What this article covers:
1. What Is Market Structure?
2. Why Is Market Structure Important in Trading?
3. How to Use Market Structure?
4. Which Assets Work Best With Market Structure?
5. What Is the Best Time Frame to Identify Market Structure?
6. Examples and Trade Setups Using Market Structure
7. Advantages
8. Limitations
9. Market Structure FAQ
Watch a video summary of this article (with added examples)
What Is Market Structure?
Market structure definition: The framework or structure that any given market is currently trading in. Market structure can help you understand the behavior, condition, and current flow of the market. It highlights support and resistance levels, swing highs, and swing lows.
Types of Market Structure
Market structure can be broadly classified into three distinct categories:
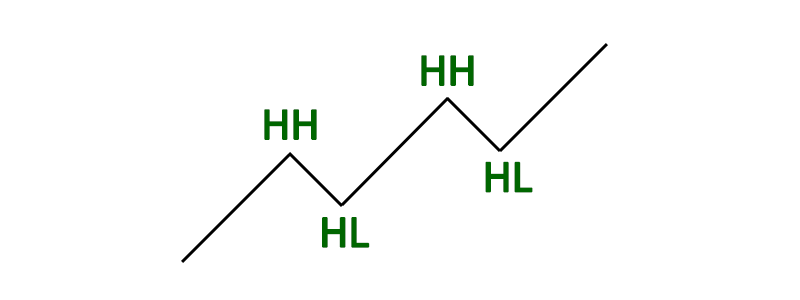
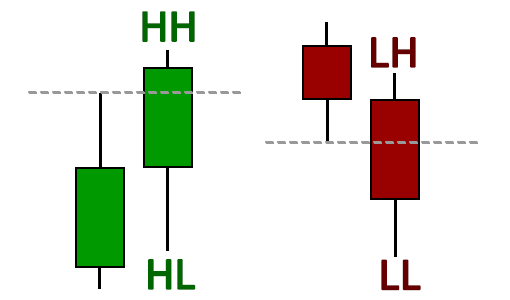
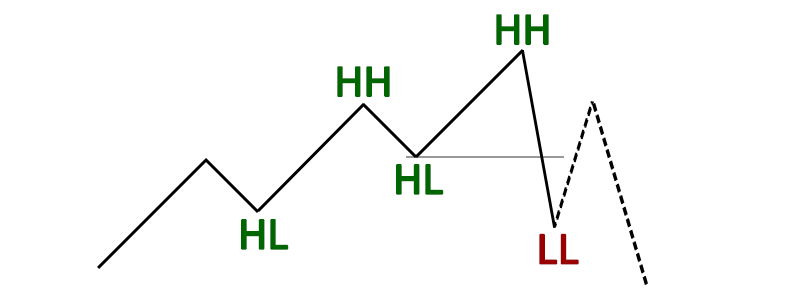
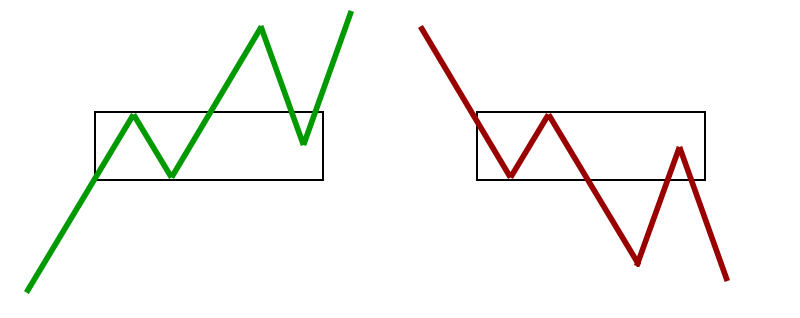
Bullish Market Structure: A bullish structure is defined by a series of higher highs (HH) and higher lows (HL). The trend continues in the same direction until the asset price records a lower low (LL).
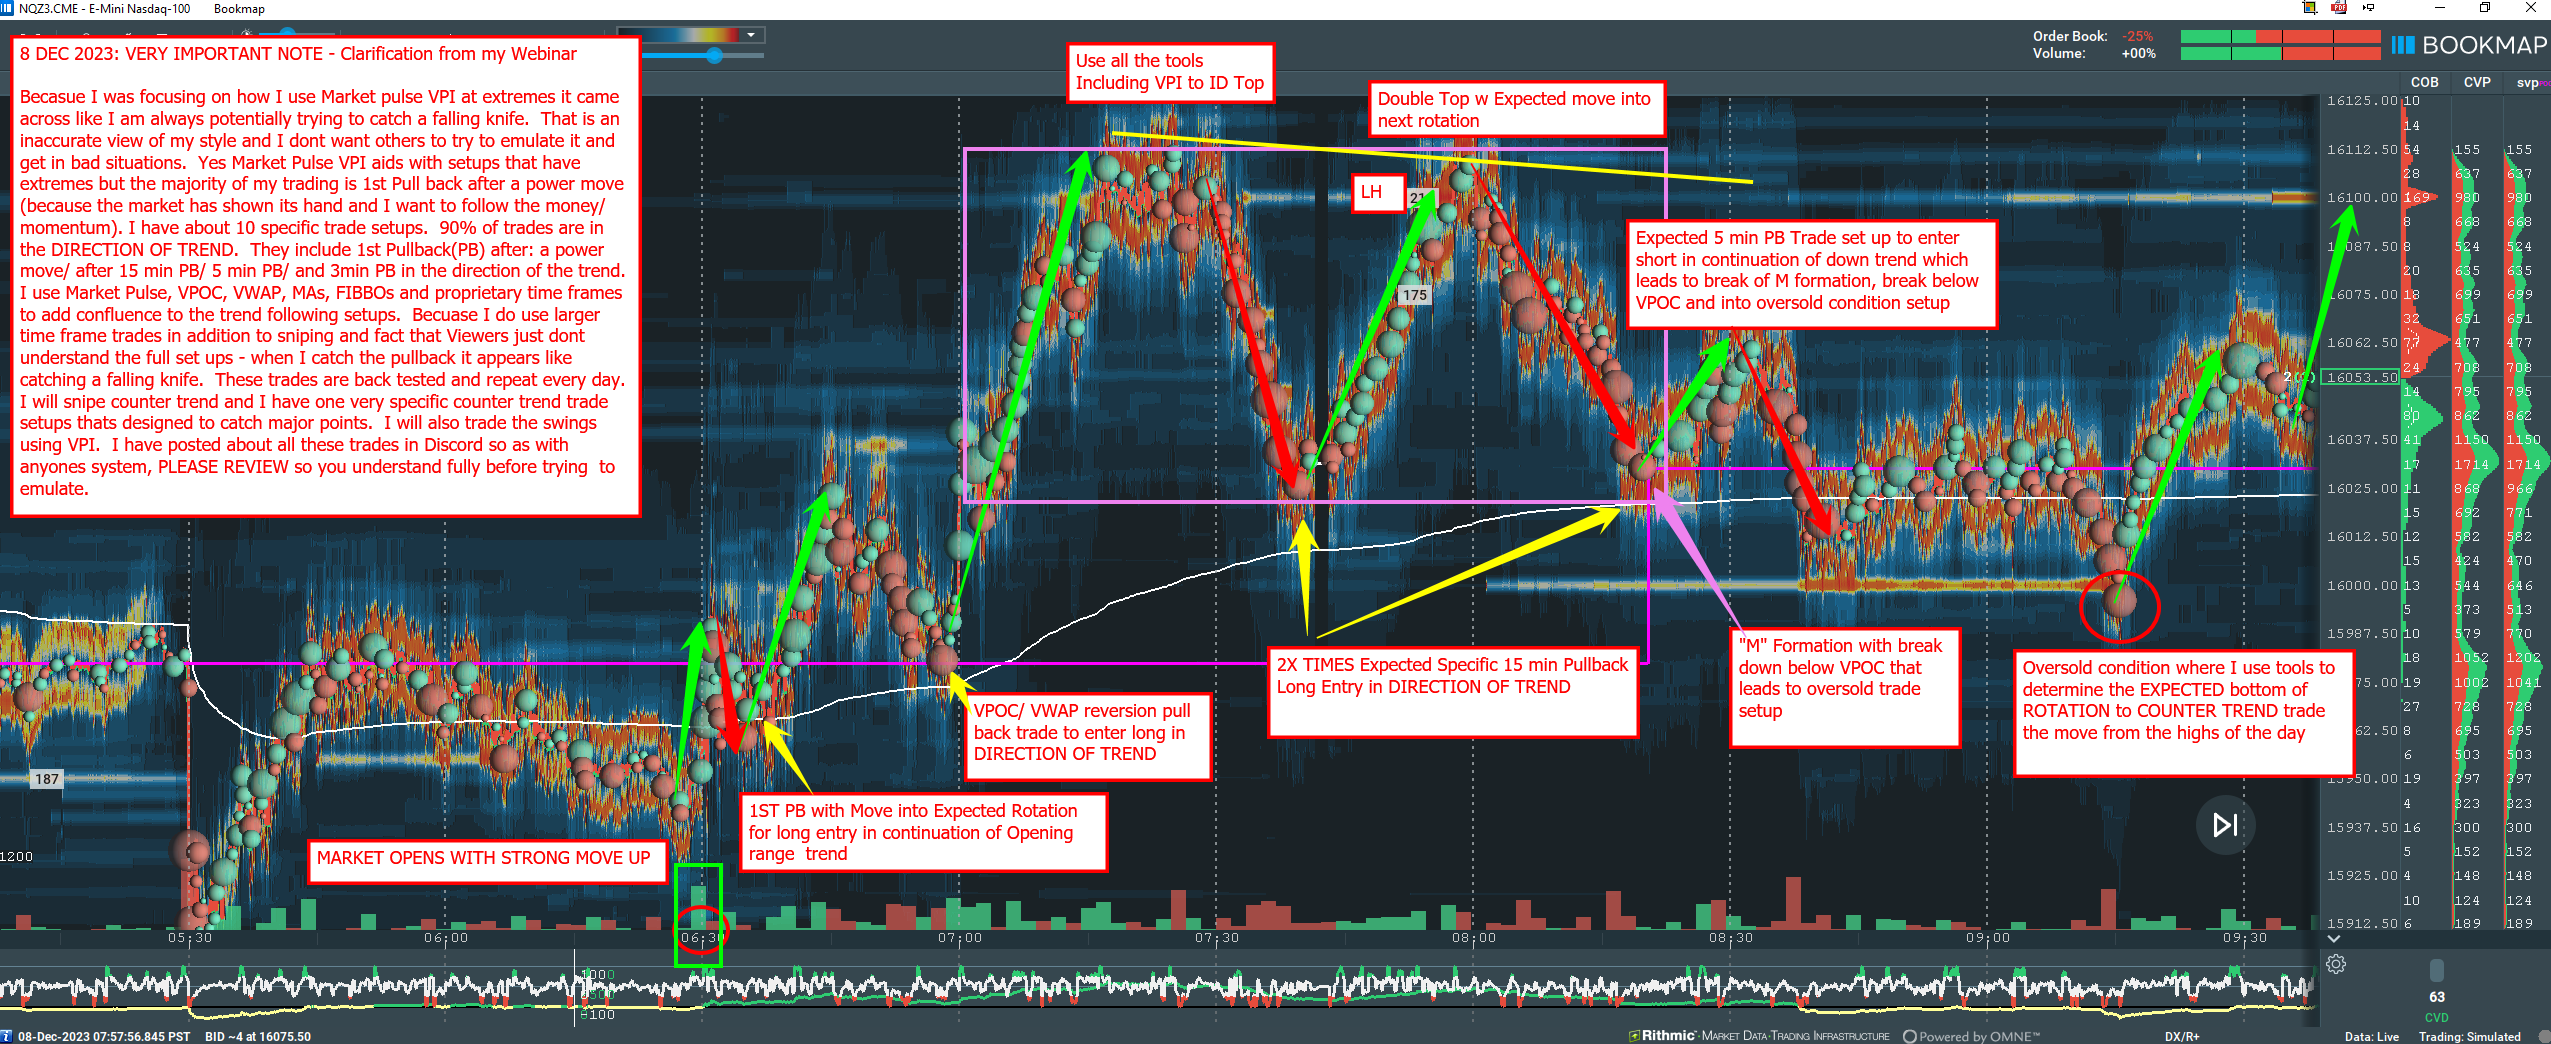
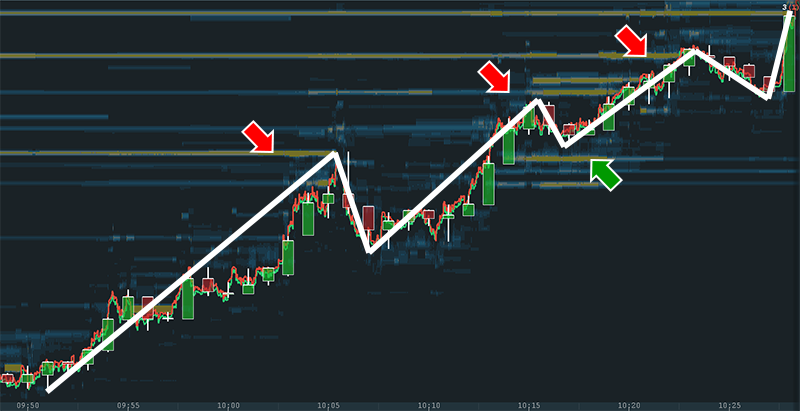
In this example from the Blue Jacket, CrashF16 displays how he uses market structure in conjuncture with other tools such as the Market Pulse add-on to identify high-probability trading setups.
Discover more trading Insights.
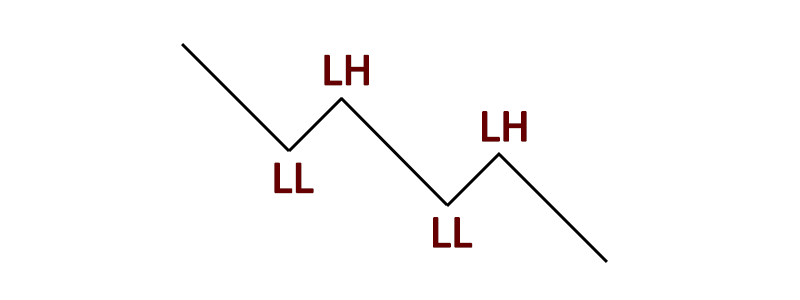
Bearish Market Structure: A bearish structure is defined by lower lows (LL) and lower highs (LH). The price trend continues as long as lower highs (LH) are being printed and until a higher high (HH) is created.
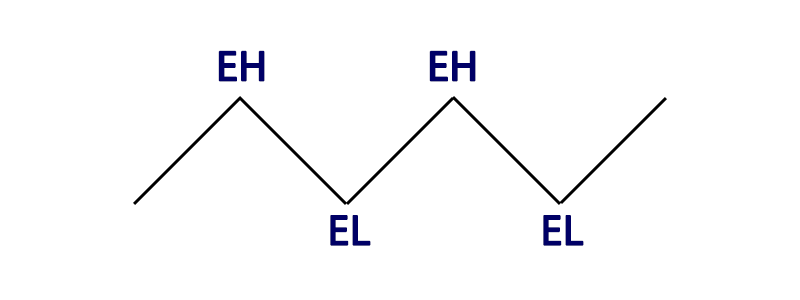
Sideways Market Structure: The horizontal movement of price shown by equal highs (EH) and equal lows (EL) is called a sideways trend or sometimes referred to as chop.
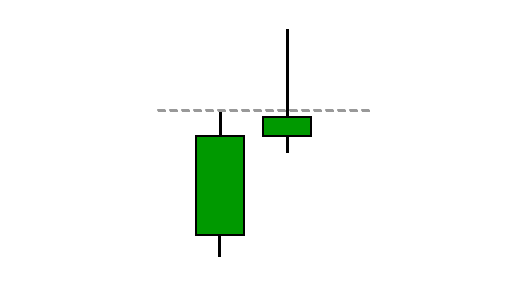
Market Structure With Candlesticks
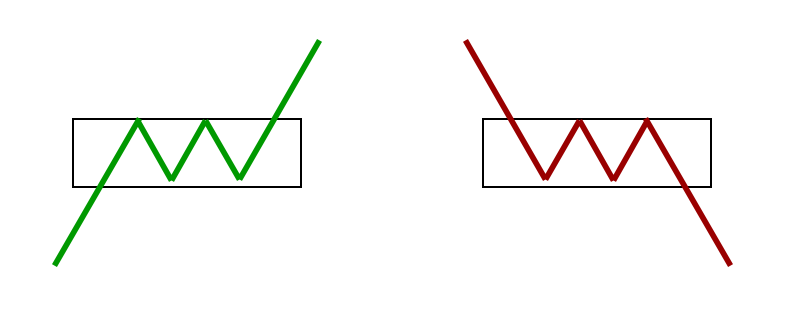
Market Structure can also be defined by candlesticks as illustrated below:
Price Continuation
To confirm a trend it’s important to see candlesticks close above the previous higher high (in an uptrend) or below the previous lower low (in a downtrend).
This shows the continuation of buying as the price increases or the continuation of selling as the price decreases.
Price Failure
If price action sweeps above the previous higher high but then closes below, this shows weakness and could be the early sign of a reversal:
Support and Resistance in Market Structure
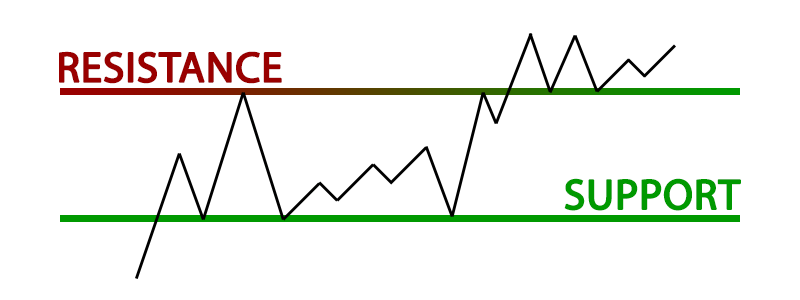
Price movement is often restricted within the limits of support and resistance levels. Price can cross these levels and shift to other areas of support and resistance.
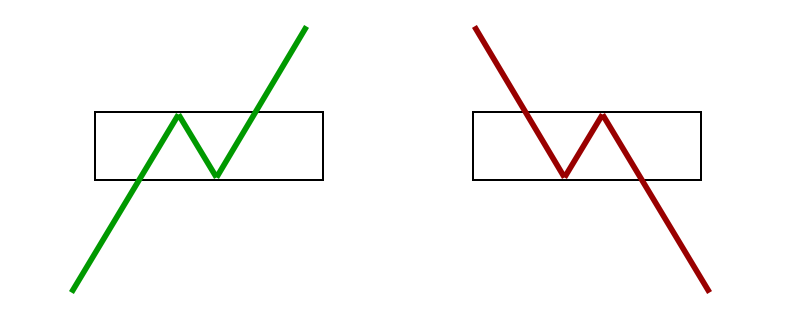
- Support: A price level that can halt a downtrend due to a concentration of demand or buying interest. Support levels usually contain a large number of buy orders in the order book from major market participants.
- Resistance: A price level that repels an uptrend due to the emergence of an increased number of sellers. Resistance levels contain a high volume of sell orders in the order book.
Why Is Market Structure Important in Trading?
Market structure is important for both new and professional traders since it can influence the liquidity and price action of a market. It’s also one of the most commonly used techniques to understand trends, identify potential reversal points, and get a feel for current market conditions.
Because market structure is a reflection of the two-way auction process and psychological changes of market sentiment, it provides incredible insight into how the market is behaving. It can provide vital clues about where the price action is heading next.
Market structure also helps to create efficient markets (asset prices reflect all available information). Market makers are a big part of this and supply liquidity to ensure smooth transactions.
How to Use Market Structure
Market structure can help you define if-then scenarios. For example, if a structure break occurs then look to get short on a pullback.
The Trend Is Your Friend
One of the most popular expressions in the trading world, and for good reason. If you can use market structure to identify a trend, more often than not, the price will continue in the same direction going forward.
Momentum
This is due to the simple fact that buyers (in a bullish trend) are already present. To reverse the trend, aggressive sellers must enter the market. Significant volume is required to not only put a stop to the current momentum but to then reverse the direction.
Much like reversing the direction of a speeding car, energy is first required to bring the car to a stop (breaking). Then, more energy is needed to start traveling in the opposite direction (reversing).
Patterns
Popular trading patterns like head and shoulders, inverse head and shoulders, double bottoms, and double tops are simply different types of market structures. They can represent trend breaks or trend continuation.
Patterns should never be used in isolation. As a trader, you should always understand how the pattern fits within the context of the current market and order flow. Just because a pattern is forming doesn’t mean it’ll behave as expected.
Which Assets Work Best with Market Structure?
Assets and trading instruments that have high liquidity, a high number of participants, and a high volume have a smoother and more obvious market structure. Forex, futures, bonds, and stocks are ideally suited to market structure analysis.
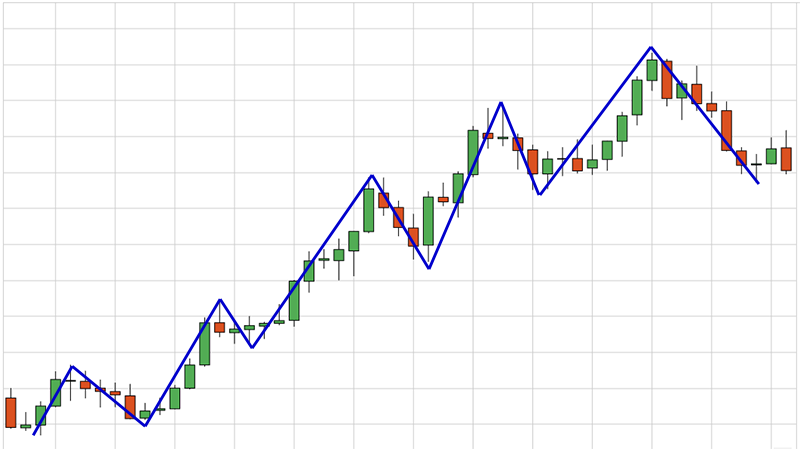
The following market structure example is taken from the EURUSD forex market and has a well-defined bullish structure:
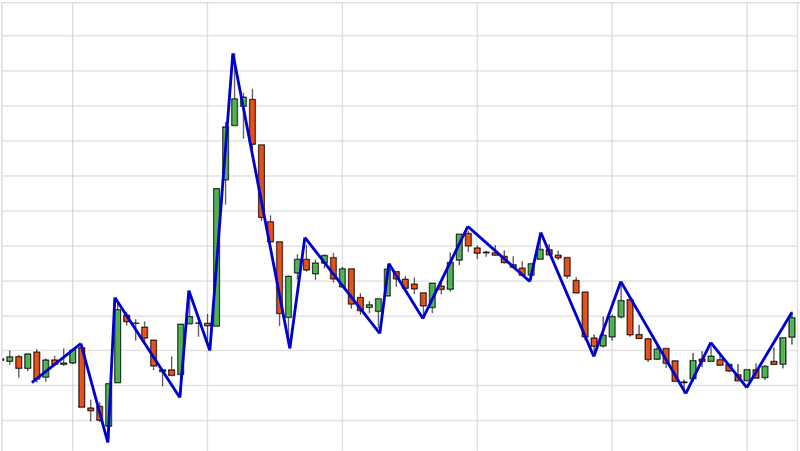
However, smaller stocks and some low-cap cryptocurrencies may lack enough liquidity to form a clean market structure, especially on low time frames:
What is the Best Time Frame to Identify Market Structure?
Market structure appears across all time frames and different time frames often display different market structures.
For example, while the overall market structure on the higher time frame may be trending up, the lower time frame structure may be in a current downtrend as the market pulls back, awaiting the influx of buyers to continue the higher time frame move.
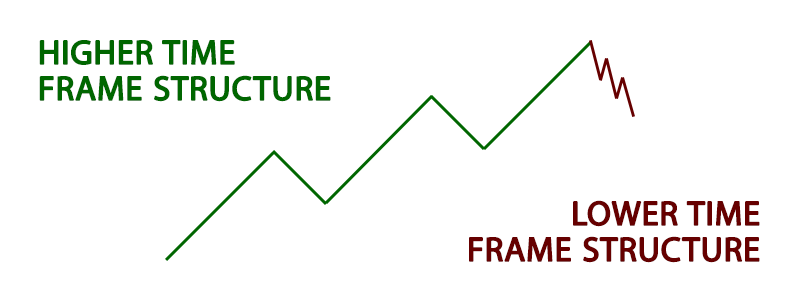
Higher volume is represented on higher time frames, which means more market participants and more reliable sentiment. This generally results in a more consistent market structure.
On lower time frames, the market structure can often be less predictable and chop from highs to lows.
The best approach is to have a clear understanding of the market as a whole. This includes low time frame, medium time frame, and high time frame structure. Think about how each time frame works together.
| Time Frame | Volume | Market Structure | Trading Style |
| Low | Low | Difficult to identify (chop) | Scalping and Day Trading |
| Medium | Medium | Somewhat identifiable | Day Trading and Swing Trading |
| High | High | Easy to identify | Swing Trading |
Examples and Trade Setups Using Market Structure
Market structure is not a trading strategy or specific setup. It’s more of a high-level concept that allows you to identify and understand overall market conditions.
It can be used to help with trade entries or more importantly, set invalidation levels and know when you’re wrong. You can also manage trades and babysit positions using market structure principles.
Here are some market structure examples:
Pullback or Retracement: When the market is in an up or downtrend, this pattern indicates that the price will push back and collect orders (producing a candle in the opposite direction) before continuing the trend.
Structure Hold: This is essentially a return to a previous pullback, then the continuation of the prevailing trend. It can result in trapped traders that expect the market to reverse but note how the trend remains intact. No lower lows (in the bullish example) or higher highs (in the bearish example) are created.
Continuation: This is a bullish or bearish structure where price forms a short consolidation or base before pushing higher. During the base period, traders reaccumulate or redistribute their position in anticipation of the next rally or drop. This can form a triangle or pennant pattern.
Advantages
Not only does market structure provide you with a clear overview of current market conditions and trends, but it can also help you identify support and resistance levels.
When using market structure to find support and resistance, look left and try to identify areas that have been consistently respected over time. If multiple tests have been performed at the same level there is a higher chance the level will be respected again.
Looking at the historical order book and identifying persistent resting liquidity can be a more reliable approach for identifying support and resistance levels. It removes the guesswork by showing the actual resting orders from other traders.
Understand Market Sentiment
Another benefit of using market structure in trading is that the market brings together the collective wisdom of multiple participants, weights it according to the size of the trades they make, and allows analysts to understand the collective sentiment.
Market structure has the advantage of defining when and at what price to buy and sell through trendlines and price goal targets, which has a significant benefit. After deciding on and marking out the borders of a possible formation, these boundaries correspond to a certain price and time coordinates that can be used to build specific trading and risk control strategies.
Limitations
Remember that the market can do anything at any given moment. Uncertainty of the market must be embraced and accepted. While market structure can provide clues, there are absolutely no guarantees and it only takes one significant aggressive buyer or seller to break the trend.
Market structure principles may appear quite simple, but the intricate details can take many years to master.
Market Structure FAQ
What’s the Difference Between Market Structure and Trend?
Market structure is the behavior, condition, and current flow of the market. It highlights support and resistance levels, swing highs, and swing lows. A trend is simply a consistent direction of price movement over time. Market structure can tell you if the market is trending or not.
What’s the Difference Between Price Action and Market Structure?
Price action is the change of price over time. Market structure is about taking a step back and organizing this price action into a set framework. For example, if the price action is creating higher highs and higher lows, it’s forming a bullish market structure.
How Do You Analyze the Market Structure?
The most basic form of analysis is to identify higher highs, higher lows, lower highs, and lower lows. Within these four basic structures, you can identify further price patterns like head and shoulders, double tops, triangles, flags, and pennants.
Combine Order Flow With Market Structure to Increase Your Edge
Basic candlestick charts can only tell you so much about market structure. To really understand the ebb and flow of the market you need to understand the order flow.
Without it, you’re trading in the dark. This is where the Bookmap comes in. Our cutting-edge platform lets you visualize the historic order book allowing you to see large market participants, identify trapped traders, and make smarter real-time decisions.
You can try it out today for free, click here to get started. We also offer lost a free education to get you up to speed. Watch the Market Education Basics playlist on Bookmap YouTube.
 Twitter
 Facebook