Assume an investor buys Microsoft stock at $110. That is now their break-even point on the trade. If the price moves above $110, the investor is making money. If the stock drops below $110, they are losing money.If the price stays right at $110, they are at the break-even point, because they are not making or losing anything.
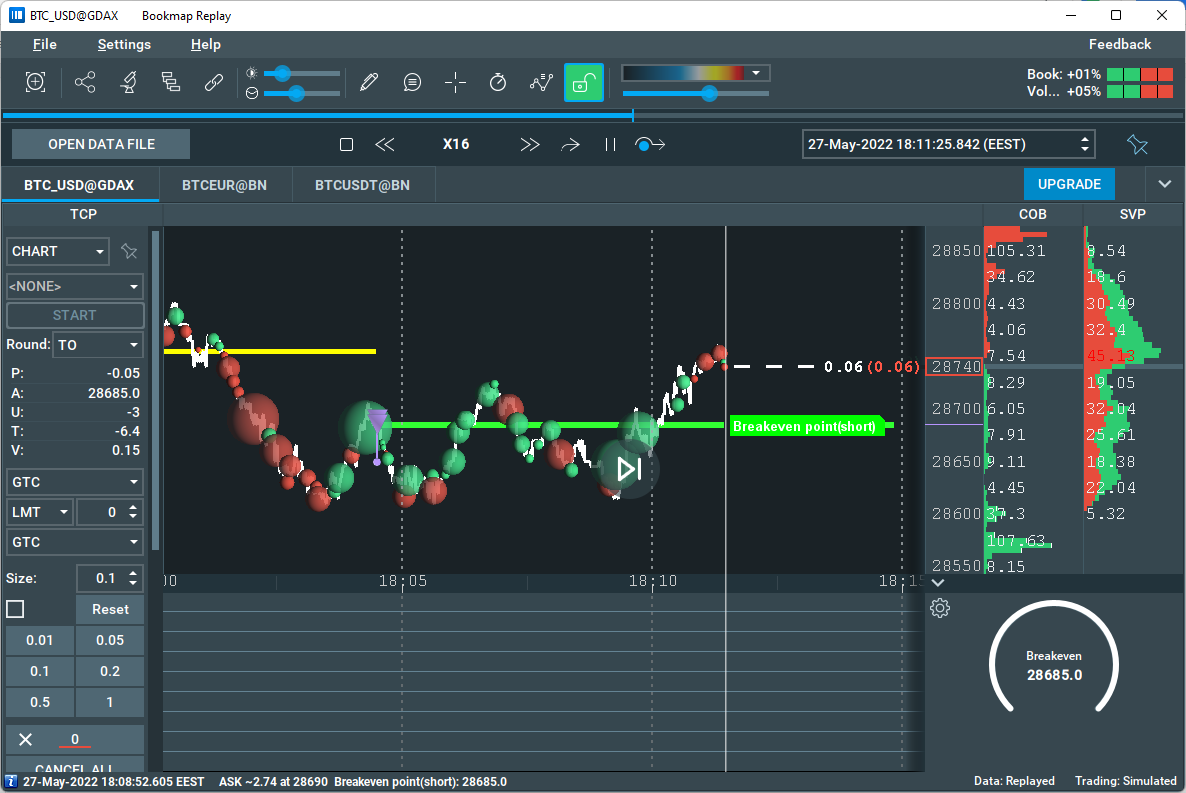
Learn more about the Breakeven Point Indicator here.