Options Surface
What is the Options Surface add-on?
Market maker gamma at every price level, minute by minute, on your ES chart.
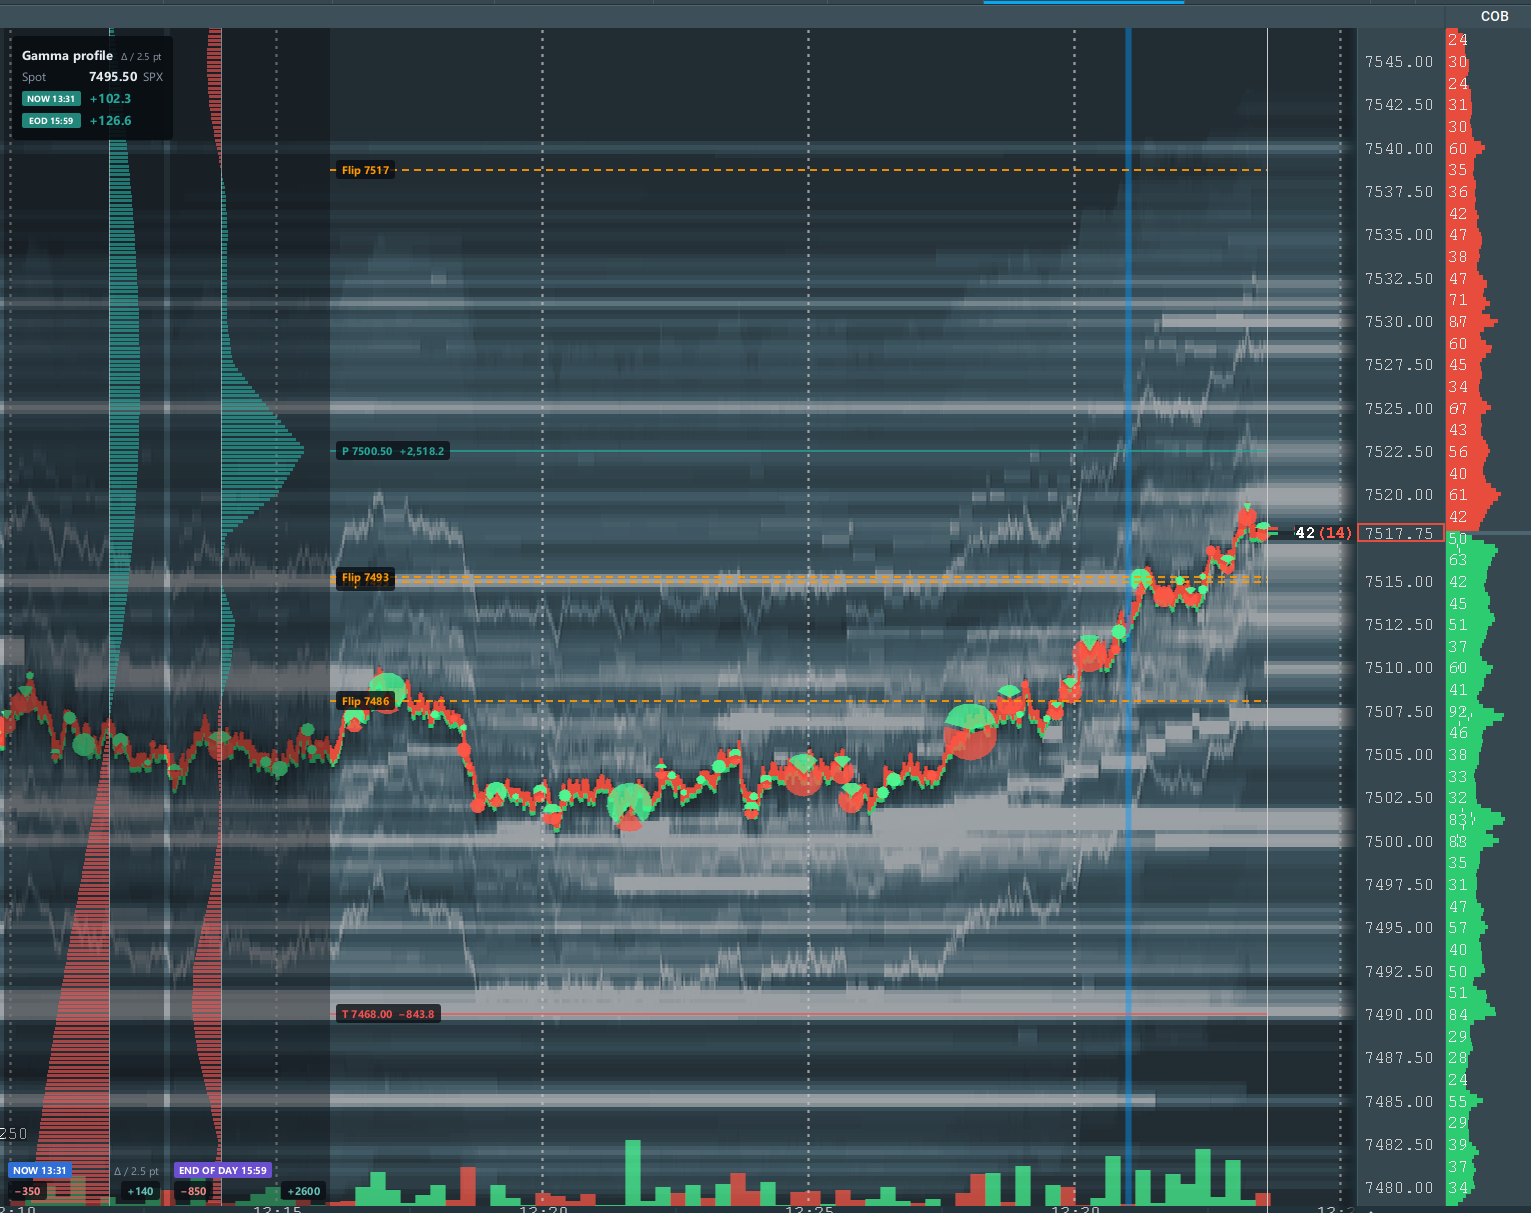
Options Surface is a Bookmap add-on, part of the Bookmap Options package. It draws SPX options positioning on an ES or MES chart. Options Strike shows the exposure of each strike on its own. Options Surface shows something different: for every SPX price level, 2.5 points apart, how much market makers' hedging would change if SPX were trading there. One minute of these values is a profile. The minutes of the session put side by side make the surface. The data is built by OptionsDepth from real market maker positions and updates every minute.
On the chart you get three things:
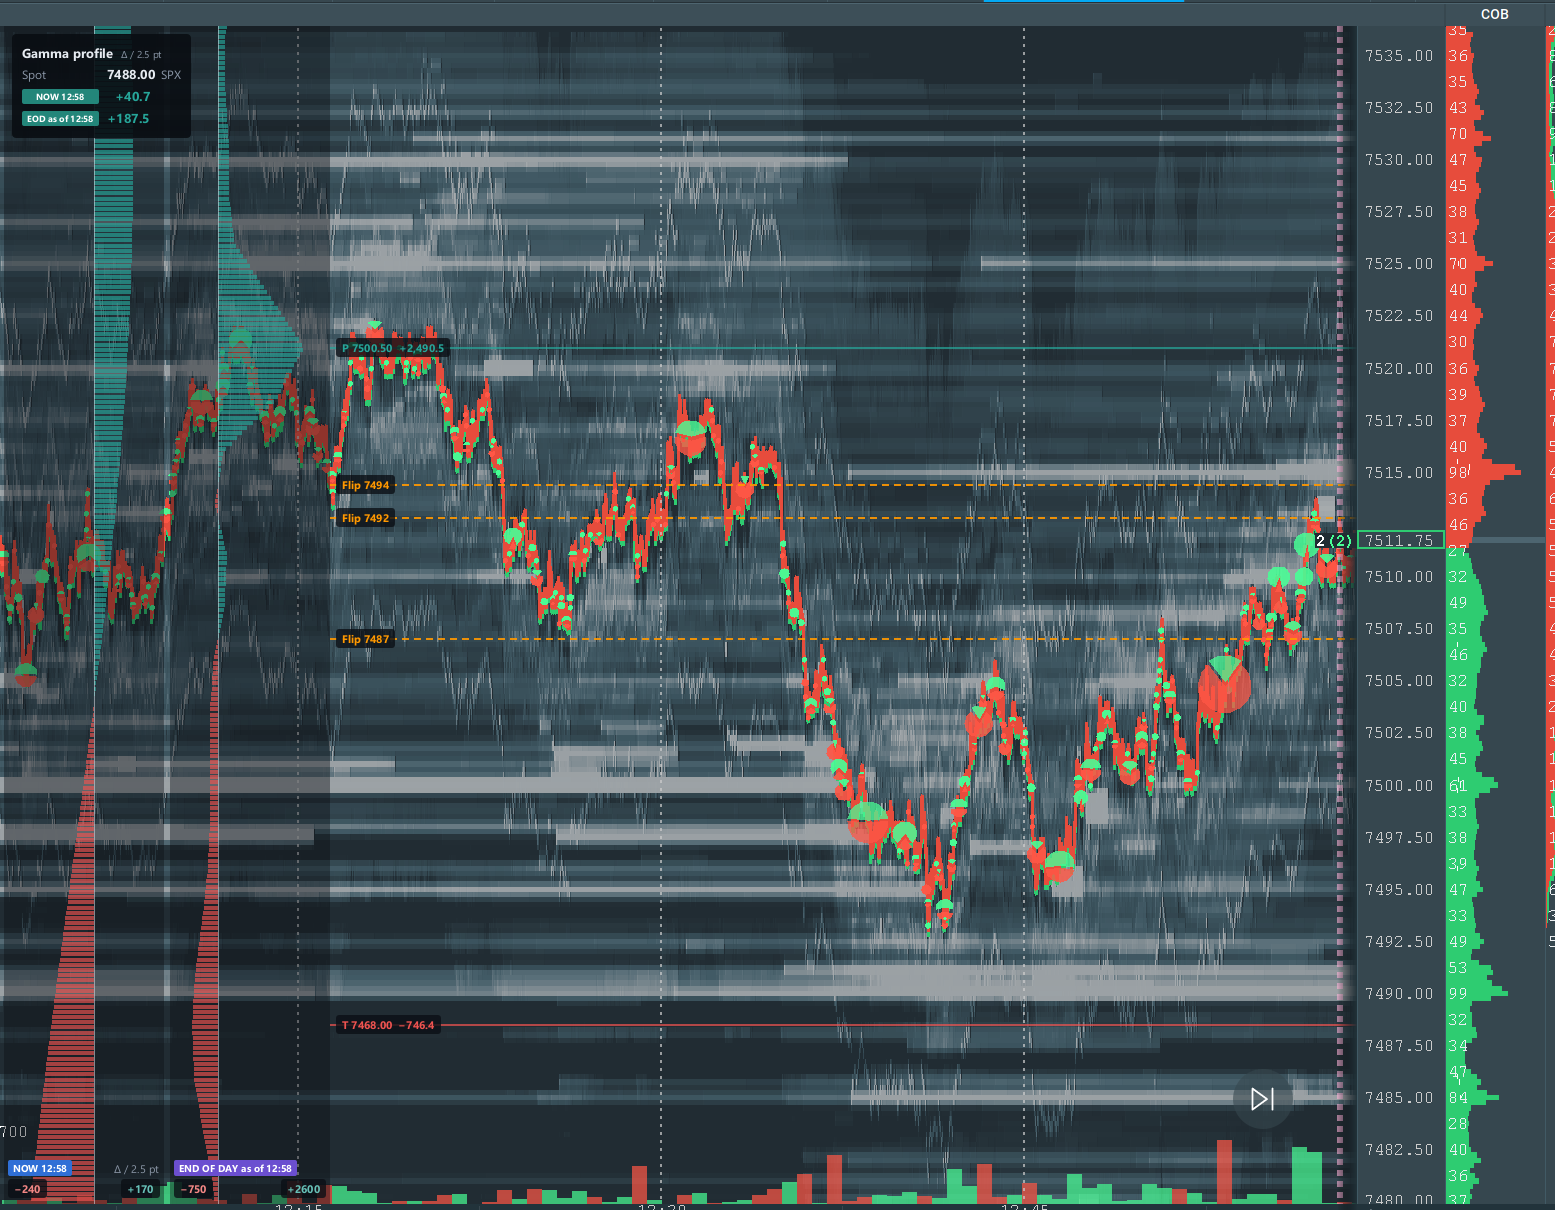
- Profile panels docked on the chart: the Now profile, the End of day projection, or both side by side, with one bar per price level for the minute on show.
- Key levels: that minute's peaks, troughs and zero flips, drawn as lines across the chart.
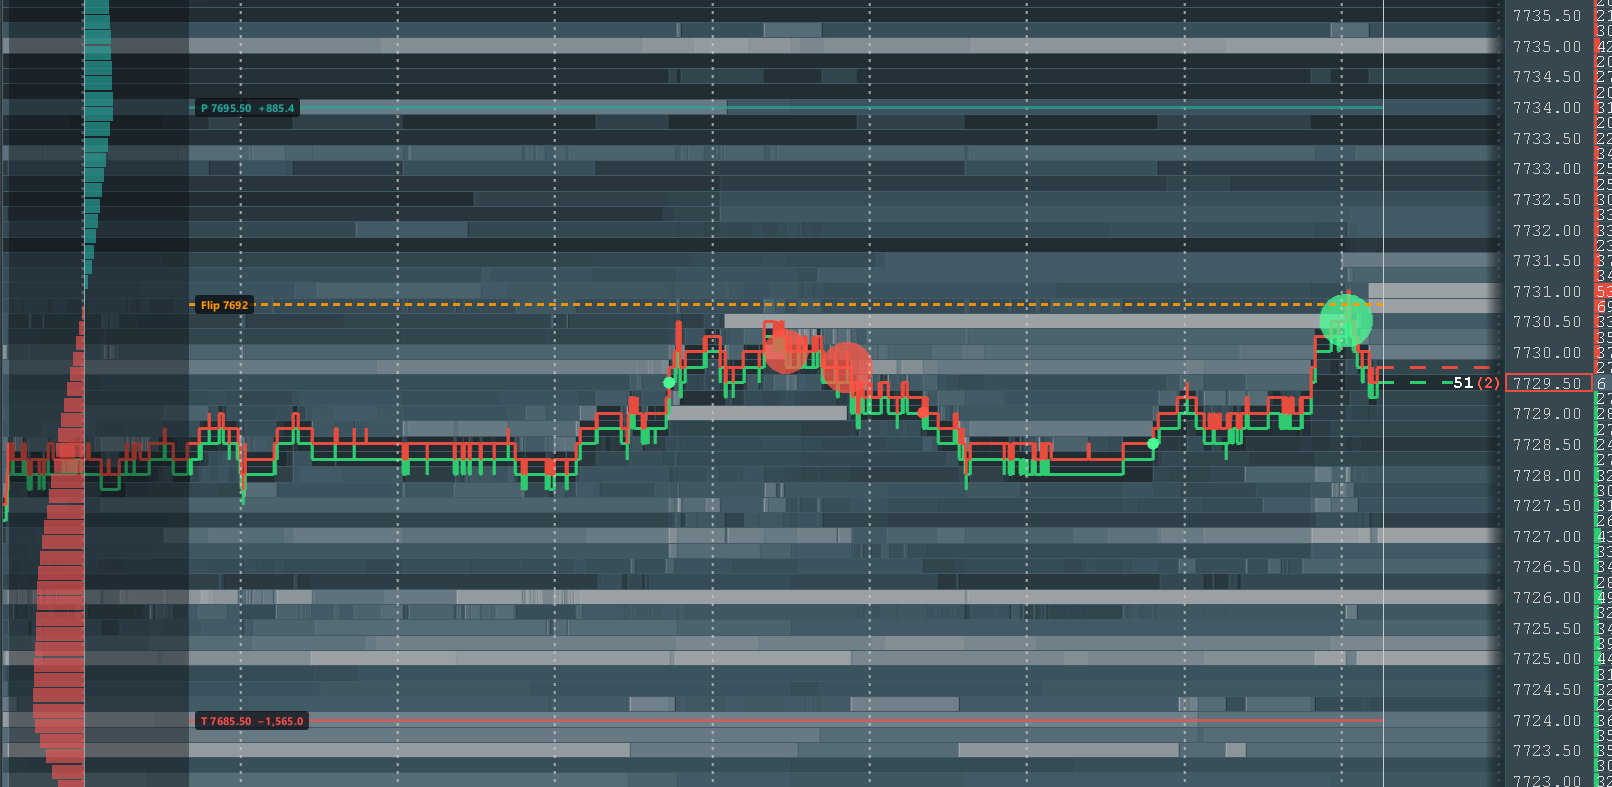
- Time markers: a line at the newest minute, and one at the minute the panels show when you have dragged the chart back.
Drag the chart back and the panels and the key levels follow the minute at the chart's right edge, so you can go back through how the market maker picture changed during the session. Bookmap replay is supported too: the add-on shows the replayed day as it was at the replay cursor.
This guide explains what the add-on shows, how to read it, and what every setting does. It assumes you already know your way around Bookmap. The gamma basics are the same as for Options Strike and are explained in more depth there: see Gamma in one minute and How market maker hedging moves price.
Where the data comes from
- Cboe, the exchange that lists SPX options, tags every trade by participant type.
- OptionsDepth uses that data to build the real market maker net position for each option. From those positions it computes, once a minute, the market makers' total gamma at every SPX price level around the current price, and a projection of how that profile will develop until the close.
- Bookmap fetches the result once a minute and draws it on your chart.
Live, the data is today's session. When the service starts the next session (with the first minute around 04:00 ET) the add-on clears the old day and loads the new one by itself. In replay it loads the replayed day instead (see Replay).
Trading hours and data timing
All times are New York time (ET).
| Time | What arrives |
|---|---|
| 04:00 – 09:24 | one snapshot per minute (pre-market) |
| 09:25 – 09:29 | nothing: these minutes are never published |
| 09:30 – close | one snapshot per minute, the last one shortly before 16:00 |
| After the close, weekends and market holidays | nothing new; the finished session stays on the chart |
Delivery delay
Cboe delivers each minute with a delay of up to about 90 seconds, so the newest minute on the chart normally trails your clock by one to two minutes.
What the value means
Each value is the market makers' gamma at that price level: how much their net delta changes when SPX moves
2.5 points from that level, in OptionsDepth's units (shown on the chart as Δ / 2.5 pt). Values come with one
decimal, for example +325.9.
- Positive (green by default): market makers are long gamma if price is at that level. Their hedging goes against the move. It works as a brake.
- Negative (red by default): market makers are short gamma at that level. Their hedging goes with the move. It works as an accelerator.
- Size: the larger the value, the stronger the effect if price trades there.
Options Strike shows millions of dollars per strike. Options Surface shows OptionsDepth's raw gamma per price level. Compare levels with each other by size and sign. Do not compare the numbers between the two add-ons.
Strike vs. price level
A strike value belongs to the options at that one strike. A price level value adds up every strike that would matter if SPX traded at that price. That is why the profile is smooth, why it has a few clear peaks and troughs, and why the places where it crosses zero are meaningful: on one side of a zero flip market maker hedging damps moves, on the other side it amplifies them.
Now and End of day
Every minute has two profiles:
- Now: the actual gamma at that minute.
- End of day: the 15:59 projection as it stood at that minute. This is the 0DTE close picture: where the peaks, troughs and flips are heading by the end of the session. Dragged back to 11:28, it is the projection as OptionsDepth saw it at 11:28, not today's newest one.
Getting started
Install
- Use the Addons Manager in Bookmap to install the add-on. It is called Options Surface.
- In Bookmap open Configure add-ons and tick Options Surface for an ES or MES chart.
The checkbox is per chart, and Bookmap remembers it: a chart that had Options Surface on when you closed Bookmap comes back with it on.
First load
As soon as you tick the checkbox the add-on asks for the newest minute and draws the profile panels and the key levels, usually within a few seconds. The session history follows on its own. After that the data refreshes automatically every minute.
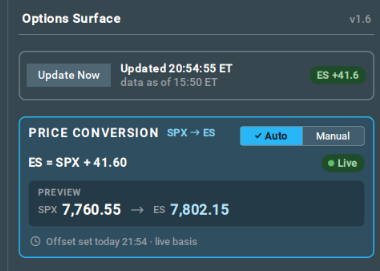
Open the add-on settings. The panel is titled Options Surface, with the version on the right. The Status card at the top tells you what is happening:
- Update Now fetches immediately instead of waiting for the next minute.
- The line next to it reads
Updated 20:54:55 ETwithdata as of 15:50 ETunderneath when new data arrived,Up to date …when the service had nothing newer, orFailed …with the reason in orange underneath when something went wrong. Both times are New York time: the first is when the answer arrived, the second is the data minute. - The small pill on the right, for example
ES +41.6, shows the SPX-to-ES price conversion in use (see Price conversion (SPX → ES)).
Wrong instrument
The add-on only runs on ES and MES. On any other chart the settings panel shows just the title and an amber
banner: "<symbol> is not supported. Options Surface plots the SPX greek surface on ES and MES charts only. Open an
ES or MES chart to use it."
Reading the chart
The profile panels
The panels are docked on the chart, at the left edge by default. Pick which ones to show with Display > PROFILE > Profiles: Now (the default), End of day, or both. With both on they sit side by side, Now on the left.
Each panel has:
- One bar per price level, at that level's ES price, for the minute on show. The thin light vertical line is zero: positive values (green) extend to its right, negative values (red) to its left.
- Its own scale: the two numbers in the bottom corners, for example
−350and+900, are the values at full bar length on each side. End of day often runs several times larger than Now, so compare the shapes of the two panels, not their bar lengths. - A chip just above the scale, in the profile's colour (blue for Now, purple for End of day), naming the minute:
NOW 09:56,END OF DAY 15:59, orEND OF DAY as of 11:28when the chart is dragged back. A narrow panel uses the short form,EOD 15:59. The unit,Δ / 2.5 pt, sits beside it when the panel is wide enough.
Display > PROFILE > Scale sets what the scale fits:
- Visible range (default): the levels on screen, so the bars fill the panel. A scroll or zoom refits it at once; from one minute to the next it changes only when the bars clearly outgrow or shrink inside it, so it does not jump.
- Whole profile: every level the service sends, so a scroll never changes the bars. A large level far off screen can leave the bars on screen short.
Move the panels anywhere across the chart with Position, and set each one's width with Now width and EOD width.
The readout card

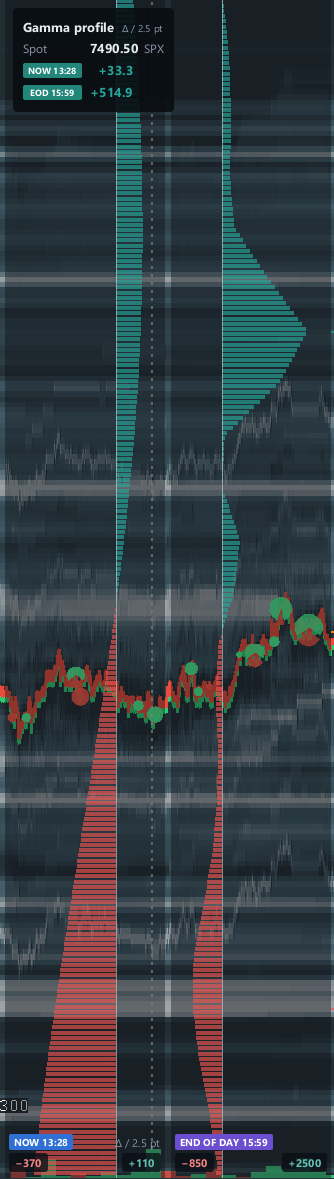
The readout sits at the top of the panels.
| Line | Meaning |
|---|---|
| Title | Gamma profile with the unit, Δ / 2.5 pt |
| Price | the SPX price level nearest your cursor, when the cursor is on the heatmap |
| Spot | shown instead of Price when the cursor is off the heatmap: the current price, converted to SPX and snapped to its 2.5-point level |
| One row per shown profile | the profile's chip (NOW 10:59, EOD 15:59) and its value at that level |
Each row's chip is filled red or green by the sign of its value. With the cursor off the heatmap the values are read at spot, so the chips tell you the regime at the current price: short or long gamma, for each profile. Close to expiry the End of day profile can change sign from one level to the next, so its chip can change with a 1–2 point move: it tells you which side of the nearest flip the price is on.
Move the cursor over the heatmap and a marker on the panel jumps to the nearest 2.5-point level, with its price and values in the readout. The cursor does not change the minute shown.
The price in the readout is the SPX level, like the strike labels in Options Strike. The bars themselves sit at the ES price of each level.
Key levels
The key levels are the shown minute's turning points, drawn as horizontal lines across the chart at their ES price:
| Level | Line | Label | What it is |
|---|---|---|---|
| Peak | solid, positive colour | P 7625.00 +412.0 | a local high of the profile above zero: a level of large positive gamma |
| Trough | solid, negative colour | T 7550.00 −288.4 | a local low of the profile below zero: a level of large negative gamma |
| Flip | dashed, flip colour (orange) | Flip 7598 | a level where the profile crosses zero |
Labels show the SPX price, and for peaks and troughs the value. A flip lies between two 2.5-point levels, so its price is rounded to the whole point.
A level has to stand out from the levels around it to be drawn. Sensitivity sets how much, as a share of the profile's largest value: higher keeps smaller levels. A broad, flat area gives one level, not a cluster of labels a few points apart.
Display > KEY LEVELS > Levels from picks which profile the levels come from: Now (default), End of day, or both, whatever the panels show. With both on, each label starts with N or E and carries the profile's colour on its left edge, and Now's lines are drawn fainter.
The lines run across the chart on each side of the profile panels, not under them, and the labels sit at the panels' edge. With the profile panels switched off the lines span the whole chart and the labels sit at the nearer chart edge.
Time markers
- A solid light blue vertical line at the newest minute (in replay, at the replay cursor).
- A dashed light pink vertical line at the minute the panels show, when you have dragged the chart back.

Which minute is shown
The minute on show follows the chart's right edge, not your cursor.
- Chart at the live edge: the panels show the newest minute: Now is its actual profile, End of day the newest projection.
- Chart dragged back: everything, panels, key levels and readout, shows the minute now at the chart's right edge. Dragging scrubs through the session: Now is that minute's actual profile, End of day the projection as it stood then. The dashed time marker follows. The picture changes only when the right edge crosses into another minute.
Because the minute follows the chart and not the cursor, scrubbing also works when the cursor is over Bookmap's own panels or the trading strip.
- Before 04:00 of today the panels hold the session's first minute.
- On a previous day while live, the panels show today's newest minute. Use replay to look at past days.
Replay
Options Surface works in Bookmap replay. It shows the replayed day as it was at the replay cursor: both profiles, the key levels, the readout and the price conversion of that minute.
- The first time the cursor enters a day, the add-on loads that day's data.
- Drag back from the cursor to scrub through the replayed day, as in live mode.
- Update Now loads the replayed day again.
- Before 04:00 ET on the replayed day nothing is drawn yet.
- A day without data (a weekend, a market holiday) shows nothing, with one notice:
No Options Surface data for <day>.
Reading patterns
These are tendencies, not rules.
| What you see | Usually means |
|---|---|
| Price near a large peak | a brake: moves tend to slow, stall or pin there, especially late in the day |
| Price inside a deep trough | an accelerator: moves tend to speed up and run until the next positive area |
| A zero flip just above or below price | the line where the market can change behaviour, from damped moves to fast ones (or back) |
| Price between two peaks | a range: hedging tends to push price back from both sides |
| A level that grows as you scrub forward | positioning is building there during the session |
| End of day differs a lot from Now | the projection expects the picture to shift into the close, usually as 0DTE gamma concentrates near price |
| The Now and EOD chips have different colours | the current price is long gamma on one profile and short on the other: the regime is expected to change into the close |
Combine with order flow
The surface shows where market maker hedge flow is likely to damp or amplify a move. Bookmap's order flow shows what traders are doing at that price now.
- Peak + large resting liquidity on the heatmap: higher chance of a stall.
- Trough or flip + thin liquidity: higher chance of a fast move.
Use it to find the levels to watch. Then let the order flow show what price does there.
Price conversion (SPX → ES)
The options data is for SPX, but the chart is ES or MES. The two trade a few points apart, and the gap changes daily. The add-on shifts every SPX level by this gap so the bars and lines sit at the right ES price. Conversion is always on.
ES level = SPX level + offset e.g. 7,600 + 53.25 = 7,653.25
The Price Conversion card works exactly as in Options Strike, with an Auto | Manual toggle:
- Auto (default): the add-on measures the offset itself from live prices (the ES trade just before each data minute, minus the SPX price that arrives with the data) and smooths it, so it does not jitter.
- Manual: type an Offset (
ES = SPX + value) or a Ratio (ES = SPX × value). Back to Auto returns to the live offset.
A past minute uses its own offset
With Auto, a minute you have dragged back to, or any minute in replay, is converted with the offset of that time,
so the levels sit where they were then, not where today's offset would put them. The offset is the median of the
last 15 minutes up to the minute shown, so one noisy minute does not move the levels. The card's footer then reads,
for example, Offset for today 12:58 ET · 15-min median, or Offset for Oct 28 11:28 ET · 15-min median for
another day.
See Price conversion in the Options Strike guide for the details, the pills and the preview. Each add-on measures and stores its own offset, per chart.
Settings reference
Open the add-on settings from the chart. Settings are per chart. Sections appear in this order.
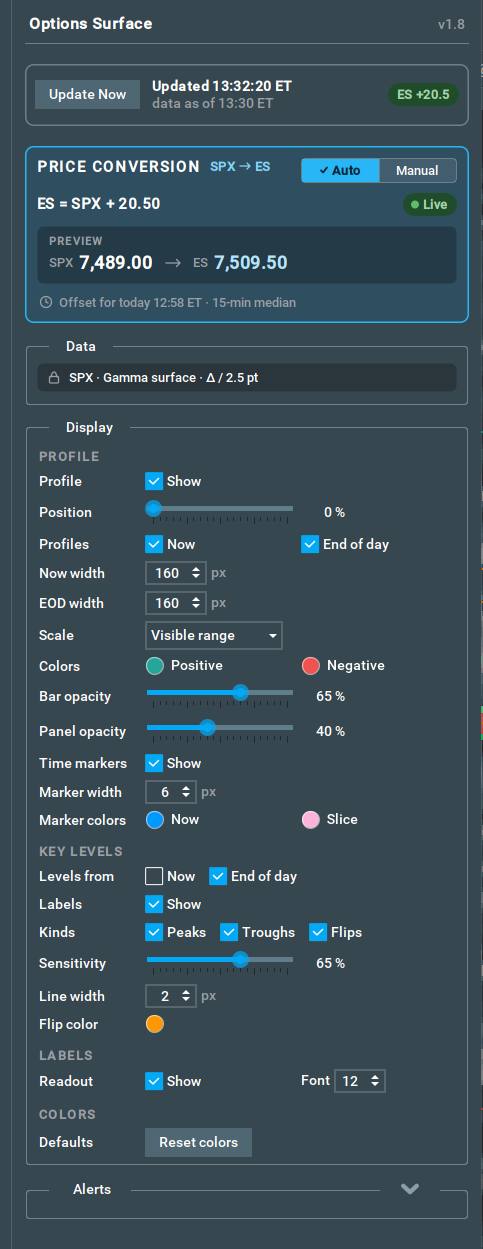
Status
| Control | What it does |
|---|---|
| Update Now | Fetch the newest data immediately (always a full request). In replay it loads the replayed day again. |
| Status line | Updated, Up to date or Failed with the time the answer arrived (ET). Underneath: the data minute in ET, or for Failed the reason, in orange. |
| Conversion pill | The SPX-to-ES conversion in use, for example ES +41.6. Amber · check when it needs attention. |
Price Conversion
| Control | Default | What it does |
|---|---|---|
| Auto / Manual | Auto | Auto measures the ES − SPX offset from live prices. Manual uses a value you type. |
| Type (Manual) | Offset | Offset: ES = SPX + value. Ratio: ES = SPX × value. |
| Value (Manual) | live offset / 1.0 | Offset from −1000 to 1000 in steps of 0.25. Ratio from 0.000001 to 1000. |
| Back to Auto (Manual) | Use the live offset again. | |
| PREVIEW | The SPX price of the minute on show converted with the settings above. |
Data
| Control | What it does |
|---|---|
| Locked summary | SPX · Gamma surface · Δ / 2.5 pt. Fixed in this version: the SPX market maker gamma surface, one snapshot a minute. |
Display
PROFILE
| Row | Default | What it does |
|---|---|---|
| Profile: Show | on | The profile panels with their bars, scales and readout. Off, the key levels and time markers stay, and the key levels span the whole chart. |
| Position | 0 % | Where the panels sit: 0 = the left edge of the chart, 100 = the right edge. |
| Profiles: Now / End of day | Now | Which panels to show. With both on they sit side by side. At least one stays on. See Now and End of day. |
| Now width / EOD width | 140 px | Width of each panel, 100–520 px. Greyed out while that profile is off. On a narrow chart both shrink in proportion. |
| Scale | Visible range | What each panel's scale fits: Visible range (the levels on screen) or Whole profile (every level). See The profile panels. |
| Colors: Positive / Negative | green #26A69A / red #EF5350 | Bar colors. They also color peak and trough lines and the readout values. Click a swatch to change; the picker has Reset to default. |
| Bar opacity | 90 % | Opacity of the bars, 0–100. |
| Panel opacity | 65 % | Opacity of the dark backdrop behind the bars, 0–100. |
| Time markers: Show | on | The solid line at the newest minute and the dashed line at the minute shown. |
| Marker width | 1 px | Width of both lines, 1–8 px. |
| Marker colors: Now / Slice | light blue / light pink | Colors of the two lines. |
KEY LEVELS
| Row | Default | What it does |
|---|---|---|
| Levels from: Now / End of day | Now | Which profile's levels to draw, whatever the panels show. Both off = no lines. |
| Labels: Show | on | The price and value labels at the panels' edge. |
| Kinds: Peaks / Troughs / Flips | all on | Which levels to draw. |
| Sensitivity | 65 % | Higher keeps smaller levels. |
| Line width | 2 px | Width of the peak, trough and flip lines, 1–25 px. |
| Flip color | orange | Color of the dashed flip lines. |
LABELS
| Row | Default | What it does |
|---|---|---|
| Readout: Show | on | The readout card in the panels. |
| Font | 12 | Text size of the readout, the scales and the key level labels, 8–32. |
COLORS
| Row | What it does |
|---|---|
| Reset colors | Every color in Display back to its default. |
Alerts
Collapsed by default.
| Control | Default | What it does |
|---|---|---|
| Sound: Play on update | off | Play a short tone when a new snapshot arrives. It also plays on most fetch errors, so a tone with no visible change is worth a glance at the Status line. |
| Volume | 5 | 0 = off, 10 = maximum. |
When nothing shows
-
The checkbox is off. The settings panel opens with an amber banner and greyed controls: "Options Surface is off on this chart". Tick Options Surface for the chart in Configure add-ons.
-
Not an ES or MES chart. The panel shows only the banner. Open an ES or MES chart.
-
Just turned on. The newest minute shows within a few seconds. Dragging back shows nothing older until the session history has arrived.
-
Replay, a day without data. One notice,
No Options Surface data for <day>, and nothing is drawn for that day. -
The chart does not move. Bookmap redraws add-ons when the chart moves. On a still chart (paused, auto-scroll off) a change can wait until you scroll or zoom.
Good to know
- The data is per minute, not tick by tick.
- The projection is a model. It shows where positioning is heading if nothing changes; new trades change it every minute.
- MMs hedge delta. This is an assumption. Market makers can also hedge with other instruments, only in part, or later.
- Past days are in replay. Live, dragging into a previous day still shows today's profile; replay that day to see its own.
This guide is educational. The past behavior of a level does not guarantee its future behavior.
Data and methodology by OptionsDepth. Add-on by Bookmap.