Extended Depth History
Extended Depth History lets you scroll and zoom far back into full-depth historical data on the heatmap, instead of being limited to recently loaded data. History loads automatically as you change the time frame, and how far back you can go depends on the instrument.
Requirements
- An active BookmapData subscription. Extended Depth History is available only to BookmapData users.
- A supported instrument opened through BookmapData. See Supported instruments and available history below.
How to use Extended Depth History
- Go to Settings and turn on Extended Depth History.
- Open a supported instrument through BookmapData.
- Zoom out with your mouse wheel, or choose a period from the [time slice] dropdown menu.
- History loads based on the time frame you select.
You can still load history manually at any time with the History Load button on the left edge of the chart. All live data features work as before.

Supported instruments and available history
Instruments and the history available for them:
- ES/MES/NQ/MNQ history starting from October 2021
- Other CME instruments starting from 25 Jul 2026
- All Multibook instruments starting from May 2025
- 1000 NASDAQ instruments (top 1000 based on daily volume) starting from December 2025
For the complete list, see Extended Depth History Supported Instruments.
Key limitations
- Some add-ons do not yet support dynamically loaded historical data.
- Some Bookmap features like columns, candlesticks, and certain indicators are not yet fully compatible with dynamically loaded data.
Where recent data ends on the chart
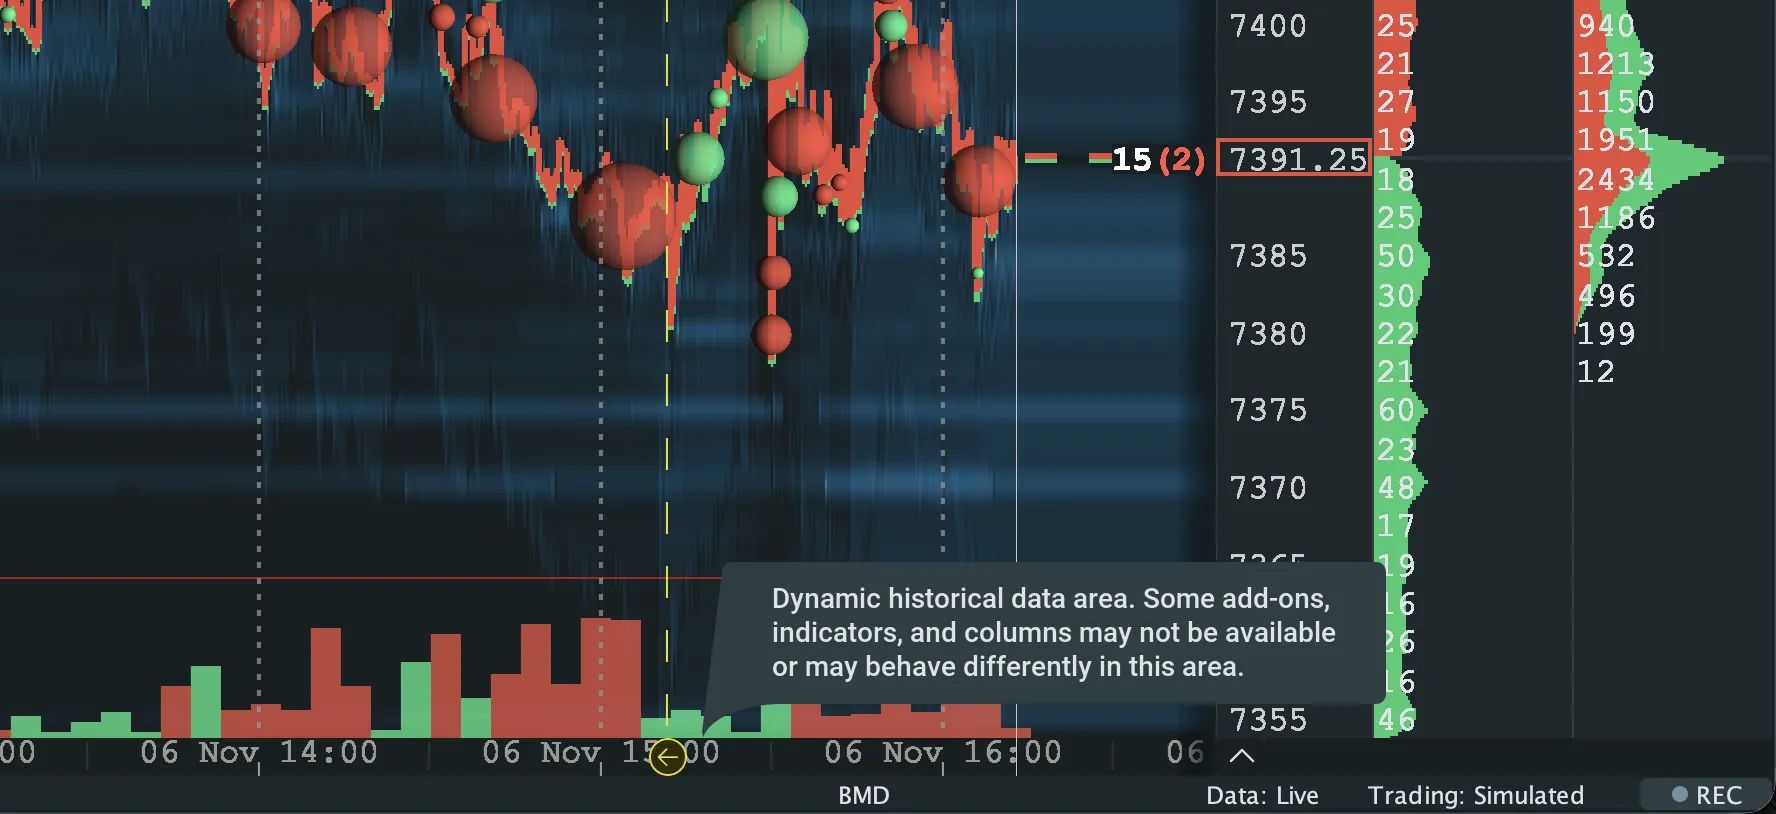
A boundary line marks where recently loaded data ends and Extended Depth History data begins. Hover over the boundary to see a tooltip explaining why some features behave differently on the historical side.