Liquidation Indicator
What Is the Liquidation Indicator?
Perfect for assessing market trends and patterns, the Liquidation Indicator highlights where margin positions are liquidated. It allows you to see the price level of the liquidation, the volume that was liquidated, and whether the event happened on the buy or sell side.
The Liquidation Indicator is only available for select crypto instruments and exchanges that support liquidation data. If the indicator is not working, it is most likely because it is not compatible with the exchange it has been applied to.
How It Works
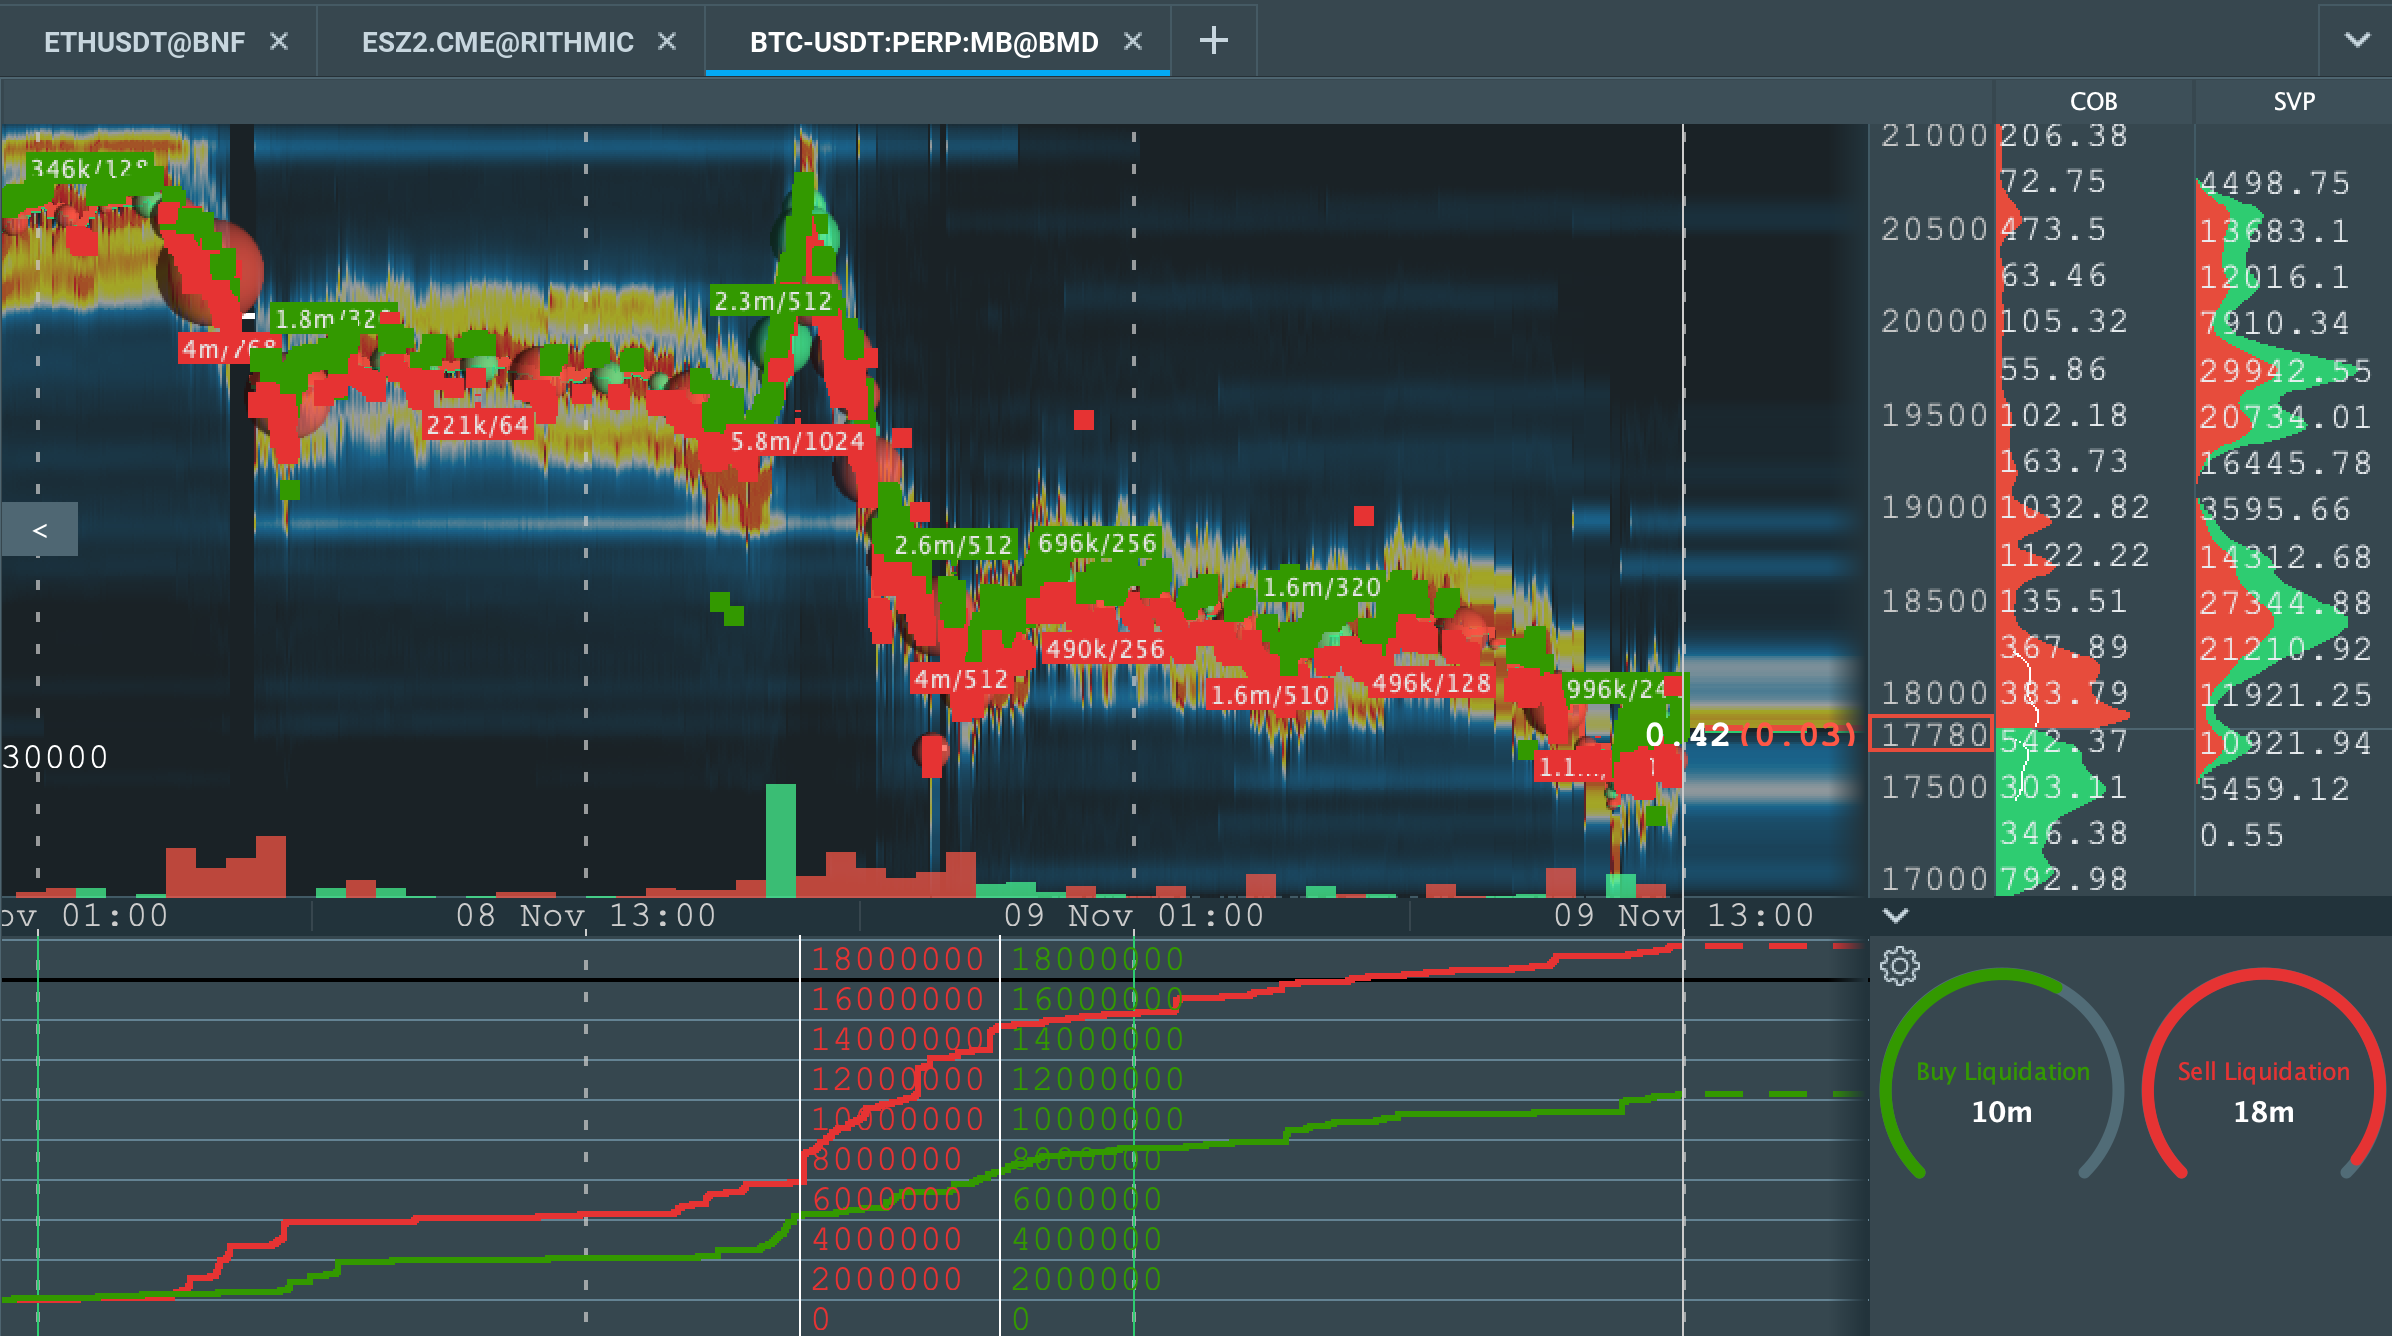
The Liquidation Indicator has two visualization modes.
-
On-Chart: Liquidation data is visualized directly on the main Bookmap chart. When a liquidation occurs a marker is displayed, along with any aggregate information.
-
Sub-Chart: Liquidation data is visualized in a sub-chart. Liquidations are accumulated over time and plotted on a line chart.
The On-chart visualization is perfect for identifying specific market events, while the Sub-chart visualization helps you see clearly the overall trend of liquidations.
How to Configure the Liquidation Indicator
Please note that settings for the Liquidation Indicator are individually configurable for each instrument, allowing you to customize your Liquidation Indicator settings depending on what chart you are using it with.
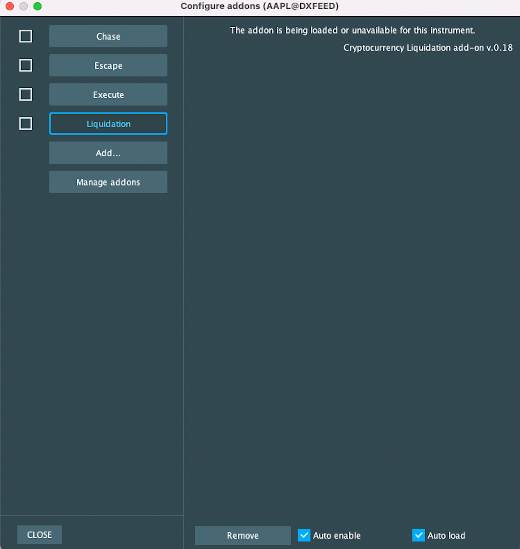
If an instrument doesn’t support liquidation data, you’ll see the following message on the settings panel:
Liquidation Volume Units
The Liquidation Volume Units setting lets you change which currency the liquidation data is displayed in. There are two options available.

-
Base Currency: Displays the liquidation volume using the base currency unit (for example, BTCUSDT will display the liquidation volume in BTC)
-
Quote Currency: Displays the liquidation volume using the quote currency unit (for example, BTCUSDT will display the liquidation volume in USDT)
Currency Threshold
The threshold setting defines the minimum liquidation volume required to display a marker. To concentrate on bigger market events, simply raise the threshold, and for more detailed display data instead lower the threshold.
Note that the currency unit used is based on the how you configure the Liquidation Volume Unit (see above). This means for a BTCUSDT graph, the base threshold unit will be BTC, and the quote threshold unit USDT.

Liquidation Indicator Aggregation
Setting a threshold value of 0 for the currency threshold will display every single liquidation event, which can lead to a very cluttered and confused chart.
To avoid this, overlapping liquidation markers are aggregated and displayed as number of events/total volume. For example, the aggregated marker 0.498/8 is displayed below.
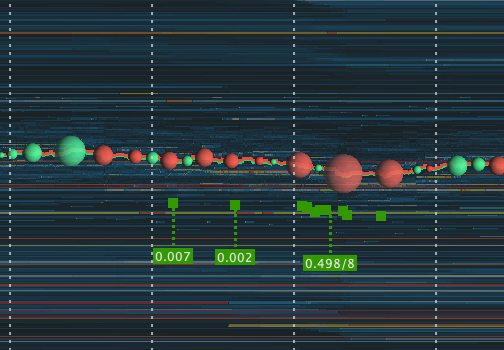
This indicates that there were 8 separate liquidation events with a total volume of 0.498, and those events were aggregated into one marker. To see the individual markers, you can zoom in on the graph.
Icon Position
The icon position settings determine how the liquidation information is displayed on the main chart.

-
Show liquidation marker: when enabled, Bookmap will display a square icon where the liquidation was triggered.
-
Show icon values: when enabled, Bookmap will display key liquidation volume information on the main chart. The number variable defines the distance (in pixels) between the position of the liquidation event and the volume information.
If the 'Show liquidation marker' option is disabled and the 'Show icon values' option is enabled, you will only see an icon with the volume information below the liquidation event, but no marker of the actual event on the graph.
If both checkboxes are disabled, you will not see any information about the liquidation on the main chart.
Liquidation Sources (available in Bookmap 7.4)
This configuration allows users to display liquidations that come from a specific source. It is only available for multibook instruments.

Liquidation Indicator Colors
Colors for the on-chart liquidation markers and text are fully customizable, and traders can select preset colors or use the color picker to choose any color on their screen.

Sub-Chart Configuration
When running in sub-chart mode there are several configuration options available, as shown below.

Split Buyers/Sellers
Traders can check this option to create a chart where buy and sell liquidations are plotted as two separate lines on the sub-chart:

If this box is unchecked, buy and sell liquidations are combined into a single line. Sell liquidations are plotted as positive values and buy liquidations as negative values.
Separate colors are still displayed for the buy and sell sections of the line, so traders can still easily identify market patterns on the sub-chart line.

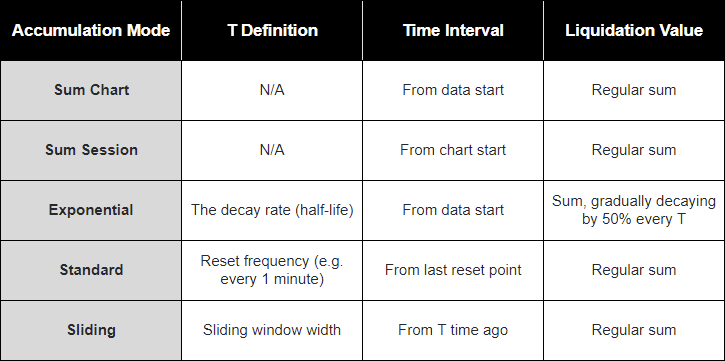
Accumulation Mode
Several different accumulation modes are supported:
Liquidation Alerts
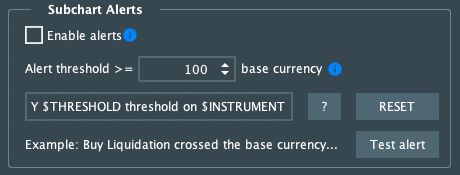
The Liquidation Indicator features configurable audio alerts, allowing you to keep track of liquidations while viewing other charts.
Enable Alerts
Select this checkbox to enable voice and text alerts that are triggered when the sub-chart value hits the configurable alert threshold.
Please note that these alerts are not supported for the 'Sum Chart' and 'Sum Session' accumulation modes.
Alert Threshold
Here you can configure the minimum liquidation value required on the sub-chart to trigger an alert message. For example, a threshold of 0.8 would trigger 3 alerts on the below sub-chart.

Note: If Split Buyers/Sellers is disabled, the threshold will work for both positive and negative values (e.g. if the value crosses -0.8, it will trigger an alert message).
Alert Template
Use this field to customize how you want the alert message to be displayed. The '?' button shows you a list of the available template variables:
- $INSTRUMENT: Full instrument name
- $SIDE: Buy or sell
- $THRESHOLD: Current volume threshold
- $CURRENCY: 'Base Currency' or 'Quote Currency'
An example of your alert is displayed below the alert template field.
Use the RESET button to reset the alert template field to default settings.
Select 'Test Alert' to play an alert using your alert template.
Liquidation Indicator FAQ
Here is a list of frequently asked questions for the Liquidation Indicator.
Which Exchanges Are Supported?
There are currently 3 exchanges that support liquidation data:
- Binance Futures
- Bitfinex
- Bybit
Please refer to the crypto connectivity table for more information on which crypto exchanges support liquidation data.
Note: These exchanges may have some instruments which don’t support liquidation data.
Which Instruments Can I Test the Liquidation Indicator On?
We recommend subscribing to BTCUSDT or ETHUSDT on Binance Futures to start seeing some liquidation events, as these are typically the most consistently active.
You may have to wait up to 30 minutes to see the first liquidation, depending on market conditions.
You can also try PERP instruments on BTCUSDT INVERSE and PERP on ByBit.
Why Don’t I See Any Liquidation Markers on the Chart?
There could be several reasons why you’re not seeing any liquidation events:
-
Make sure that the exchange and instrument support liquidation data (see the crypto connectivity table). If the exchange isn’t supported you’ll see an error message on the Liquidation Indicator settings panel
-
Make sure you’re running the latest adapter for the exchange (Settings Menu > Manage Connections)
-
Try decreasing the Base Currency Threshold to 0
-
Zoom out and scroll around the chart to check for missing liquidations
-
Wait until liquidations are triggered on the exchange platform. This usually happens during volatile market conditions.
If you still don’t see any markers, contact support@bookmap.com for further assistance.
What Are the Recommended Settings for the Liquidation Indicator?
We suggest that you experiment with the settings until you find something that works for you.
The exact settings will depend on how you want to use the Liquidation Indicator, current market conditions, the specific instrument you are using, preferred zoom level, and other individual needs.
If your chart is too cluttered, we suggest that you increase the Base Currency Threshold, and the best way to see more/less detail and focus on larger or smaller market events is to zoom in and out.
Is It Possible to See Liquidation Events in Replay Mode?
No. Currently, liquidation events are not recorded and so cannot be seen in Replay Mode,though we plan to implement this feature soon.
Do I See All Liquidation Events by Binance Futures?
No. The Binance Futures exchange doesn’t broadcast all liquidation events - instead it sends only the last event of every second. For example, if there were 100 events within one second, you’ll only see the last event due to the data given by Binance.
How Accurate Is the Liquidation Data?
Bookmap displays what is received from the exchange, so its accuracy depends on the exchange. Most of them provide data on liquidations as they happen, without any aggregation. Binance Futures, however, is an exception and only provides the last liquidation per second (see above).
Can I See Liquidations on Backfill and Historical Bookmap Data?
Liquidations for backfill data have been supported by Bookmap starting from version 7.4. You can get historical liquidations for supported exchanges and Multibook instruments.
Will I Get Alerts if My Sub-Chart Is Hidden?
Yes, you will always get alerts when the 'Enable Alerts' checkbox is selected, even if your sub-chart is minimized or disabled.
How to Install the Liquidation Indicator
If you already have an active Global or Global Plus subscription, proceed to the steps below.
If you're a Digital or Digital Plus subscriber, first you need to upgrade your package. Click here to upgrade to either Global or Global Plus. If you're new to Bookmap, first you need to register an account and subscribe to either Global or Global Plus.
This add-on takes advantage of the Add-ons Manager feature, which simplifies both the installation and updating process. If you'd like to learn more about the Add-ons Manager and how it can benefit your experience, please visit the following page.