See size orders more clearly in real time.
Compare plans to access deeper market visibility for size orders.
Market Analysis
January 12, 2024
SHARE
4 Ways to Trade with Tradermap Pro
This is a guest post by nybammer
TraderMap Pro Insights
Executive Summary
TraderMap Pro provides important levels that tend to act as “magnets” for future Price Action (PA). Those levels appear to provide “cleaner” targets than the usual unfiltered Bookmap liquidity levels. Filtering by order size seems to be the most important feature of TraderMap Pro. The order sizes are index specific. For instance, ES requires a higher order size threshold than say NQ or RTY. As a rule of thumb, 100 for ES and 50 for NQ/RTY seem to do a good job to filter out the noise.
One can use the Pro version in at least four different ways. First, by using a higher threshold like 100 for ES one can identify potential Price Targets days and weeks ahead. This can allow the “swing trader” to anticipate future price direction and movement. Second, a smaller size threshold allows the scalper or day trader to establish Take Profit levels or price points that have a high chance of being hit. Third, TraderMap pro levels can be used to develop strategies during important economic announcements that move the market (i.e., the 8:30am ET economic news like CPI/jobs report etc. and FOMC and rate decision announcements). Fourth, the cancellation of those large orders and their subsequent addition at either a higher or lower price can give the trader an idea of what the large players think of the immediate PA.
The examples below showcase those four uses.
1. Swing Trading
Since Nov 11th until Nov 29th 2022, ES has traded in a range (see Figure 1), with 3900/3930 acting as important support, while 4000/4050 acting as strong resistance . On Nov 25th huge orders (i.e., 2500 ES contracts) showed to the upside at 4090. At the same time, on 11/28 large size orders (>100) started to show at 3860 followed by large liquidity (>300) at 3780 on 11/29. A swing trader can interpret those levels as potential targets if/when the PA breaks out of the range. Indeed, all these levels came into play later on. For instance, on the break to the upside on 11/30 PA shot up to 4109 slightly overshooting the TraderMap Pro level of about 4090. The lower level of 3780 came into play on 12/22 and provided strong support.
One caveat is that the simple observation of those liquidity levels does not really provide a clue of whether the breakout will be first to the downside or to the upside. One may be tempted to think that just because the large size orders first showed to the upside about four days before those large orders to the downside, the break out of the range will be to the upside. However, that is not the case.
In addition, the mere observation of large size orders at certain levels does not mean that PA will go to these levels straight away. One needs to be patient and note those levels on the chart as potential wick targets. Indeed, those levels can also be used as potential reversion points. For instance, the 4090/4100 level region could have been a short entry on Dec 1st and the 3780/3790 region a potential long entry on Dec 22nd, respectively.
Another caveat is that sometimes one may see important liquidity levels that are shown but then taken down. For instance, on 12/13 TraderMap Pro showed liquidity at 4225/4250 but PA never crossed 4200 (highest point was 4180). In the subsequent days when the PA reversed towards the 3800 region, this liquidity was taken down. However, as a rule of thumb the longer those large size orders stay in the book the more likely it is that PA will travel to those levels. Indeed, the swing trader could have anticipated a movement towards the 4200 region which happened on the 13th as early as the Dec1st through the 5th.
To summarize, the larger the threshold (say minimum 100 lots for ES) and the longer those large size orders stay in the book the higher the chance the PA will visit those levels.
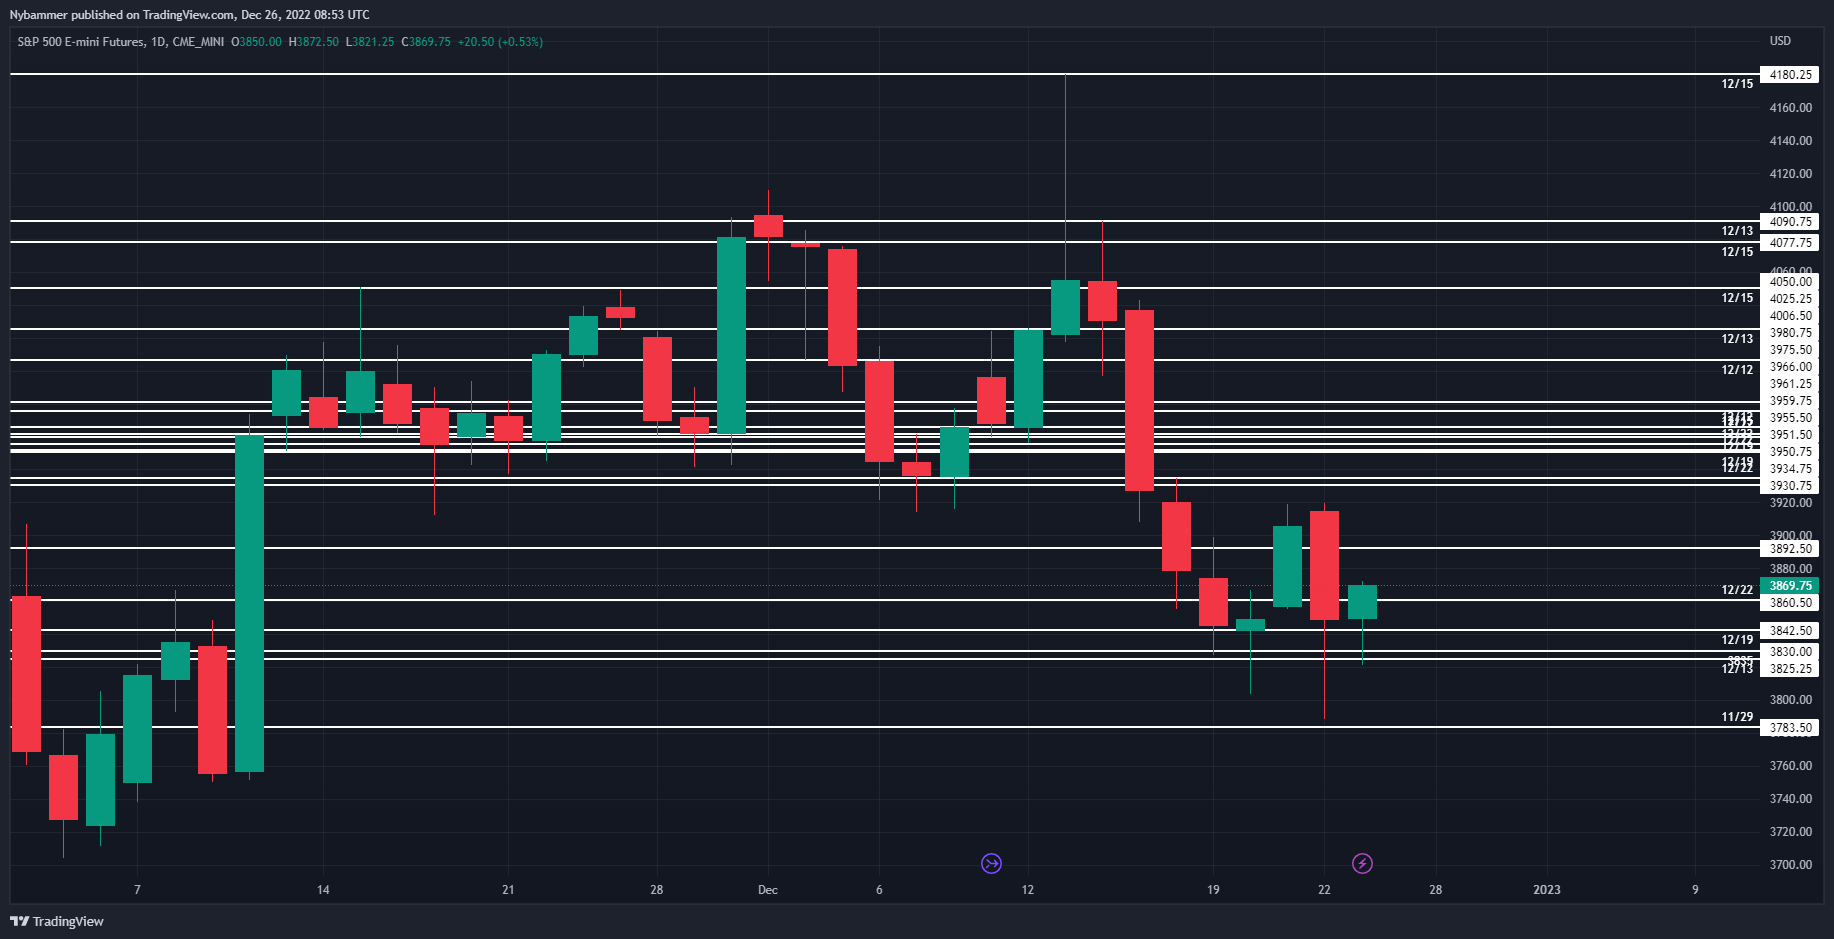
Figure 1: ES Price action from Nov 1st to Dec 23rd 2022. The white lines show the liquidity levels filtered based on large size orders in Tradermap Pro with the dates when they were first identified.
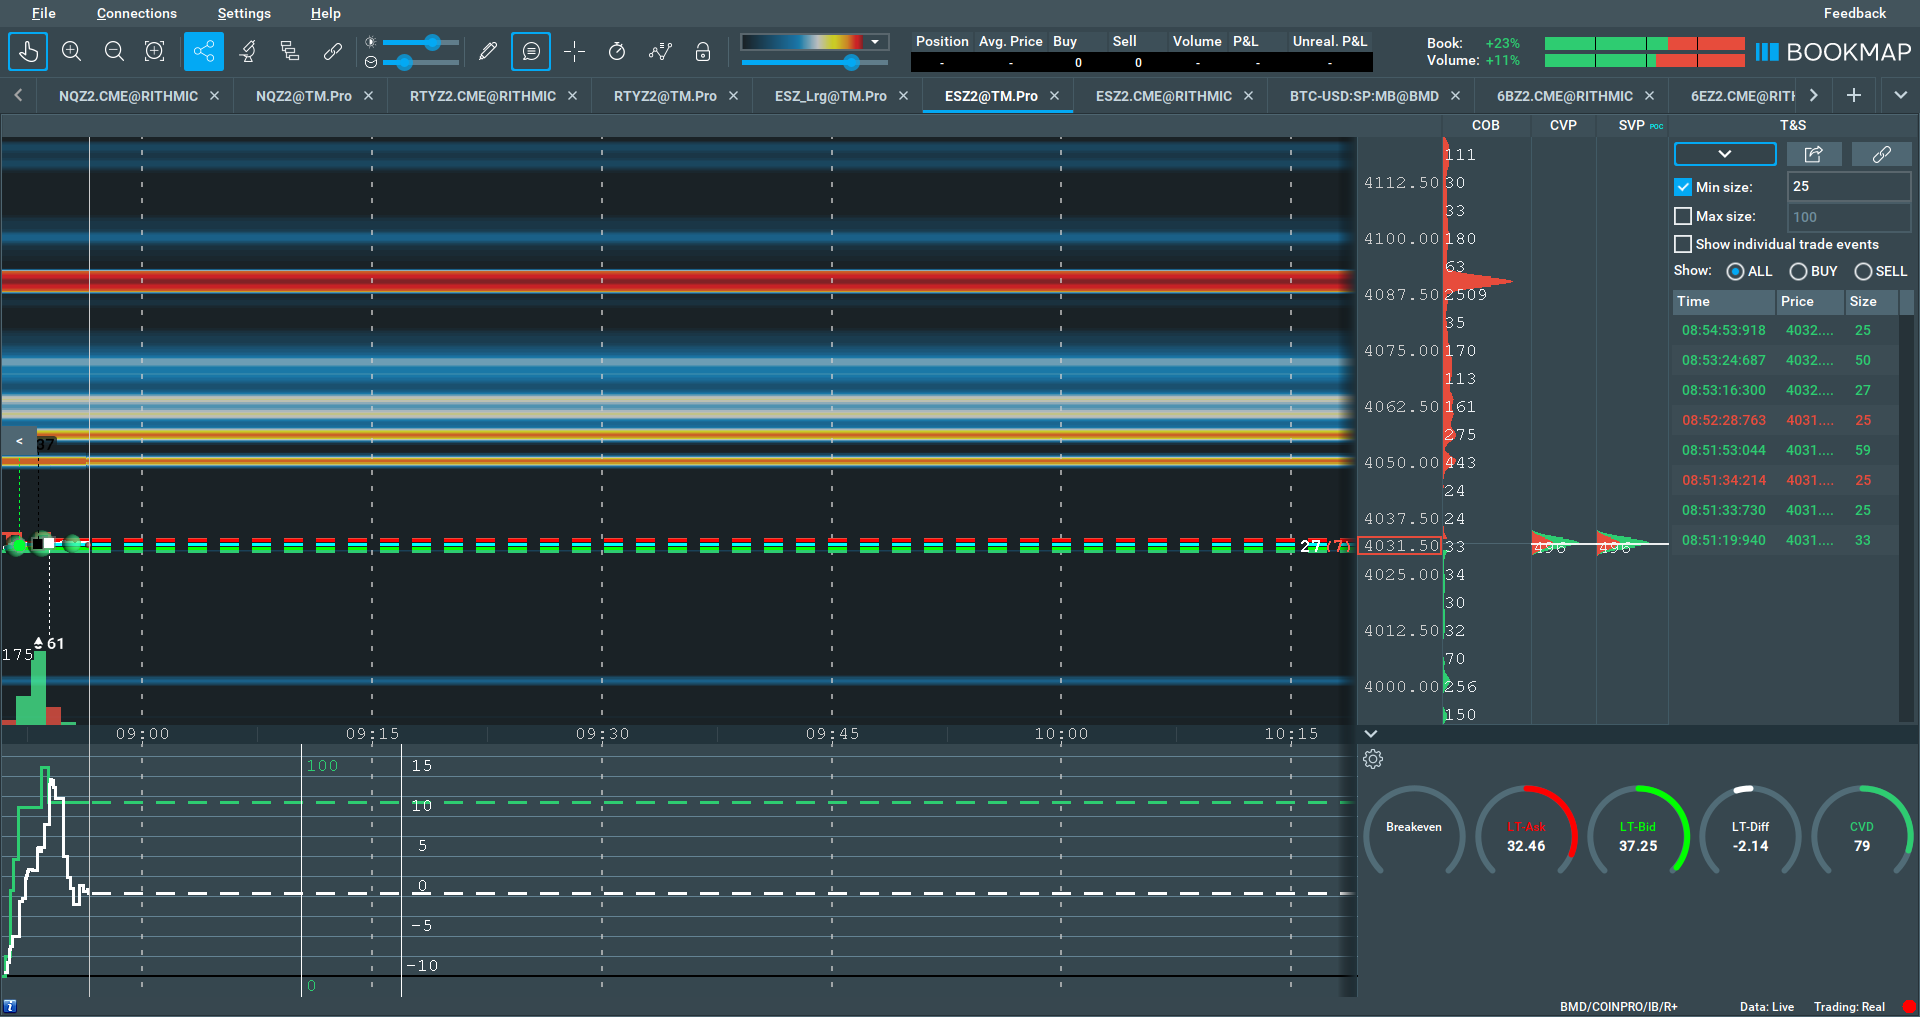
Figure 2:ESZ2 11/25/2022 (Threshold > 10 contract size orders)
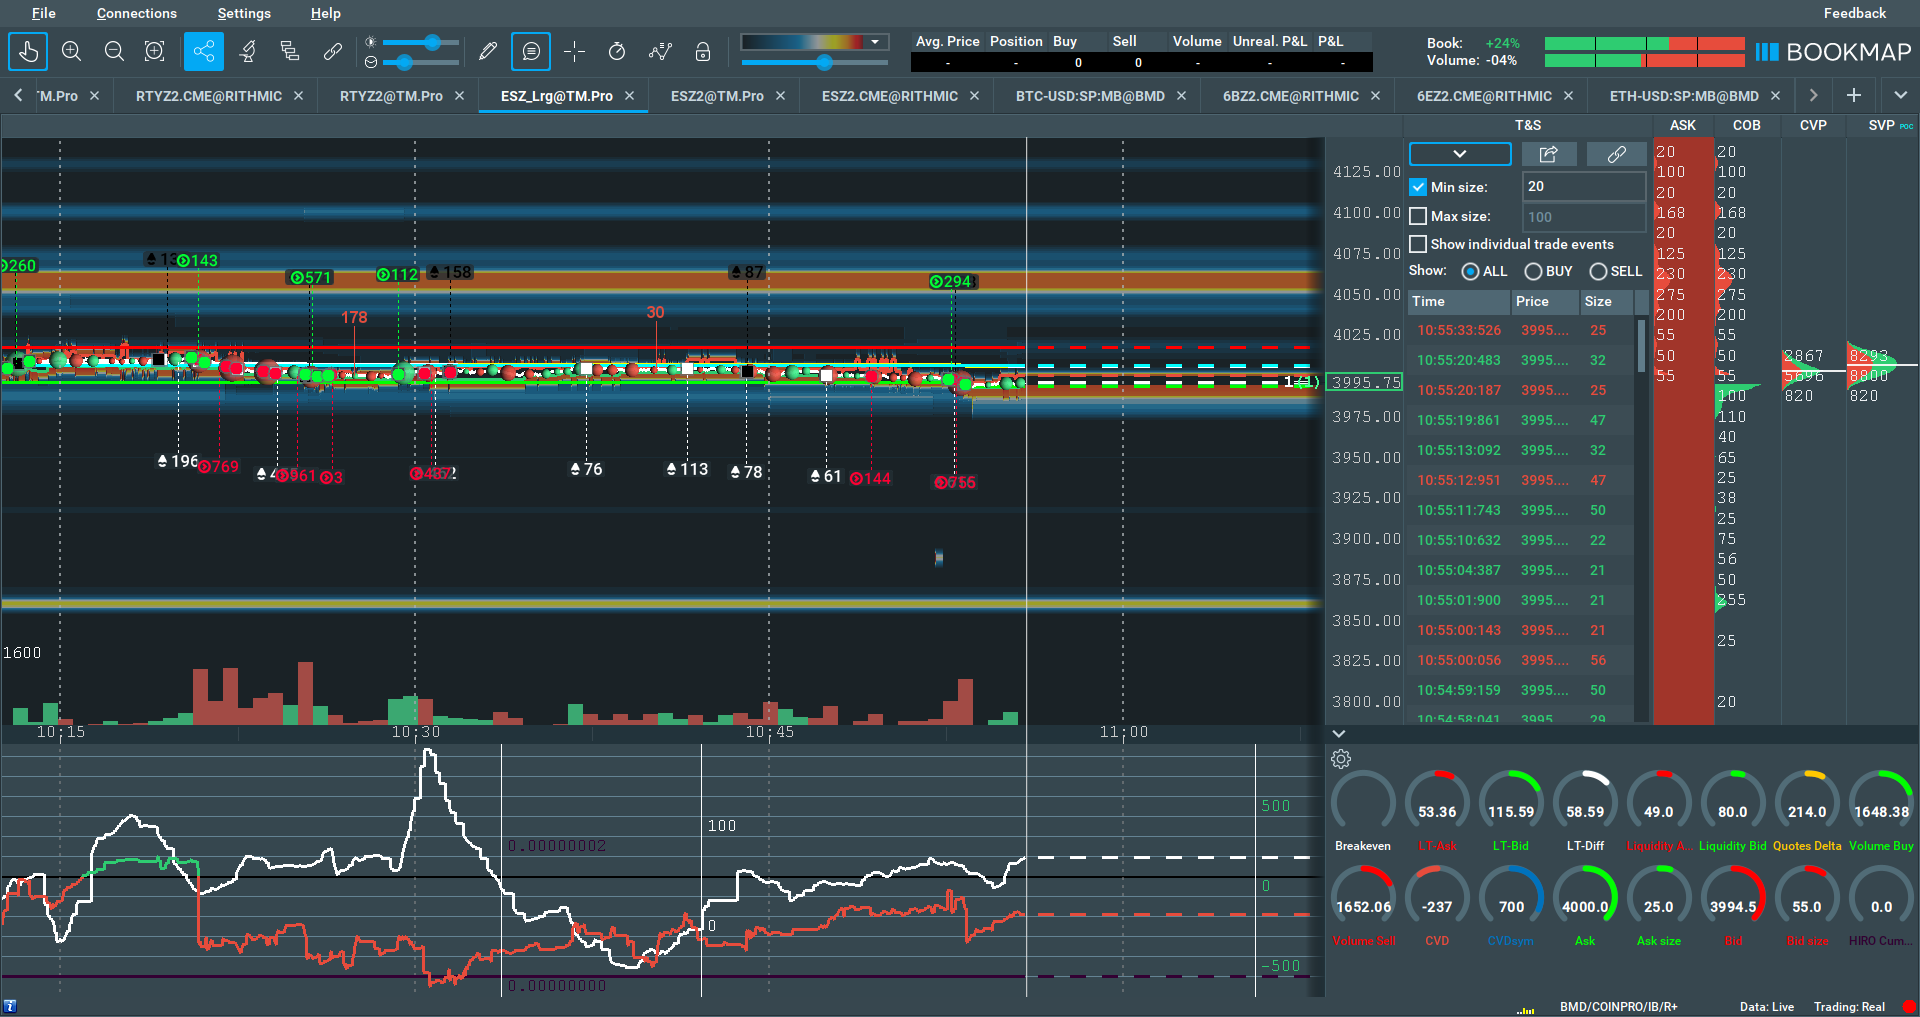
Figure 3: ESZ2 Large 11/28/2022 (Threshold > 20 contract size orders)
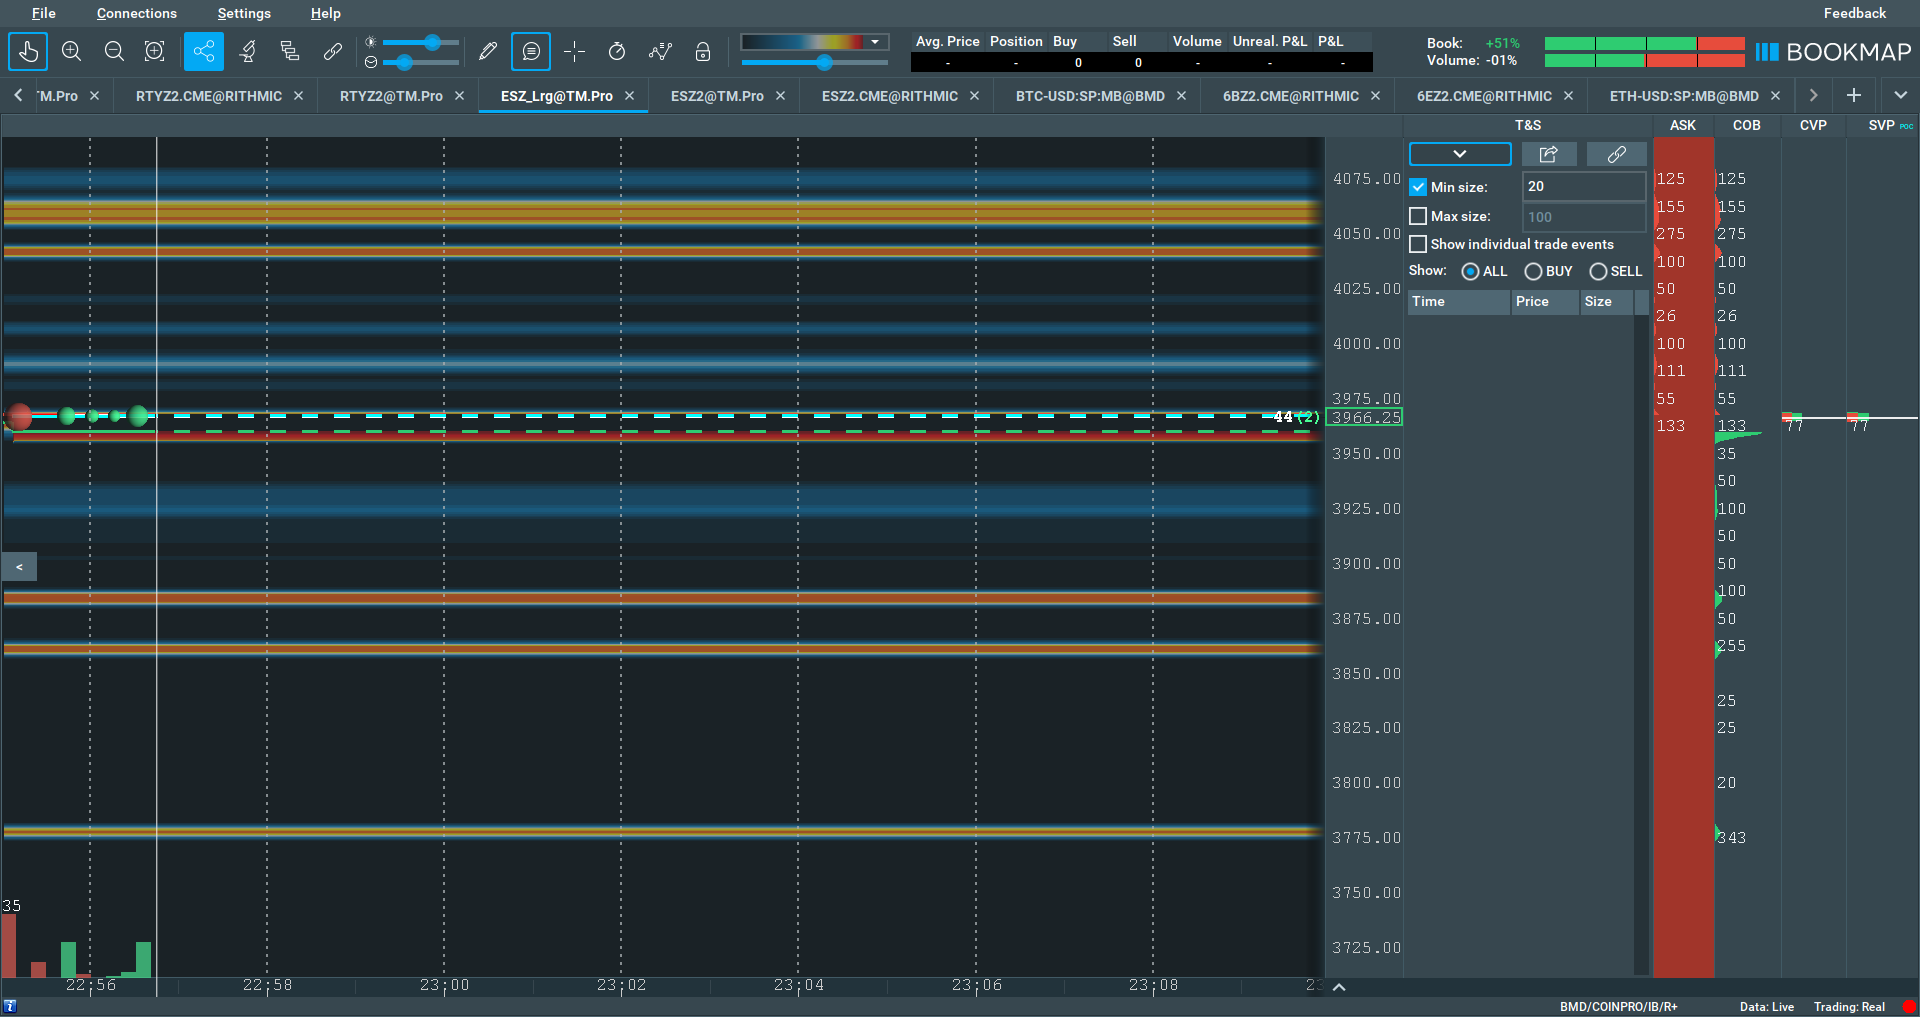
Figure 4: ESZ2 Large 11/29/2022 (Threshold > 20 contract size orders)
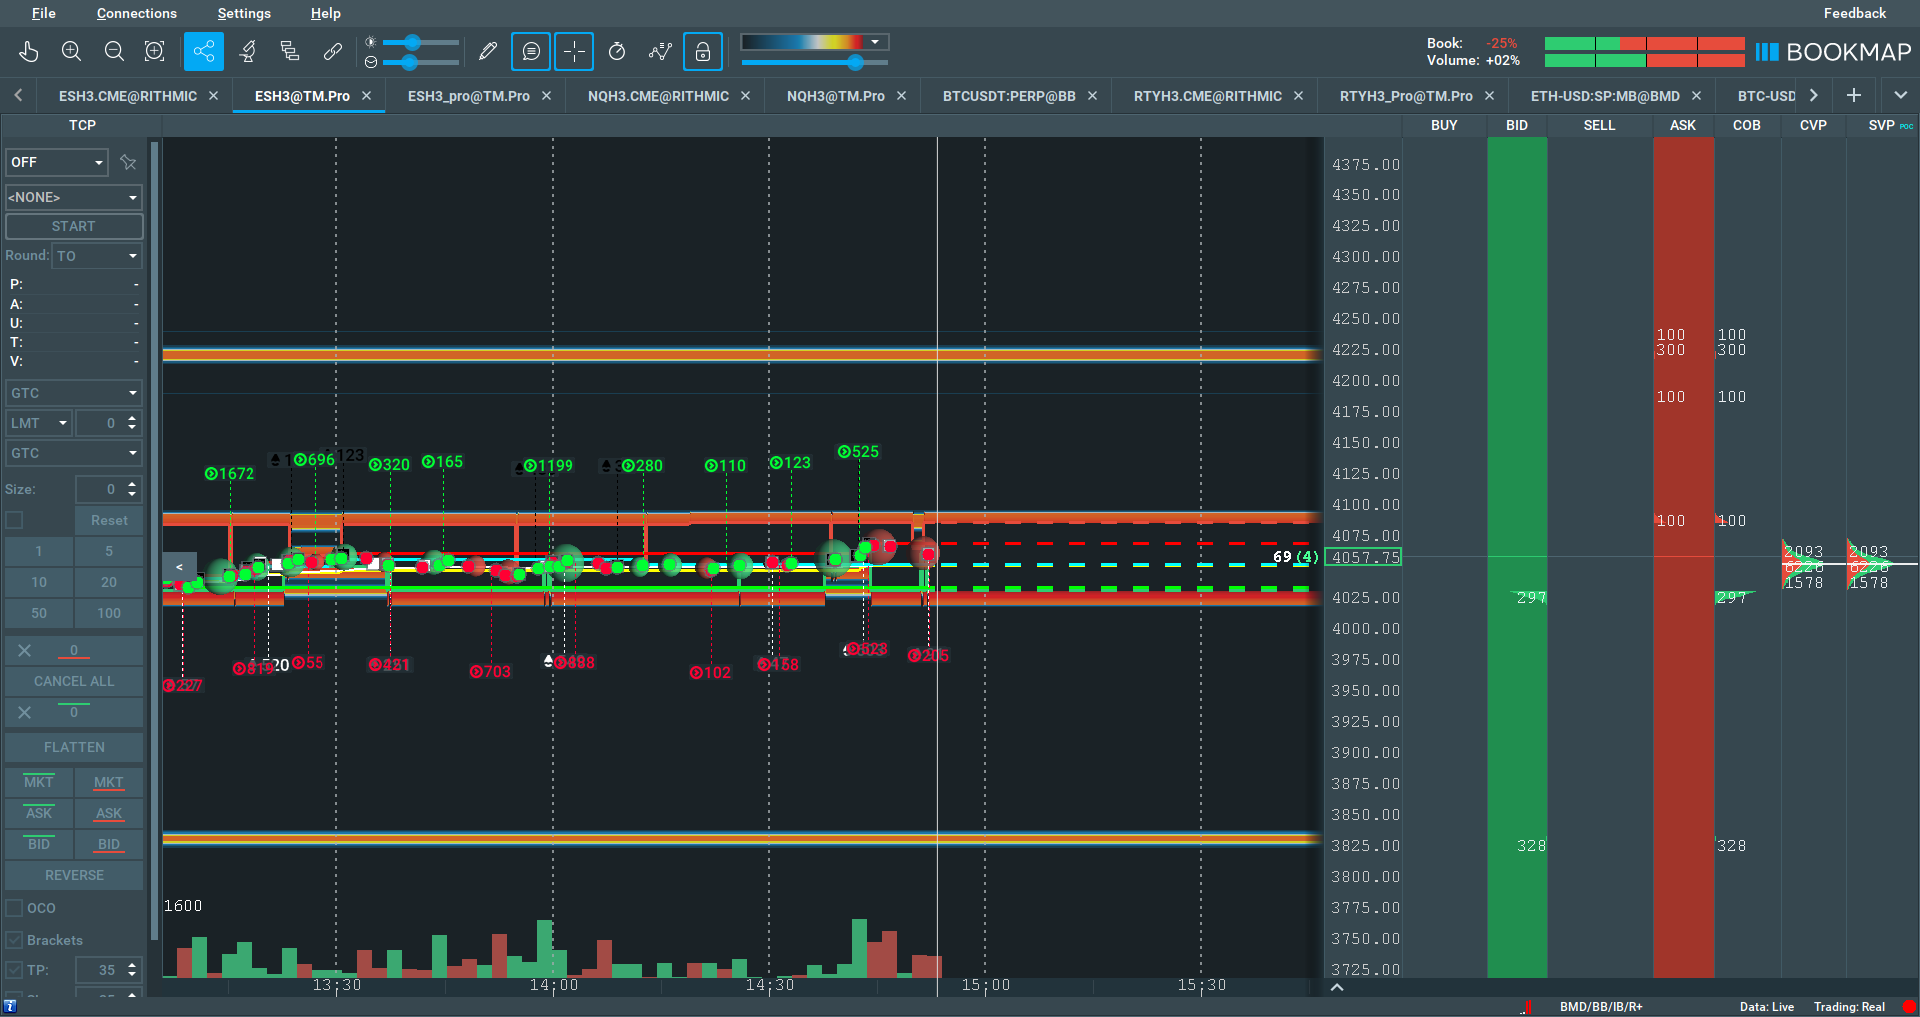
Figure 5: ESH3 12/13/2022 (Threshold > 100 contract size orders)
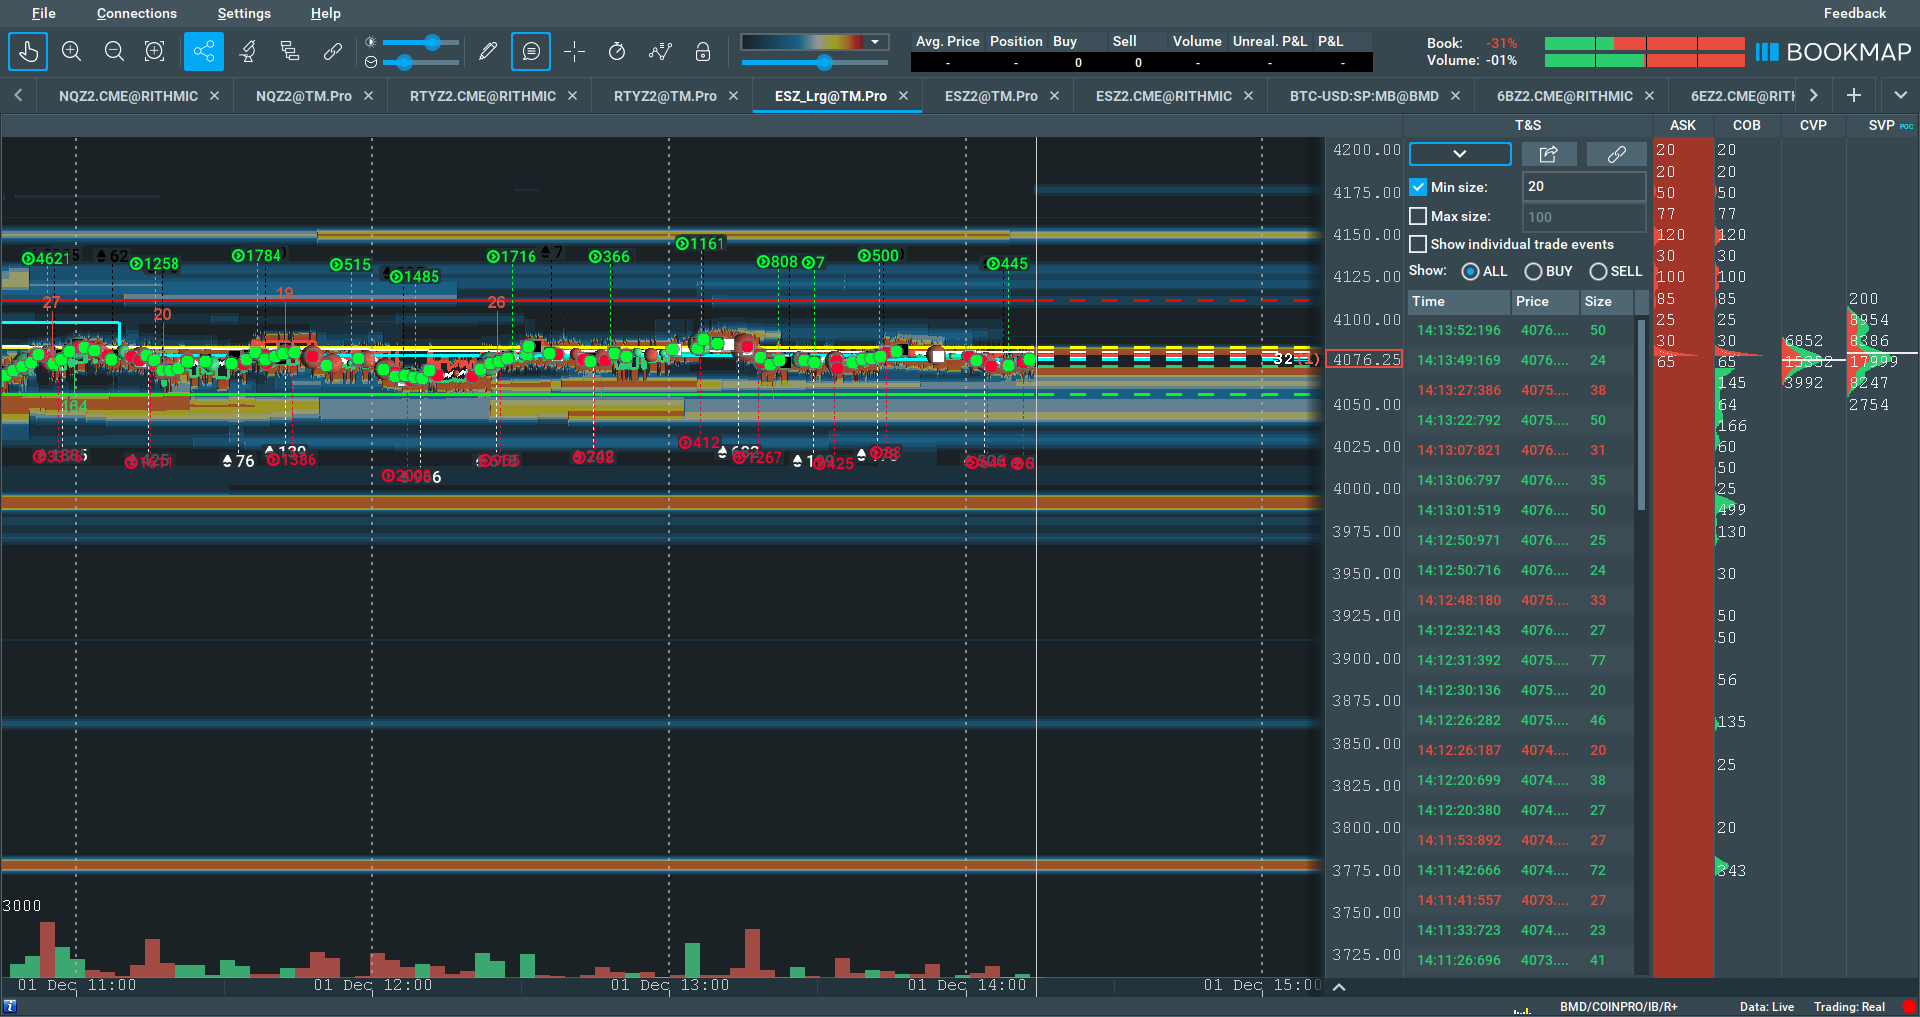
Figure 6: ESZ2 Large 12/1/2022 (Threshold > 20 contract size orders)
2. Scalping/Day Trading
Tradermap pro levels can be used throughout the day to show potential take profit levels irrespective of the position (long or short). For instance, Dec 1st turned out to be a doji and trend reversal candle. However, Figure 8 shows that a scalper in a long position should have been pretty confident that the liquidity at 12075/80 would have been tapped from a current level of 12050 before reversing for the day. Similarly, on 12/7 the liquidity (65 NQ contracts) at 11475 was tapped from the current level of 11491.
As a general rule, NQ shows fewer Tradermap Pro levels than ES. Therefore, whatever levels are visible for NQ become all that more important.
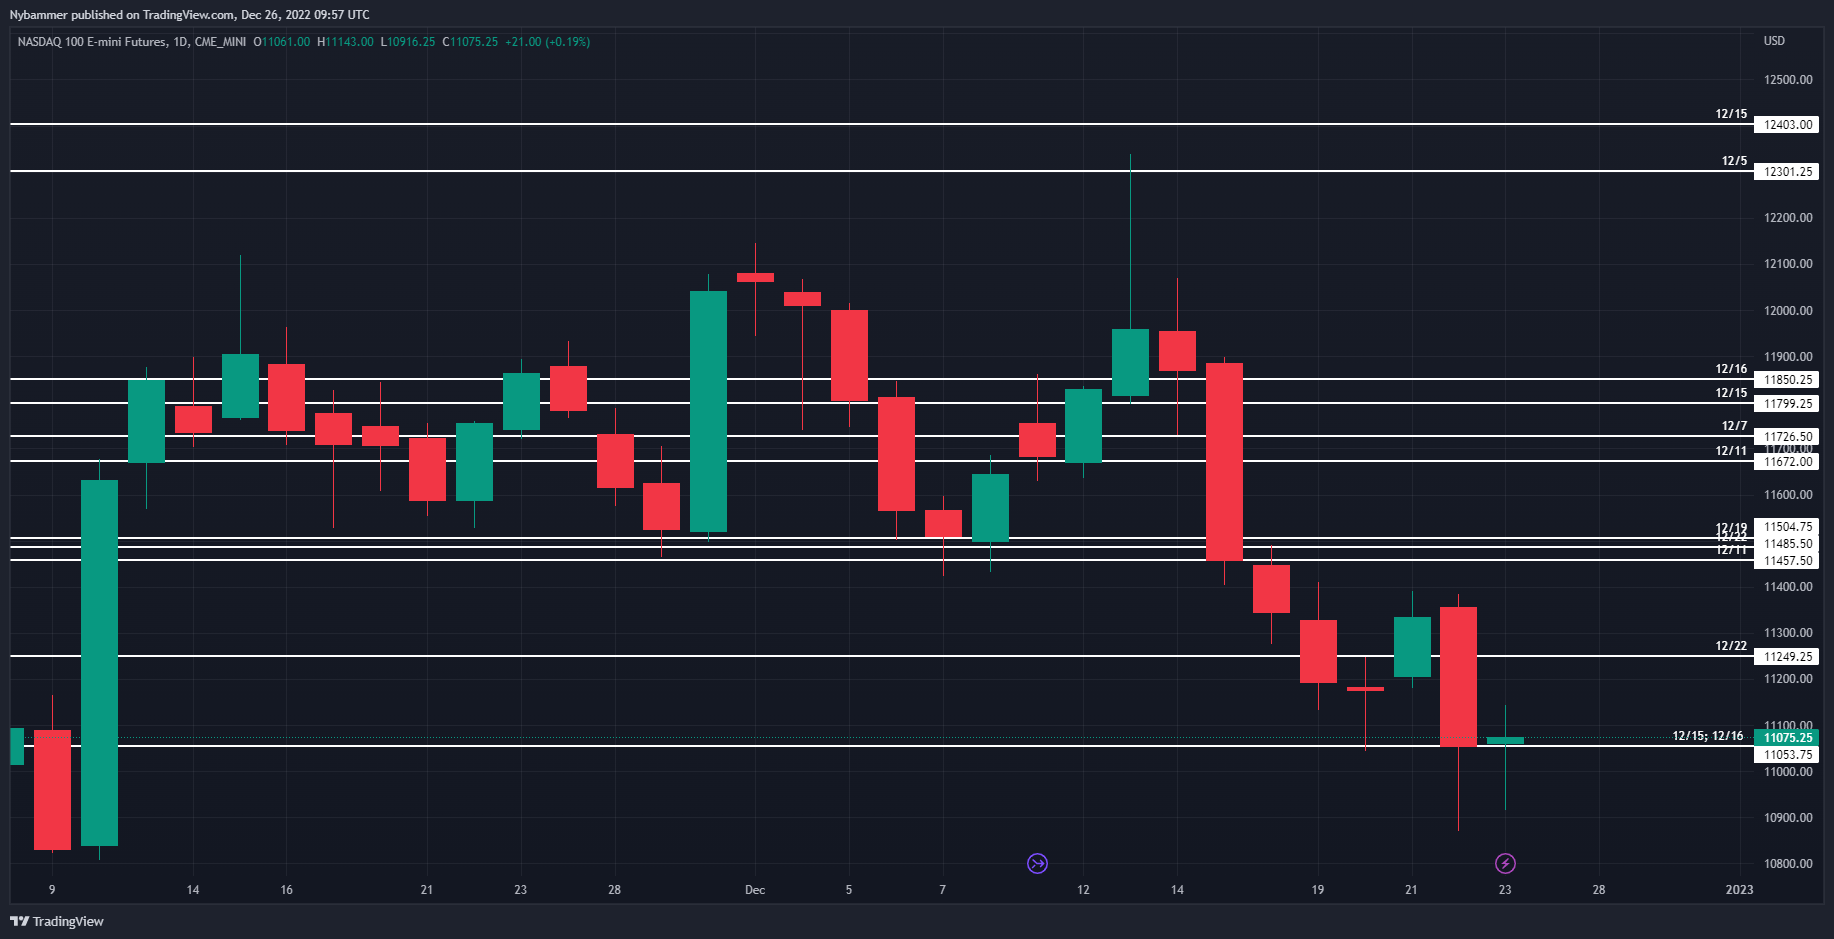
Figure 7: NQ Price action from Nov 9th to Dec 23rd 2022. The white lines show the liquidity levels filtered based on large size orders in Tradermap Pro with the dates when they were first identified.
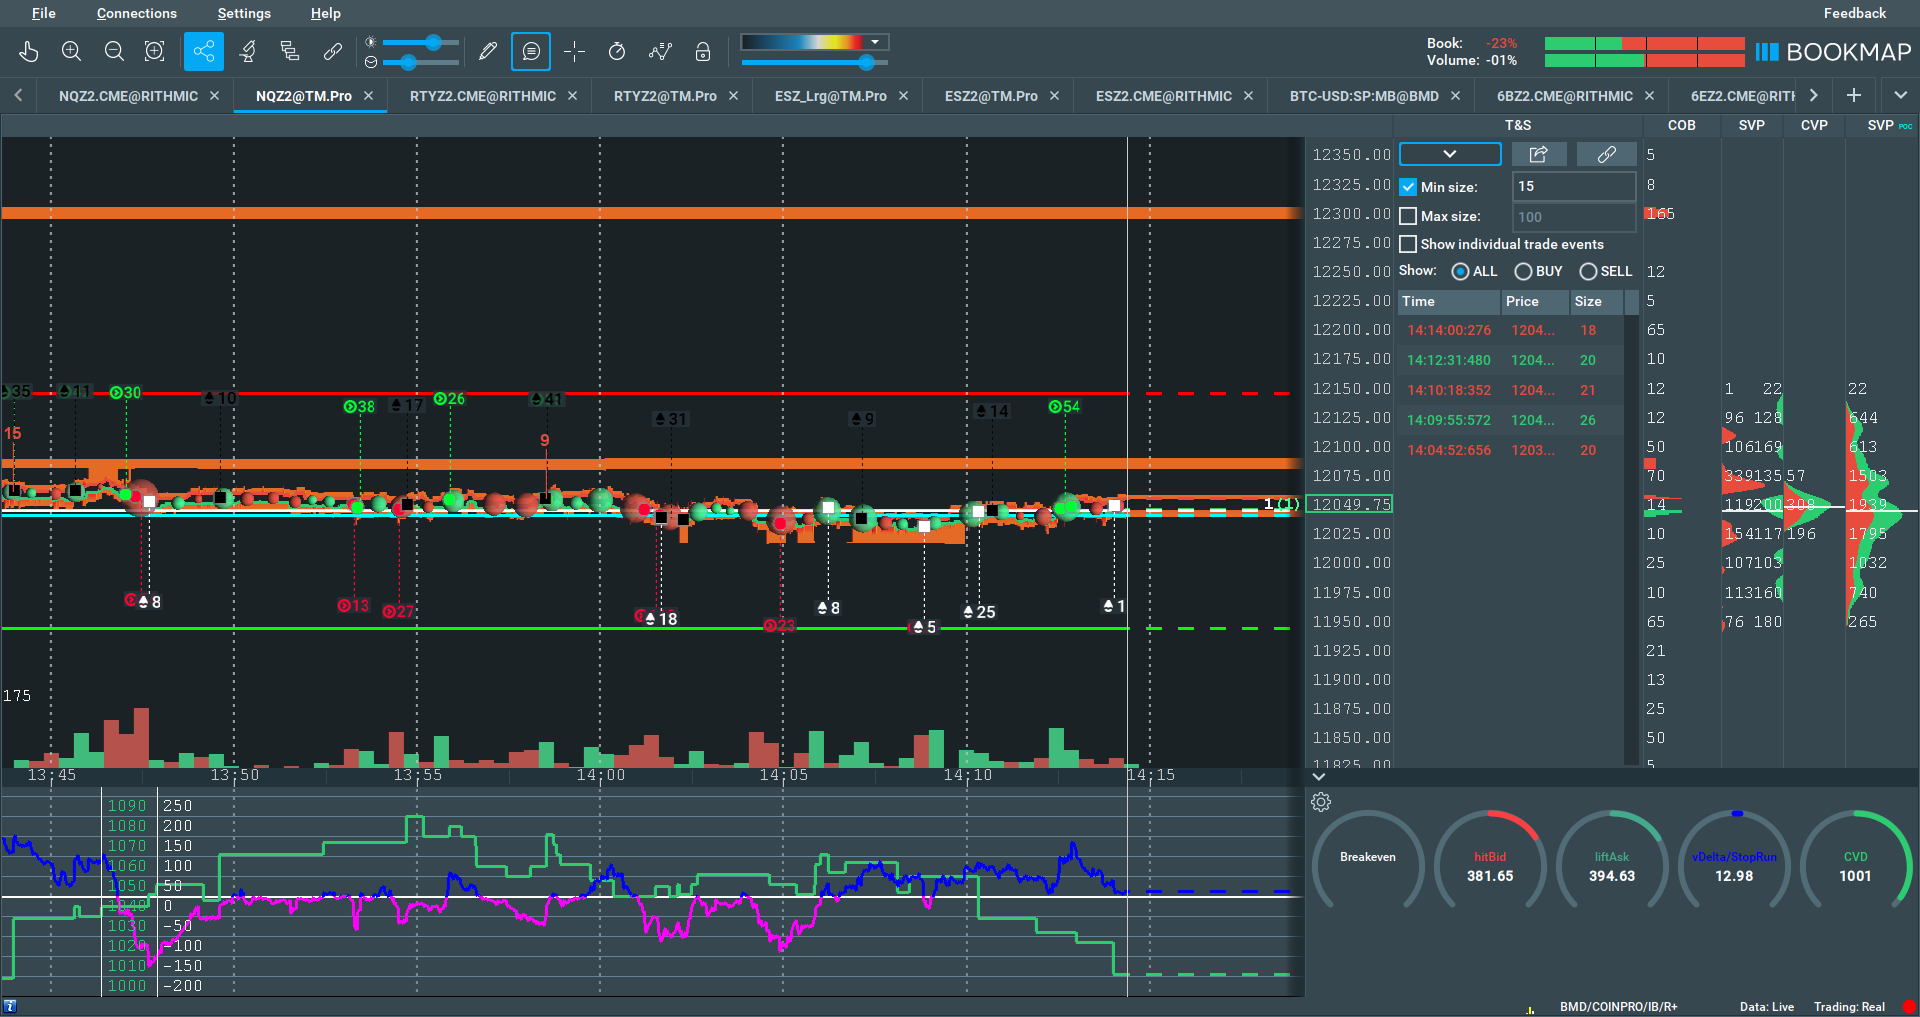
Figure 8: 12/1/2022. This day ended up being a doji and trend reversal candle. However the PA tapped the immediate liquidity above the current price at 2:15pm before reversal for the day.
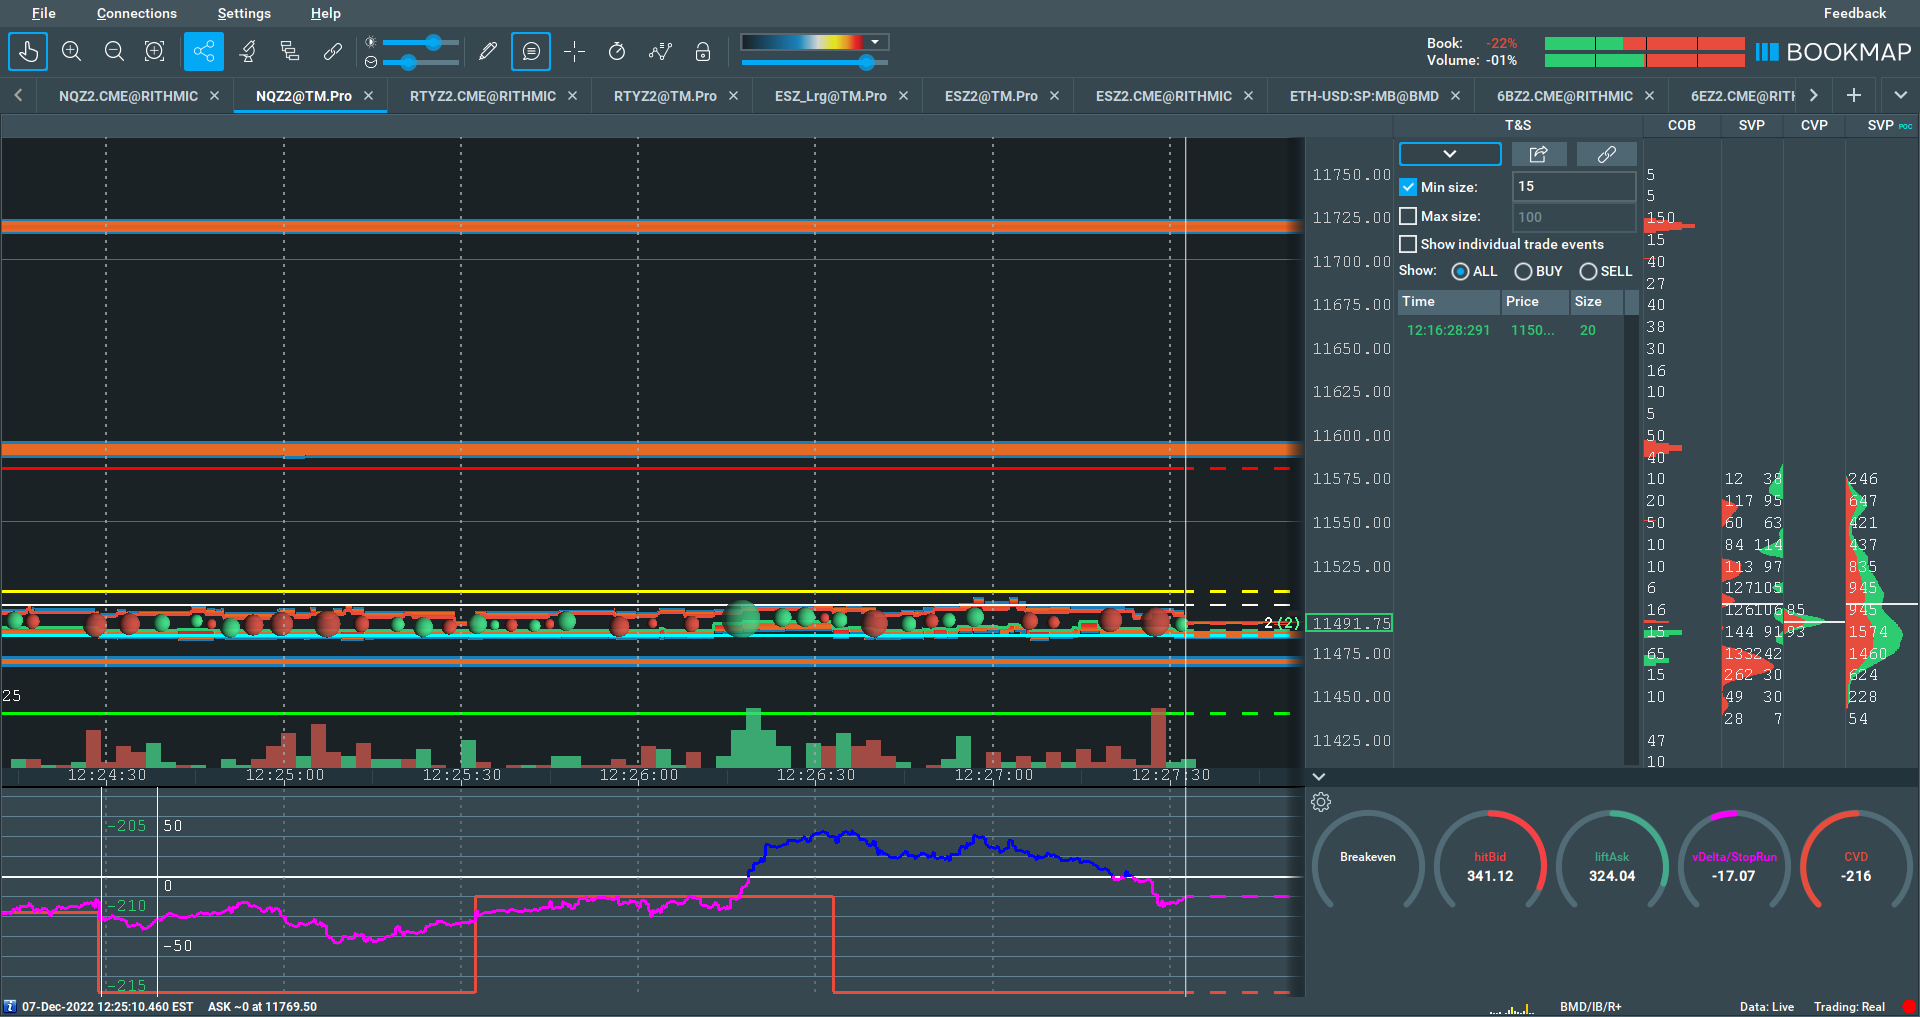
Figure 9: 12/7/2022. The 65 contracts at 11475 will most likely be tapped from the current level of 11491. Generally, NQ shows fewer levels than ES. Therefore, those levels that are visible become even more important price targets.
Trading FOMC/Economic news (CPI, jobs data etc. announcements)
Tradermap pro levels can be a phenomenal tool to trade those sharp 8:30am ET price movements caused by economic news announcements (CPI/PPI prints or jobs data among others). The rule is pretty simple: set long entries at the important TraderMap pro levels to the downside and short entries to those at the upside.
For instance, Core PPI and PPI were to be announced at 8:30am on Dec 9th 2022. Tradermap Pro showed important levels at 3930/3901 to the downside and 4025/4050 to the upside, respectively. Accordingly, buy limit orders were set at 3930.5/3901.5 and sell orders at 4049.5 and 4024.5 for the December contract. Note that those entries are front run to make sure they get filled. Usually, in the split seconds following the announcements the first fast move is the fake move. The subsequent move is the actual move. Indeed, the fast move was a drop to 3930.5 where the buy limit order was filled to the tick and the subsequent move was to the upside.
Another example is from Dec 13 on NQ whereby the core CPI/CPI were to be announced at 8:30am. Generally, it is anyone’s guess how the market is going to react to those news. However, for about at least a week prior, the 12,300 level in NQ showed significant liquidity (165 contracts) that never moved from the books (see Figure 8 for details). For the month prior (mid-November to mid-December) NQ ranged between 12,100 and 11,500. Therefore, it made sense to have a sell order at 12,300. Note that because there was no level with similar liquidity to the downside, no limit buy orders were entered. As the huge wick for the day shows, 12,300 provided a great short entry. Indeed, it did overshoot to 12,330 but with proper risk management this was a great short.
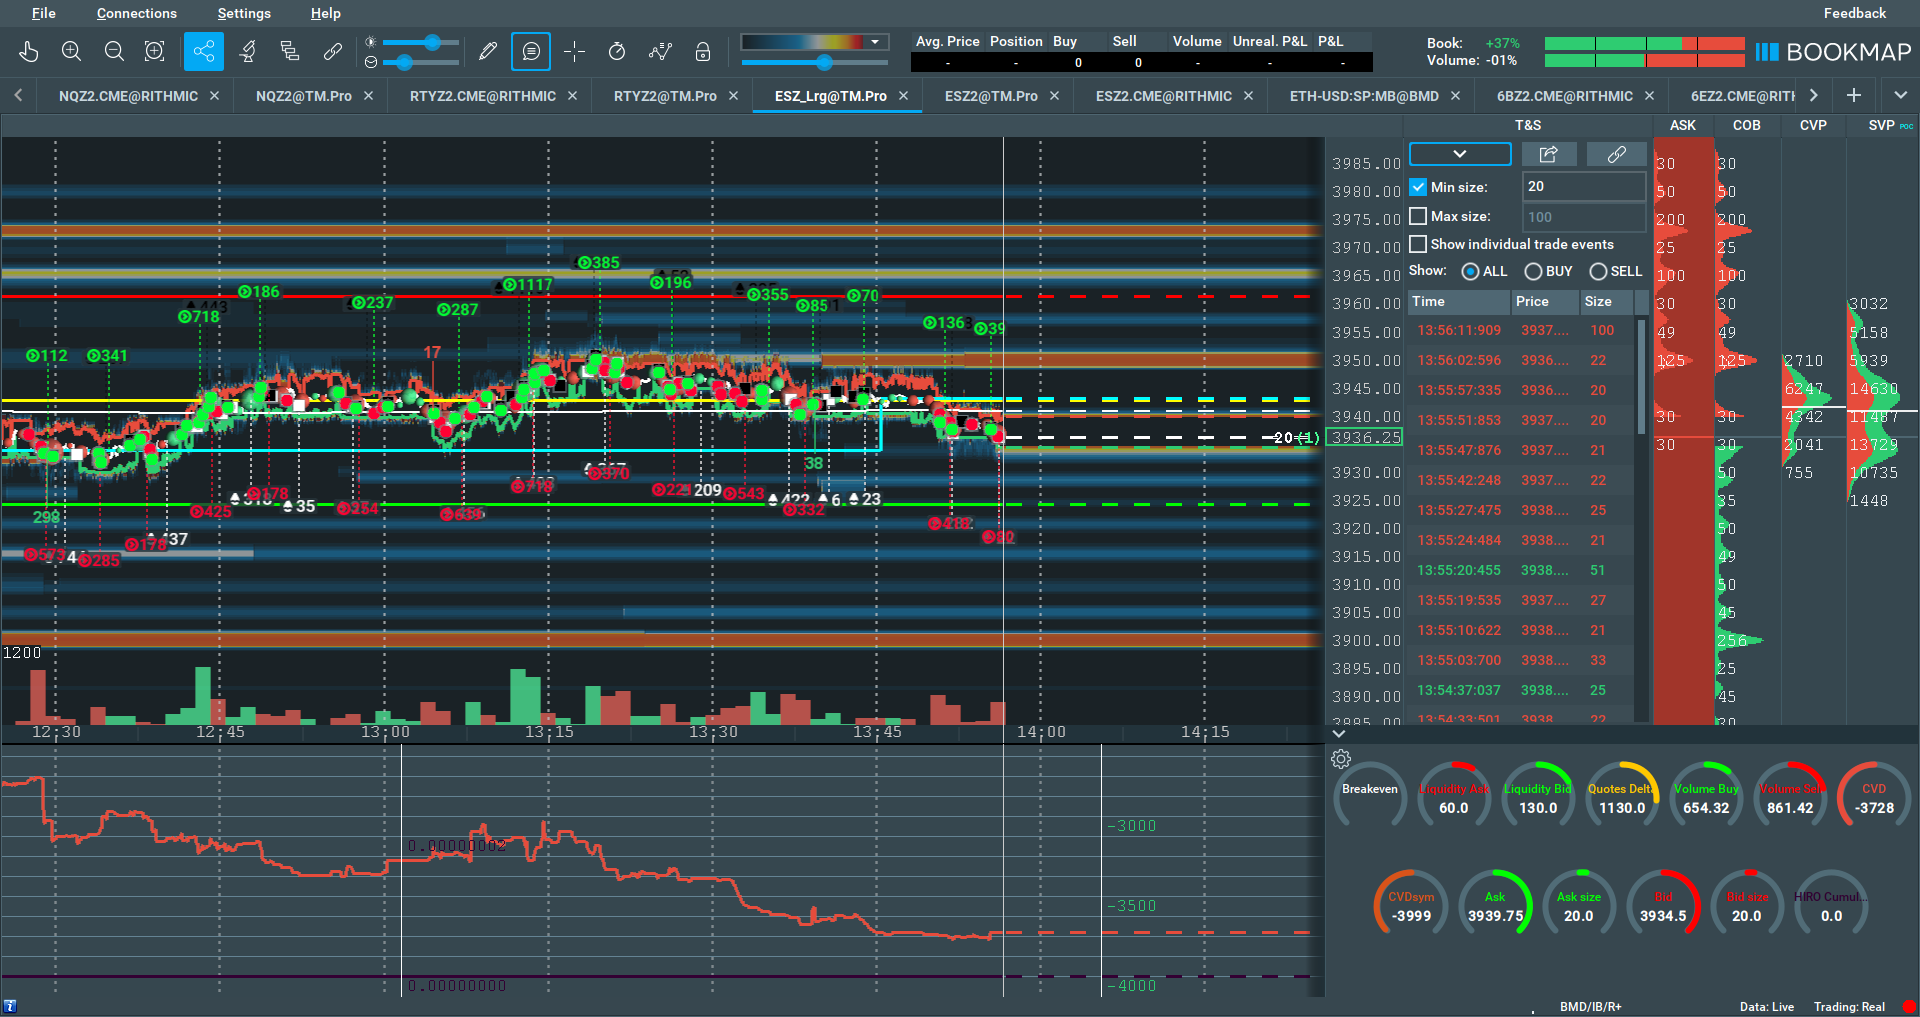
Figure 10:ESZ2 Large 12/7/2022 (Threshold > 20 contract size orders)
4. Large order size changes
Finally, a shift in the large size orders can show a change in the big players’ positioning and a potential market shift. As Figure 11 shows, as the market shifted lower on 11/28 large size orders were also shifted from 4087 to 4062 and major liquidity was pulled from 4025. This is bearish and can signal more downside. Indeed, both 11/28 and 11/29 were subsequently red days with the PA decreasing to as low as 3940.
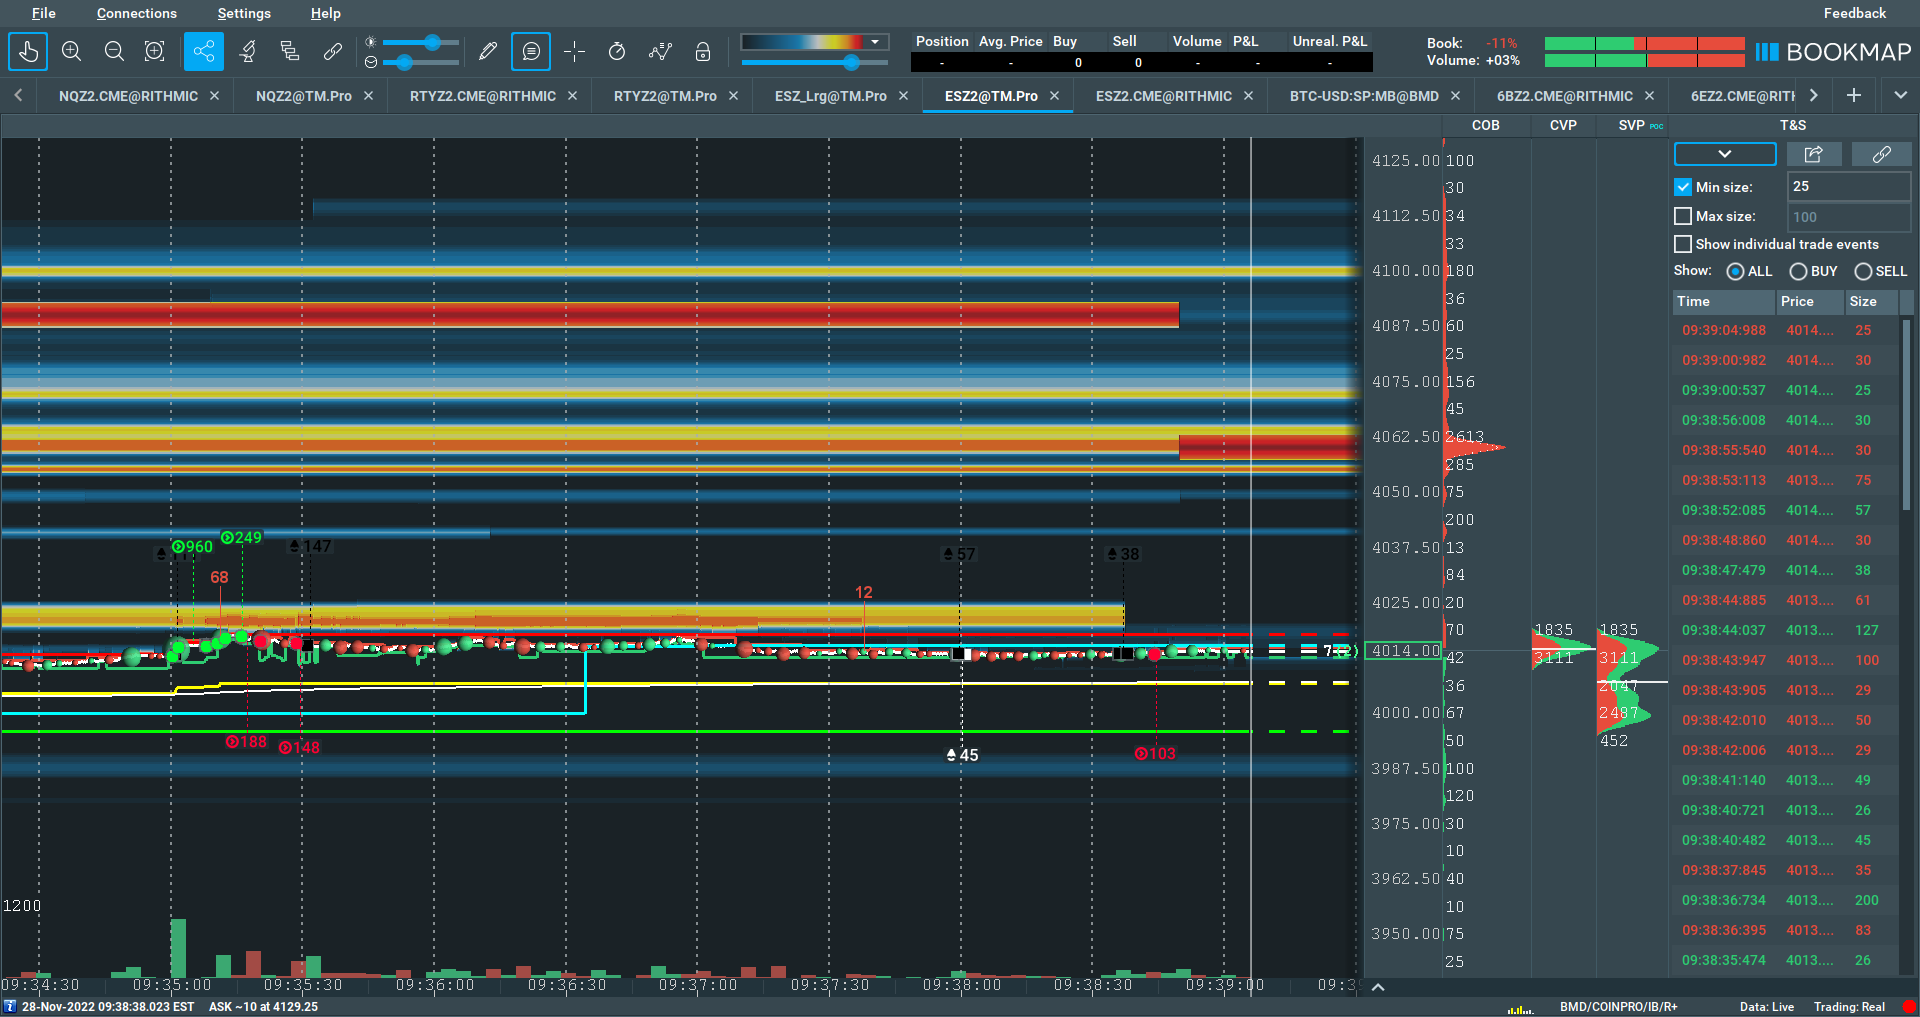
Figure 11: ESZ2 11/28/2022 (Threshold > 10 contract size orders)
Sign Up Now