See adaptive algorithms more clearly in real time.
Compare plans to access deeper market visibility for adaptive algorithms.
Education
December 11, 2024
SHARE
Adaptive Algorithms in Modern Trading: The Power of Advanced Visualization

In trading, emotions such as fear and greed often come into play, leading to
suboptimal trading decisions. However, what if I told you that there is a
quiet revolution underway, brought about by a tool called Bookmap?
In this era of electronic trading, a new breed of traders is emerging, ones
who do not experience fear or greed, nor do they require rest. These traders
are adaptive algorithms—sophisticated software that learns, evolves, and
autonomously executes trades.
But how do these algorithms really work and are they successful?
This article will provide you with a comprehensive understanding of adaptive
algorithms and their utilization, especially in conjunction with advanced
visualization tools like Bookmap. Let’s delve deeper.
The Evolution and Influence of Adaptive Algorithms in Trading
Adaptive algorithms represent a pivotal advancement in trading technology.
They empower traders to adjust to ever-changing market conditions. In this
article, we will begin by defining adaptive algorithms and then gradually
explore their various types, the reasons behind their surging popularity,
and the common advantages associated with their usage.
What are Adaptive Algorithms?
Adaptive algorithms are automated trading systems that can:
-
Dynamically adjust their parameters in response to real-time market
data. This adaptability enables them to optimize their trading
strategies as market conditions fluctuate. -
Automatically switch between different tactics, such as
trend-following or mean-reversion strategies, as market dynamics
evolve. This flexibility allows them to capitalize on various market
scenarios.
Most automated algorithms rely on a range of real-time data to make informed
trading decisions. This data typically includes:
-
Price movements
-
Order book depth, and
-
Volatility
They are different from traditional static algorithms, which rely on fixed
parameters or strategies. Let’s understand this difference:
|
Adaptive Algorithms |
Traditional Static Algorithms |
|
They are more flexible and can adjust their parameters,
For example, if market volatility increases, an adaptive |
Traditional static algorithms often employ fixed
These algorithms lack the ability to adapt to changing |
Why Adaptive Algorithms are Gaining Popularity
Adaptive algorithms allow traders to adapt to sudden market shifts. Here’s
why they are gaining popularity:
-
They are better equipped to navigate complex and volatile financial
markets. -
They give traders an edge by optimizing their strategies and
allowing for risk management in real time. -
They facilitate compliance with evolving trading regulations by
adjusting trading parameters.
What Are the Different Types of Trading Algorithms?
Given their popularity, there is a wide variety of trading algorithms in the
market nowadays. Let’s understand two notable examples today:
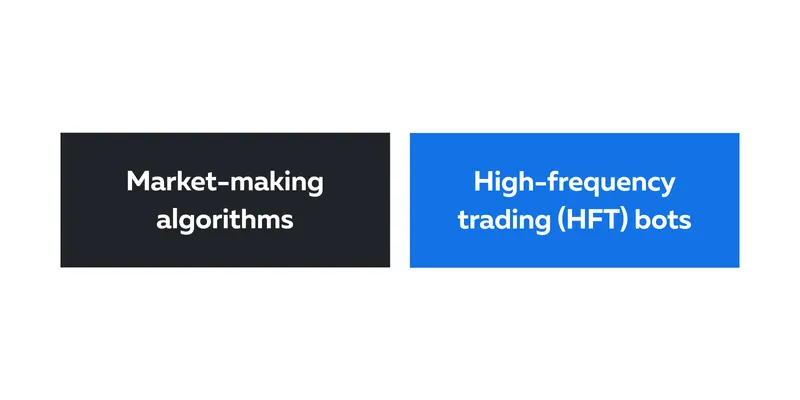
-
High-Frequency Trading (HFT) Bots:
-
Objective: HFT bots are designed for lightning-fast trading and
aim to profit from minuscule price differentials within
milliseconds. -
They rely on:
-
Advanced technology
-
Low-latency connections, and
-
Sophisticated trading strategies
-
-
-
Market-Making Algorithms:
-
Objective: Market-making algorithms engage in the simultaneous
buying and selling of assets to profit from the bid-ask spread. -
These can be of two types:
-
Naive Market-Making Algorithms: These are risk-averse
algorithms looking for simple imbalances between buy and
sell orders. -
Advanced Market-Making Algorithms: These are complex
algorithms and use the following factors to trade:-
Order book dynamics
-
Historical data, and
-
Predictive models
-
-
-
From Simplicity to Sophistication
In its infancy, algorithmic trading was relatively simple and performed
routine trading tasks. It executes predefined strategies primarily focused
on basic orders like stop-loss and trailing stop orders.
Algorithmic trading has come a long way from its early days and has started
using:
-
Technical indicators like:
-
Moving averages
-
RSI (Relative Strength Index), and
-
MACD (Moving Average Convergence Divergence)
-
-
Advanced statistical methods to adapt to changing market conditions
and learn from vast datasets. -
Deep learning techniques for advanced pattern recognition and
analyzing unstructured data, such as news sentiment. -
Complex models and real-time market data to profit from bid-ask
spreads.
Which Factors Drove this Evolution?
The evolution in algorithmic trading has been driven by the pursuit of
greater efficiency in executing trades and managing risk. Let’s see some
common factors for evolution:
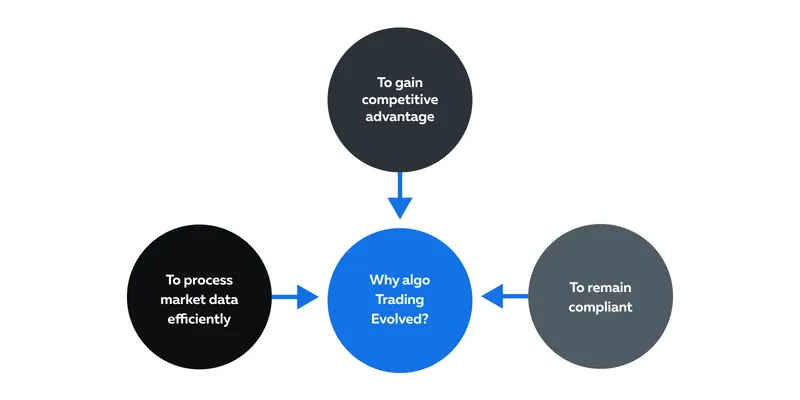
-
The explosion of data, including market data, social media
sentiment, and news, required more sophisticated algorithms to
process and extract meaningful insights. -
Traders sought to gain a competitive edge by developing more
advanced algorithms that could:-
Adapt to changing market conditions and
-
Identify opportunities faster than human traders.
-
-
Evolving regulations, such as MiFID II and Reg NMS, necessitated the
development of algorithms that could comply with market rules and
report trades accurately.
Perks of Going Adaptive
Adaptive trading algorithms can learn, adjust, and adapt to real-time
offers. Let’s understand some perks of going adaptive:
-
They continuously analyze incoming data to gain insights into
current market conditions. -
Adaptive algorithms learn from the most recent market developments
to make more informed and timely trading decisions. -
Unlike static algorithms, adaptive algorithms can modify their
strategies when market dynamics change. -
They can self-adjust which enables them to reduce exposure to risk
during turbulent market phases.
Predictive Capabilities of Adaptive Algorithms
-
These algorithms can identify patterns and trends in historical data
and real-time market data, allowing them to predict potential future
price movements. -
By recognizing emerging trends and patterns, adaptive algorithms can
take proactive positions.
The Critical Role of Visualization in Tracking Adaptive Algorithms
More traders are now using data visualization to address the several
challenges created by the invisible nature of adaptive algorithms. By
providing a visual representation of algorithmic behavior, traders and
institutions can better monitor, control, and gain insights into the
operations of adaptive algorithms. Keep reading to understand this further.
Decoding the Invisible: The Challenge of Understanding Adaptive Algorithms
Adaptive algorithms operate discreetly behind the scenes, often remaining
invisible to human traders. This invisibility presents several significant
challenges:
-
Practicing Opaque Logic:
-
Many adaptive algorithms rely on complex components like machine
learning models, neural networks, and proprietary trading
strategies. -
The decision-making processes of these algorithms are often
concealed within these intricate structures. -
As a result, it becomes arduous for human traders to comprehend
the reasoning behind a trade executed by an algorithm.
-
-
Gauging Market Impact:
-
These also adapt to real-time market conditions, making their
actions difficult to predict. -
This makes it difficult to predict how their actions will
influence the market.
-
-
Flash Crashes:
-
Rogue adaptive algorithms have been implicated in sudden and
severe market disruptions, such as flash crashes. -
These anomalies occur when an algo malfunctions or interprets
market conditions incorrectly, leading to a cascade of automated
trading actions.
-
-
Algorithmic Herding:
-
Algorithms, when misprogrammed or overly responsive to market
signals, can contribute to herding behavior. -
Overreactions by algorithms amplify price movements and can
create market instability, potentially leading to unintended
consequences.
-
How Visualization Can Help
As algorithms continue to play a larger role in financial markets, it is
crucial for traders, financial institutions, and regulators to collaborate
towards greater transparency and risk management. To address these
challenges, industry stakeholders are increasingly relying on data
visualization tools that:
-
Display real-time information about an algorithm’s actions,
including:-
Order flow
-
Execution prices
-
Trading volume
-
-
Can also be used to set up alerts and anomaly detection systems.
-
Can trigger warnings when algo behavior deviates significantly from
expected patterns.
Beyond the Ordinary Charts
Traditional charting tools, such as candlesticks or bar charts, have
limitations when it comes to providing insights into the behaviors of
adaptive algorithms. Some common limitations are:
-
Adaptive algorithms operate in high-frequency environments where
events occur rapidly. Traditional charts may not capture all the
micro-events and details. -
Traditional charts like candlesticks or bar charts provide a
simplified, one-dimensional view of market data. They summarize
price and volume data but lack details on market depth and
concentration.
To address these shortcomings, next-gen visualization tools, like Bookmap,
have emerged. Let’s have a look at the modern features:
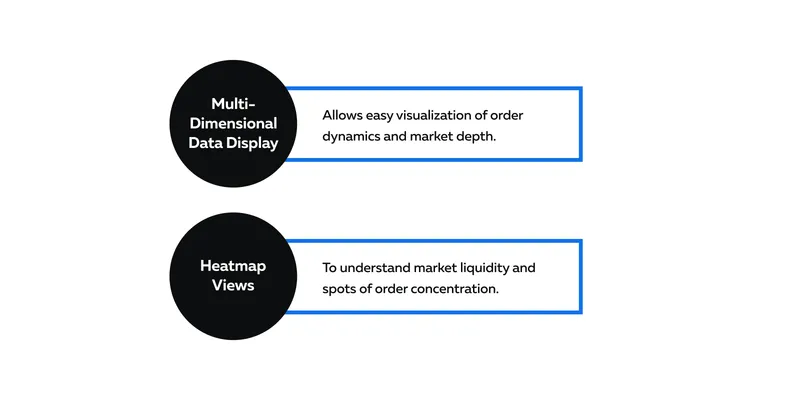
-
Multi-Dimensional Data Display:
-
Next-gen tools are designed to visualize multi-dimensional data.
-
They not only represent price and volume but also:
-
Market depth
-
Order book dynamics, and
-
Concentration of orders at various price levels.
-
-
-
Heatmap Views:
-
Advanced tools like Bookmap use heatmap visualization to display
market concentrations. -
A heatmap provides a graphical representation of market
liquidity and order placement at specific price levels.
-
Let’s understand this better with an example.
-
The Event:
-
You’re monitoring the stock of Company XYZ, which has been
trading steadily around $100 per share. -
However, in a matter of seconds, the stock price suddenly drops
to $90. -
All the traders are puzzled as to what triggered this rapid
decline.
-
-
Using Standard Charts:
-
When examining traditional candlestick or line charts, you
observe a steep drop in the stock price from $100 to $90. -
While this shows you the price movement, it offers limited
information about why this happened.
-
-
Using Heatmap View:
-
Now, you switched to a heatmap view like the one offered by
Bookmap. -
In this visualization, price levels are represented by
color-coded cells, and each cell’s color corresponds to the
order density at that level.
-
-
Your Observation:
-
As you look at the heatmap during the market dip, you notice
that around the $90 price level, there is a significant
concentration of red cells. -
The intensity of red indicates a high number of sell orders in
that price range. -
It’s as if the heatmap is shouting, “Here’s where the action
is!” -
The sudden market dip was driven by a wave of sell orders that
overwhelmed the buy orders at that specific price, causing the
price to plummet.
-
A Snapshot of Advanced Visualization in Action
Let’s walk through a scenario where a trader, equipped with advanced
visualization tools detects unusual market activity.
The Backdrop:
-
John, a professional trader, is monitoring the market using an
advanced visualization tool (Bookmap). -
He is focused on a particular stock that has been trading in a
relatively stable range for the past week. -
However, today, he noticed a sudden surge in volatility and price
movement. -
Something seems unusual.
How Does John Utilize Bookmap?
-
Analyzing the Heatmap View:
-
John closely examines the heatmap view, where he observes the
collective market activity in real-time. -
He quickly notices that a specific region of the heatmap has
become exceptionally active.
-
-
Identifying Concentrated Buy Orders:
-
Within this active area, John identifies a concentration of buy
orders clustered at a specific price level. -
The unique feature of Bookmap’s heatmap view allows him to not
only gauge overall market activity but also pinpoint where the
majority of these orders are positioned.
-
-
Real-time Data Observations:
-
John leverages the real-time data provided by Bookmap.
-
Using this information, he can observe market changes unfolding
within seconds and track the movement of buy orders. -
He discerns that these buy orders are rapidly shifting to higher
price levels, which is a dynamic he can exploit for informed
trading decisions.
-
John’s adept use of Bookmap, particularly his ability to dissect the heatmap
view and interpret real-time data, provides him with a substantial advantage
in making timely and well-informed trading choices. This tool enables him to
stay ahead in fast-paced financial markets by visualizing market dynamics as
they unfold.
How Does John Identify Adaptive Algorithm Activity?
Using Bookmap’s heatmap, John recognizes it’s not a gradual increase in
buying or selling, but rather, a rapid and concentrated shift in order
placement. In this case, it seems like an adaptive algorithm is:
-
Detecting changing market conditions and
-
Responding accordingly by shifting buy orders higher in an attempt
to catch an upward trend.
How Did John Gauge the Market Sentiments?
-
John uses his visualization tool to incorporate market sentiment
analysis data, which shows a significant uptick in positive news and
social media sentiment for the stock. -
He now has a stronger conviction that the unusual activity is driven
by the adaptive algorithm’s reaction to this positive sentiment.
The Final Trading Decision
-
With a better understanding of what’s happening, John decides to
adjust his trading position. -
He recognizes that the adaptive algorithm may be pushing prices
higher, and he wants to capitalize on this trend. -
John also sets up risk management alerts within his visualization
tool. If the market suddenly reverses or the unusual activity
ceases, he’ll be alerted to mitigate potential losses.
How Advanced Visualization Tools Helped John:
-
John was able to detect and identify unusual market activity as the
workings of an adaptive algorithm. -
The heatmap view allowed him to see order concentration and changes
in real time. -
Armed with this information, he was able to:
-
Make informed trading decisions and
-
Manage his risk effectively in the dynamic trading environment.
-
How Bookmap Contributes to Advanced Market Visualization
Bookmap offers traders the ability to personalize their visualization
experience by using “Custom Color Schemes”. It allows traders to choose
their color schemes for various elements on the Bookmap interface,
including:
-
Price levels
-
Order book depth, and
-
Traded volume
Why Personalization Matters
Personalization in visualization allows traders to align their tools and
data representations with their unique trading strategies, goals, and time
horizons. It helps in:
-
Setting specific visualization parameters.
-
Customizing their view to emphasize long-term trends,
support/resistance levels, and key fundamental indicators. -
Filtering out the noise and focusing on the specific data points
that are critical for their trading strategy. -
Receiving relevant insights without being overwhelmed by excessive
detail. -
Streamlining their view to show data that directly impacts their
trading decisions. -
Monitoring key indicators that reflect the health of their
investments over extended periods.
How Bookmap Provides Real-time Revelation
Bookmap stands out in its ability to transform live data feeds into visual
formats, allowing traders to make informed decisions in real time. Here’s
how it accomplishes this:
-
Bookmap displays live order book data with precision.
-
Bookmap visually represents limit orders at different price levels.
This visual representation offers traders a clear and intuitive view
of where buy and sell orders are concentrated, making it easier to
identify support and resistance levels and anticipate market
movements.
Let us understand this with an example:
-
A sudden influx of buy orders entered the market.
-
Bookmap immediately displayed these new orders on the heatmap.
-
This display allowed traders to react swiftly to the changing market
dynamics. -
The visualization made it clear:
-
Where are the buy orders clustering?
-
Whether this indicates a shift in sentiment or potential upward
momentum?
-
Tips for the Modern Trader
Traders can maximize the benefits of Bookmap by employing the following
strategies:
|
Tips |
The Practical Benefits |
|
Set Up Custom Views |
|
|
Keep Detecting Anomalies |
|
|
Tweak Settings |
|
Conclusion
The dominance of adaptive algorithms in trading is undeniable. These
sophisticated algorithms possess the remarkable ability to learn in real
time and autonomously adjust their trading decisions.
In light of this, the role of advanced visualization tools like Bookmap has
become paramount. These tools serve as a key to deciphering the seemingly
invisible and comprehending the intricate behaviors of these algorithms.
They shed light on market anomalies that might otherwise elude detection.
In an age defined by machine learning, artificial intelligence, and
increasingly intricate algorithms, it has become imperative for traders to
use advanced visualization tools and stay at the forefront. Do you want to
dive deeper into the intricacies of algorithmic trading?
Explore Bookmap’s complete guide to algorithmic trading
to further enhance your understanding of this sophisticated trading
approach.
Sign Up Now