See order flow more clearly in real time.
Compare plans to access deeper market visibility for order flow.
Education
July 17, 2024
SHARE
Behind the Curtain: Unraveling Market Trends Through Order Flow Analysis

Market sentiment; the attitude of investors towards price developments, guides investment decisions and reveals lucrative trading opportunities. To interpret market sentiment and unravel market trends, traders undertake order flow analysis. This is precisely what makes order flow analysis invaluable and indispensable.
In this article, we will begin with the basics of order flow and gradually explore:
- How to pinpoint optimal entry and exit points?
- How to anticipate market moves and trends before they happen?
- How to use order book dynamics with other sentiment indicators?
Loaded with plenty of practical examples, essential tips, and proven strategies, this article is designed to improve your trading strategies. Let’s begin.
Order Flow: The Basics
Order flow represents the ongoing stream of buy and sell orders placed by market participants. It provides crucial insights into market dynamics and sentiment. Let’s begin with the basics:
What is Order Flow?
- Order flow refers to the continuous influx of:
- Buy orders and
- Sell orders.
- These orders are submitted by the market participants.
- By analyzing order flow, traders can understand the demand and supply patterns for a particular asset.
- This understanding helps in:
- Gauging market sentiment and
- Anticipating potential price changes.
How is Order Flow Represented in the Market?
In market data, order flow is typically represented through various metrics and indicators. Let us see some key ones:
- Order Book
-
-
- The order book displays all outstanding buy and sell orders for a particular asset, along with their respective prices and quantities.
- It shows current market depth and liquidity.
-
- Volume
-
-
- Volume represents the total number of shares traded within a specific period.
- While order flow reflects the demand and supply of orders, volume indicates the actual transactions executed.
-
- Time and Sales
-
- Time and sales data show the sequence of trades executed.
- The following data gets captured:
- Price,
- Quantity, and
- Timestamp.
- This data involves a detailed record of transaction activity in the market.
Components of Order Flow
Having read about the basics of order flow, let’s now proceed to understand the different types of orders:
| Orders | Meaning | Example |
| Market Orders |
|
|
| Limit Orders |
|
|
| Stop Orders |
|
|
| Stop-Limit Orders |
|
|
What is the Bid Side and Ask Side of an Order Book?
As discussed earlier, the order book displays all outstanding buy and sell orders for an asset. For easy comprehension and analysis, it is divided into bid side and ask side.
Both these sides represent the quantities and prices at which traders are willing to buy and sell an asset, respectively. Let’s see a hypothetical order book of XYZ stock:
| Bid Side | Ask Side |
|
|
We can observe the following from the above order book:
- The bid side of an order book lists prices at which buyers are willing to purchase XYZ stock.
- The highest bid price is $50.10, and the lowest is $50.00.
- The ask side lists prices at which sellers are willing to sell XYZ stock.
- The lowest ask price is $50.20, and the highest is $50.30.
It must also be noted that the difference between the highest bid price and the lowest ask price is known as the bid-ask spread, which reflects market liquidity and trading conditions.
What is the Relationship Between Liquidity and Market Depth?
Liquidity refers to the ease with which an asset can be bought or sold in the market without causing significant price changes. Different levels of liquidity signal define market dynamics:
| Level of Liquidity | Interpretation |
| High Liquidity | A market with:
|
| Low Liquidity | A market with:
|
How does Order Flow Analysis Help in Price Prediction?
Order flow analysis refers to the examination of the flow of buy and sell orders. It helps traders to:
- Identify support and resistance levels,
- Detect buying or selling pressure, and
- Assess market sentiment and trend strength.
By assessing the nature of order flow, traders can analyze the price prediction. Let’s see how:
| Order Flow | Dominating Order Type | Sentiment | Price Prediction |
| Bullish Order Flow | Buy orders | Optimism | Price increase |
| Bearish Order Flow | Sell orders | Pessimism | Price decline |
Visual Representation of Order Flow
Most traders make informed decisions by visualizing order flow. They do so using several visual aids such as:
- Order book snapshots,
- Volume histograms, and
- Price charts.
Order Flow and Market Trends
Order flow analysis helps in identifying shifts in market trends. This happens because the changes in the flow of buy and sell orders often precede price movements. Let’s see how changes in order flow can indicate shifts in market trends:
- Increased Order Volume
-
-
- Sudden spikes in order volume occur especially in one direction.
- For example, a surge in buy orders indicates increasing bullish sentiment and an uptrend.
-
- Imbalance of Buy/Sell Orders
-
-
- When buy orders significantly outnumber sell orders, it suggests:
- Strong buying pressure and
- Upward trend.
- Conversely, an excess of sell orders indicates growing selling pressure and a possible downtrend.
- When buy orders significantly outnumber sell orders, it suggests:
-
- Price-Volume Relationship
-
- Correlating price movements with changes in order volume reveals the strength of a trend.
- For example, a price increase accompanied by high volume suggests strong buying interest.
To understand better, let’s consider two hypothetical scenarios and see how order flow indicators signal strong buying or selling opportunities:
| Parameters | Scenario 1: Strong Buying Opportunity | Scenario 2: Strong Selling Opportunity |
| Current Market Price | Stock XYZ is trading at $50 per share. | Stock XYZ is trading at $60 per share. |
| Order Flow Indicator | A sudden surge in buy orders with high volume | A rapid increase in sell orders with high volume |
| What should be the appropriate trading strategy? |
|
|
Practical Applications of Order Flow Analysis
Order flow analysis is widely used by traders to identify and capitalize on market trends. Some of its popular practical applications are listed below:
-
- Analyzing order flow dynamics to gauge
- Market sentiment and
- Analyzing order flow dynamics to gauge
- Trend direction.
-
- Confirming price trends and key support/resistance levels with order flow patterns.
- Detecting potential trend reversals through:
- Divergence with price movements and
- Sudden shifts in order flow.
- Timing entries and exits by identifying:
- Optimal entry points during trend pullbacks and
- Exit points when the trend shows signs of exhaustion.
Let’s go deep and learn how traders can apply order flow analysis to identify entry and exit points.
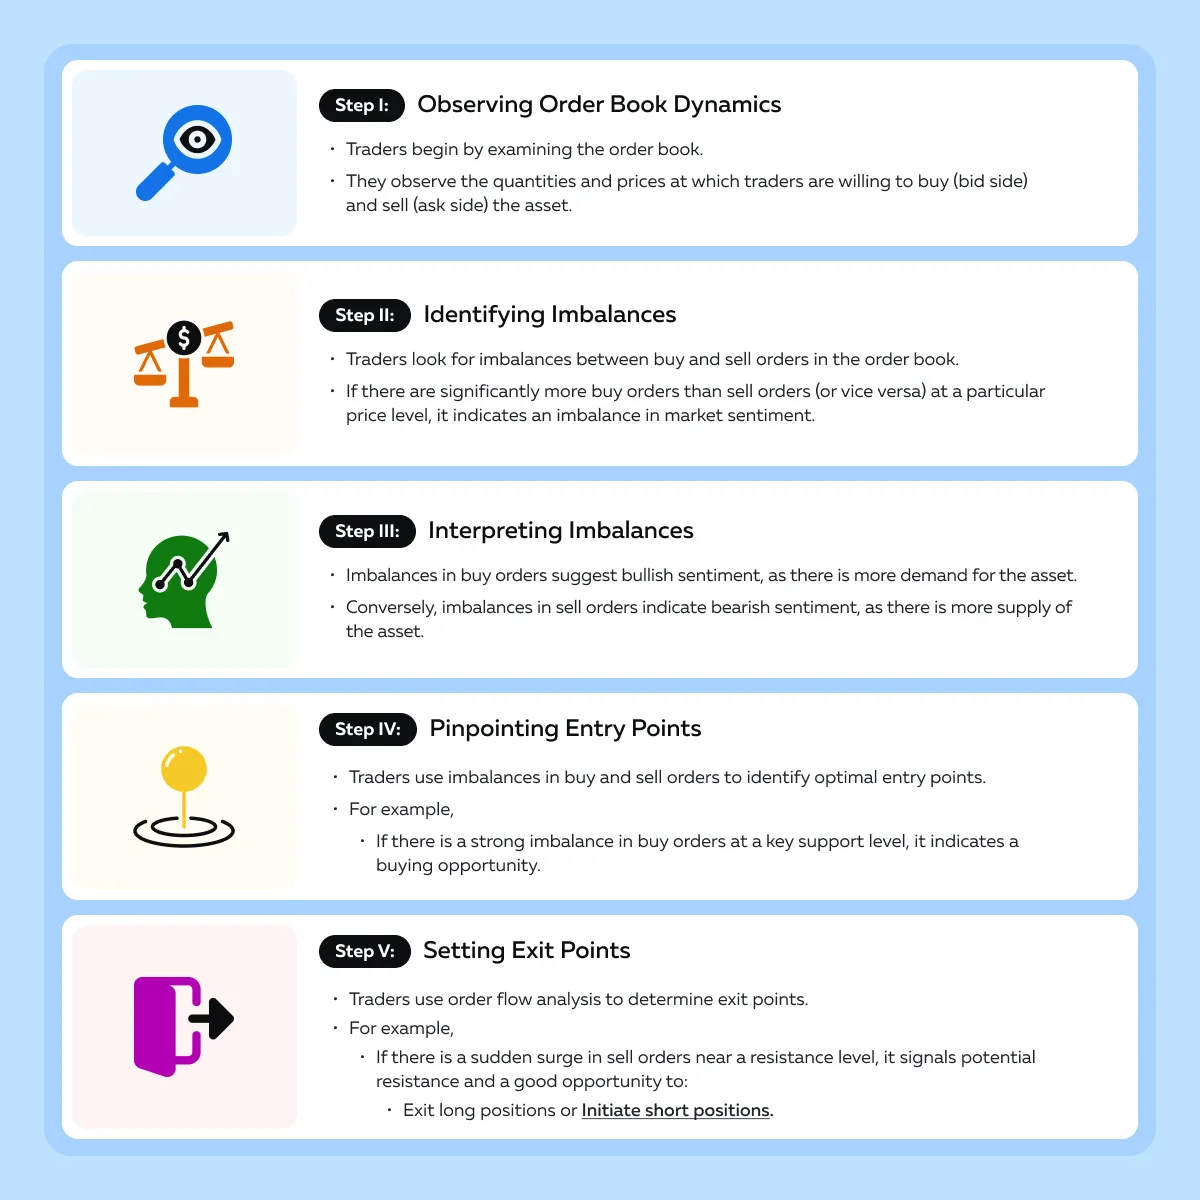
Identifying Entry and Exit Points
Read the step-by-step process followed by most traders:
Now, let’s refer to some hypothetical scenarios:
| Parameters | Example 1: Breakout Trading Opportunity | Example 2: Reversal Trading Opportunity |
| Scenario |
|
|
| Order Flow Analysis | The analysis shows:
|
The analysis shows:
|
| Trading Strategy |
|
|
Improving Trading Strategies with Order Flow Data
Order flow analysis helps traders develop profitable trading strategies. Further, they can optimize their trading decisions by getting confirmations from other forms of technical analysis. Let’s see how order flow analysis can be used in conjunction with other technical analysis techniques:
Benefits of Using Order Flow Analysis + Trend Lines
- Helps in Confirming Trend Strength
-
- When a trend line is broken, order flow analysis can confirm whether the breakout is supported by significant buy or sell orders.
- Strong order flow in the direction of the breakout reinforces the validity of the trend reversal or continuation.
Benefits of Using Order Flow Analysis + Price Patterns
- Provides Confirmation of Double Tops/Bottoms Pattern
-
- Order flow analysis confirms the validity of double tops or bottoms patterns.
- It does so by examining the balance between buy and sell orders at key reversal points.
- A surge in sell orders following a double top formation strengthens the bearish signal.
Benefits of Using Order Flow Analysis + Breakout Patterns
- Provides Breakout Confirmation
-
- Order flow analysis confirms breakout patterns, such as triangles or rectangles.
- It does so by identifying a buildup of buy or sell orders near support or resistance levels.
- A surge in order flow following a breakout reinforces the likelihood of a sustained price movement.
What is Confluence?
Confluence occurs when multiple technical analysis techniques align. This occurrence provides stronger confirmation of a potential trade opportunity. Order flow data adds an extra layer of confirmation when it aligns with other forms of technical analysis.
Let’s understand this concept better through an example showing the confluence of Breakout pattern + MACD crossover + Order Flow Analysis:
The Market Scenario
- Stock ABC has been trading in a range between $50 and $60 for several weeks.
- Traders are predicting a breakout from this range.
- However, they want confirmation before entering a trade.
Confluence of Indicators
- Breakout Pattern
-
-
- Technical analysis reveals the formation of a bullish breakout pattern.
- It is observed that the stock price is approaching the upper boundary of the trading range.
-
- Moving Average Convergence Divergence (MACD)
-
-
- The MACD indicator shows a bullish crossover.
- This event indicates increasing upward momentum.
-
- Order Flow Analysis
-
- Order flow data confirms the bullish bias.
- The data suggests a:
- Surge in buy orders and
- Narrowing bid-ask spreads.
The Confirmation
The confluence of the breakout pattern, MACD crossover, and bullish order flow signals, provide strong confirmation of a potential uptrend continuation Traders decide to enter a long position in Stock ABC, anticipating further upward movement.
Lessons Learned
- We saw how order flow data added an extra layer of confirmation to the trade decision.
- It validated the bullish bias observed through technical analysis indicators.
The Psychological Dimension: Understanding Market Sentiment
Order flow is not merely a reflection of market dynamics but also a window into the collective psychology of market participants. It reflects the psychological state of the market by providing information relating to:
- Trader sentiment and
- Behavior.
By understanding market sentiment, traders can anticipate price movements and identify trading opportunities. Whether driven by fear, greed, or herd mentality, order flow provides a real-time glimpse into the collective psyche of market participants.
Reading the Market’s Mind
It is worth noting that large orders and the distribution of buy and sell orders can provide clues about the market’s bullish or bearish stance. Let’s see how:
| Bullish Stance | Bearish Stance |
|
|
The Psychological Impact of Large Orders
Large orders can evoke emotions such as excitement or fear among individual traders. When traders see a big order to buy, they feel excited and confident. Consequently, they want to join in and buy too, making everyone more hopeful about the market going up.
Contrarily, if they see a big order to sell, they get scared and trigger panic selling. Consequently, they exit positions and initiate bearish sentiment.
How to Detect Sentiment Shifts?
By carefully observing changes in order flow, traders can detect shifts in sentiment. For example,
- A market was previously dominated by buy orders.
- Suddenly, it experiences a surge in sales orders.
- This event signals a shift from bullish to bearish sentiment.
Furthermore, an analysis of the order book for imbalances between buy and sell orders provides early indications of sentiment shifts. For example,
- The bid side of the order book becomes significantly thinner, while the ask side thickens.
- This event suggests growing bearish sentiment and potential downward pressure on prices.
Anticipating Moves with Order Flow Analysis
Several traders use sentiment indicators to anticipate market moves. To do so, they extract critical information from the order flow, such as aggressive buying or selling pressure.
Let’s understand how to do this:
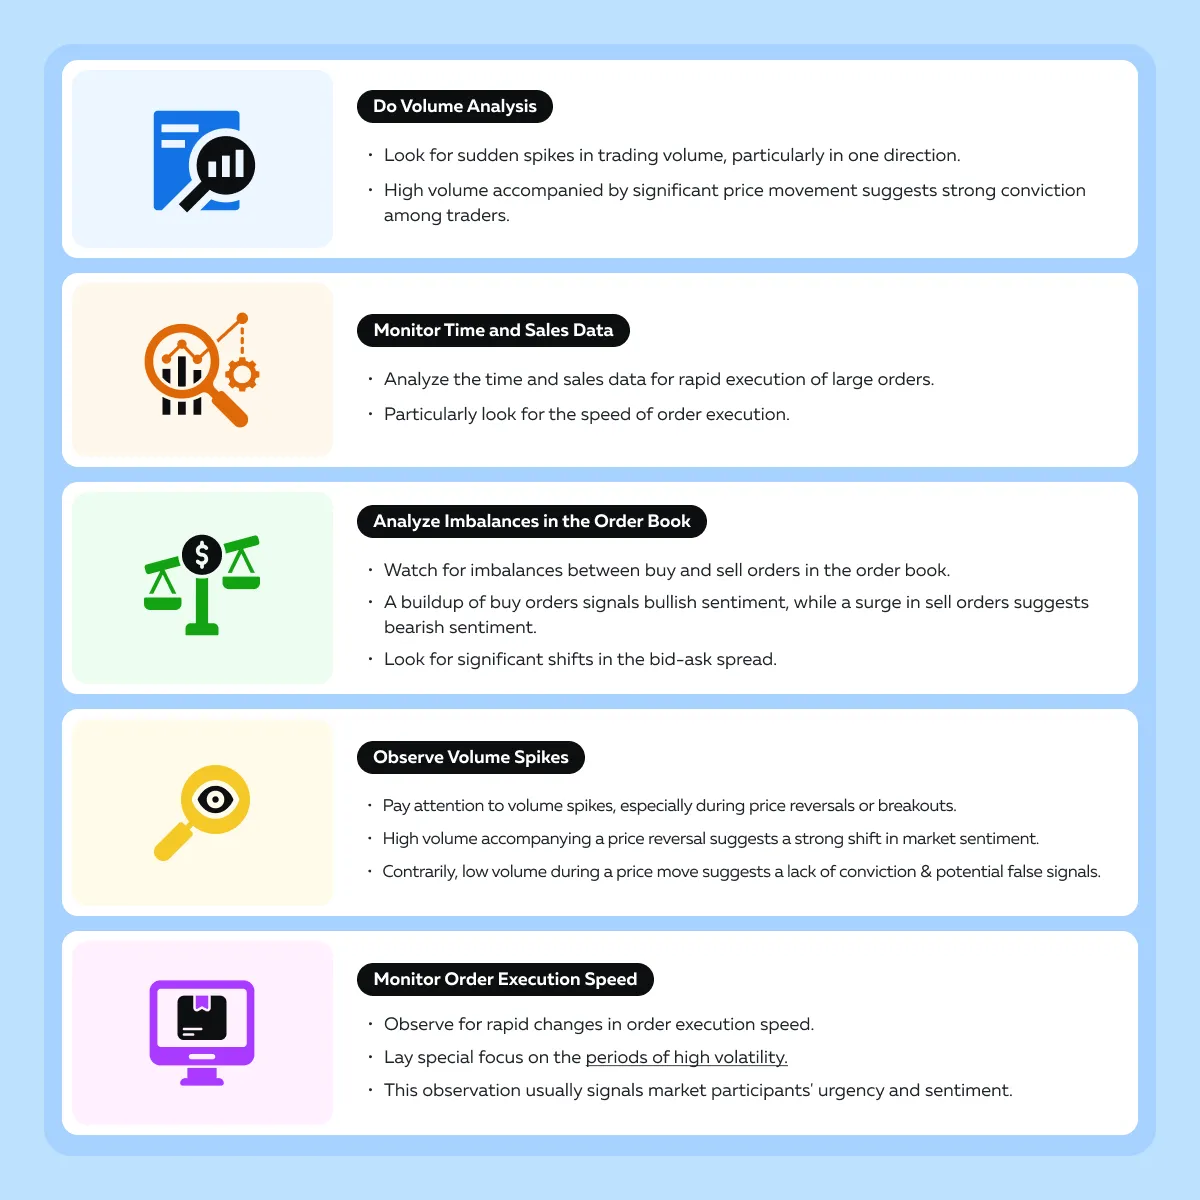
Important Guidance for Accurate Interpretation
Consider order flow signals within the context of broader market conditions, including:
- Economic data releases,
- Geopolitical events, and
- Overall market sentiment.
Also, confirm order flow signals with other technical analysis tools for validation. Use tools such as trend lines, moving averages, and support/resistance levels. To increase confidence in trade decisions, you should look for confluence between order flow analysis and technical indicators.
Conclusion
Order flow analysis is a crucial tool for traders to understand and predict market trends. Large orders and order book imbalances affect traders’ emotions, like fear or greed, and influence price movements.
By studying order flow and signs, such as volume spikes or changes in order speed, traders can anticipate market changes. However, they must confirm these signals with other analysis tools, like trend lines or price patterns, to make smart trading decisions. By understanding order flow, traders can increase their price predictive power and optimize their trading decisions.
Want to know more about order flow analysis? Explore further insights on how it complements technical analysis in our blog post here. Start enhancing your trading strategies today!
Sign Up Now