See correlation more clearly in real time.
Compare plans to access deeper market visibility for correlation.
Trading Basics
December 11, 2024
SHARE
Deciphering Market Relationships: The Dynamics of Correlation Trading

Have you ever wondered how the seemingly distinct assets in financial
markets are intricately interconnected, their movements subtly influencing
each other’s prices? This intriguing puzzle lies in the secrets of
correlation trading.
In this article, we will understand how new tools are simplifying the
understanding of these connections, ultimately paving the way for profit in
this ever-evolving landscape of emerging technologies.
Also, we will explore some of the strategies that make correlation trading
even smarter. So, let’s dive in and learn more.
Grasping the Intricacies of Correlation Trading
Correlation trading is a sophisticated strategy revolving around the idea
that the price movements of one asset can influence or predict the price
movements of another. To measure this movement, a statistical measure known
as the correlation coefficient is used.
What are Correlation Coefficients?
-
These coefficients quantify the degree of association between the
two assets. -
These range from -1 to 1.
-
The value of the correlation coefficient indicates the strength and
direction of the correlation.
Refer to the table below and understand the three common types of
correlation coefficients and their indications:
|
Types of Correlation |
Correlation Coefficients |
Indication |
|
Perfect Negative Correlation |
-1 |
When one asset goes up, the other goes down |
|
Perfect Positive Correlation |
1 |
Both assets move in the same direction |
|
No Correlation |
0 |
Signifies no linear relationship between the assets |
The Foundations of Correlation Trading
Correlation trading is commonly used by traders and investors to identify
and capitalize on the interconnectedness of various assets. It is not
limited to any particular market or asset class and includes equities,
commodities, currencies, and more.
The core idea is to identify when the prices of two or more assets move:
-
In tandem or
-
In opposite directions
This identification provides opportunities for profit or risk mitigation.
Dynamic Nature of Correlation Coefficients
It must also be noted that correlations are not static. They can change over
time due to various factors. Geopolitical events, economic news, or policy
changes can dramatically alter the dynamics between different markets.
For example,
-
Let’s consider the impact of geopolitical tensions.
-
In the event of a war or significant political turmoil, assets like
gold and oil may experience sharp price increases due to increased
demand for safe-haven assets or supply disruptions. -
At the same time, stock markets might display vulnerability, with
investors reacting to uncertainty and potential economic fallout. -
These changing correlations can present opportunities for
correlation traders to profit by:-
Going long on gold and
-
Short on equities
-
Note: Successful correlation trading requires a deep understanding of
financial markets and a keen awareness of the global events and factors that
can shape these relationships.
Real-World Correlations in Trading
Let’s explore real-world correlations in trading by examining three classic
scenarios:
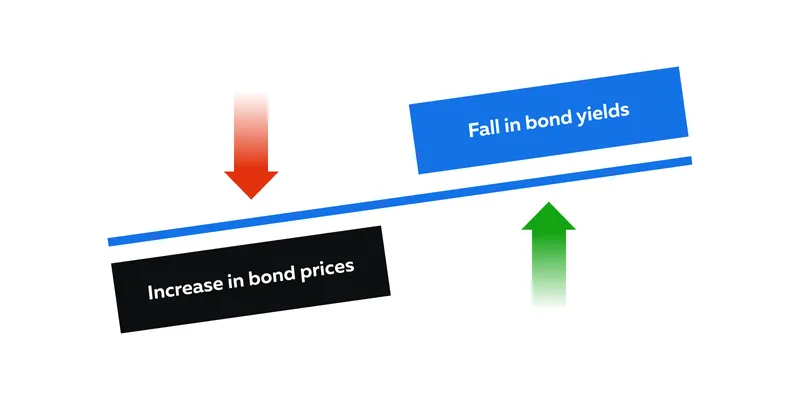
Scenario 1: Bond Prices and Yields
-
The relationship between bond prices and yields is a classic example
of real-world correlations. -
When bond prices rise, bond yields fall, and vice versa.
-
This inverse correlation is because of the concept that bond prices
move in the opposite direction of yields.
Let’s understand through an example.
-
Assume that global economic uncertainty is on the rise.
-
In such a situation, investors often seek safety in government
bonds, which are considered low-risk assets. -
As demand for these bonds increases, their:
-
Prices go up, and
-
Yields go down
-
-
Investors refrain from investing in riskier assets such as equities.
Scenario 2: Gold and Geopolitical Crises/Oil Price Movements:
-
During geopolitical crises or times of increased global uncertainty,
investors often instinctively turn to gold. -
This is because gold is considered as a safe-haven asset.
-
Gold has an inverse correlation with riskier assets like stocks.
-
This is because gold:
-
Is considered a store of value and
-
Acts as a hedge against economic instability.
-
-
As tensions rise, gold prices tend to increase as investors view
gold as a reliable asset to weather the storm.
Scenario 3: Oil Price Movements and Broader Economic Correlations
-
Significant oil price movements also reveal intricate correlations.
-
Oil, being a critical commodity, has wide-reaching impacts on
various sectors of the economy. -
For instance,
-
When oil prices surge, it drives up the costs of production and
transportation. -
This surge impacts a wide range of industries and leads to
negative correlations between oil prices and the performance of
stocks in those sectors.
-
Enhancing Correlation Insights Through Visualization
In modern trading, visualization tools provide traders with an immediate and
intuitive understanding of market dynamics. They allow traders to identify
changes in real-time and respond swiftly. Let’s understand how visualization
enhances correlation insights.
Traditional Correlations vs Visual Tools
Traditional methods of assessing correlations, such as using numerical data
like correlation coefficients, have long been used as an analysis tool in
trading.
However, these approaches have limitations:
-
Difficult Interpretation:
-
Correlation coefficients provide a quantitative measure of the
relationship between two assets. -
A correlation of -1 to 1 indicates the strength and direction of
the relationship. -
However, this numerical data alone can be challenging to
interpret swiftly. -
This challenge gets amplified especially when dealing with
multiple assets or rapidly changing market conditions.
-
-
Lack of Intuition
-
Correlation coefficients lack visual representation.
-
Traders often need to mentally process these numbers, which can
be time-consuming and error-prone in the heat of trading.
-
-
Inefficiency in Multivariable Analysis:
-
When dealing with multiple assets or complex portfolio
strategies, calculating and interpreting individual correlation
coefficients for each pair of assets can be a cumbersome and
time-intensive process.
-
Real-Time Adaptation Through Visual Cues
In fast-paced trading, market correlations experience abrupt changes. These
changes can increase during news breakouts, economic data releases, or
policy announcements. This is where visualization tools come to the rescue.
Transformative Power of Visualization:
Visualization tools like correlation matrices and scatter plots offer a more
immediate and intuitive grasp of market dynamics. They enable traders to:
-
Identify rapid changes by representing correlations in real time,
-
React swiftly through dynamic color changes or markers.
The Merits of Multi-Asset Visualization
Multi-asset visualization tools allow traders to view and compare
correlations among multiple assets at the same time. Visualizing multiple
assets in a unified display reduces the risk of overlooking important
correlations.
Traders face major difficulties when they monitor correlations among
multiple assets simultaneously. Traditional methods make this a cumbersome
task, but synchronized visualization tools can make it straightforward and
accurate.
Innovations in Visualizing Correlation Data
Traditional analysis has several limitations. This is where visualization
comes into the picture. Let’s understand its growing prominence in detail.
Overlay Insights and Comparative Analysis
Overlays in visualization tools allow for the direct comparison of datasets.
It enables traders to visualize multiple assets or datasets:
-
Side by side or
-
Superimposed on one another.
Merits of Side-by-Side vs. Overlaid Viewing:
-
Side by Side Viewing:
-
Viewing assets side by side provides a clear, unobstructed
comparison. -
Traders can easily identify:
-
Trends
-
Divergences, or
-
Convergences
-
-
-
Overlaid Viewing:
-
Overlaying assets can be beneficial when traders want to spot
immediate co-movements. -
It is particularly useful in intraday trading where
minute-by-minute movements are essential. -
For instance, in high-frequency trading, overlaying order book
data can help traders identify potential arbitrage opportunities
by visualizing bid-ask spreads and trade execution prices
simultaneously.
-
Heatmaps for Portfolio Optimization
Heatmaps provide a visual representation of asset relationships using color
coding. In the context of correlation analysis:
-
A heatmap displays the strength and direction of correlations
between various assets. -
Each cell in the heatmap corresponds to a pair of assets.
-
The color intensity of the cell indicates the correlation strength.
For example, a deep green cell may represent a strong positive correlation,
while a dark red cell indicates a strong negative correlation.
Using Heatmaps for Portfolio Optimization:
Traders can employ Heatmaps for identifying portfolio imbalances. By quickly
glancing at the heatmap, they can identify the following:
|
Assets with strong positive correlations |
These assets indicate potential concentration risk. |
|
Assets with strong negative correlations |
These assets indicate diversification opportunities. |
Time’s Role: The Importance of Time-Lapse Analysis
Correlations are not static; they change over different timeframes. Hourly,
daily, monthly, or even intraday correlations can exhibit distinct patterns.
Time-lapse analysis enables traders to make more informed decisions by
adapting to the changing nature of correlations over various timeframes.
Let’s see some common benefits:
Benefits of Time-lapse Analysis
|
Time Frame |
Benefits |
|
Intraday Analysis |
Tacking correlations on an hourly or minute-by-minute
|
|
Daily Analysis |
Daily correlations can:
|
|
Monthly Analysis |
Monthly correlations offer a macroeconomic perspective. |
Conclusion
Correlation trading is an old-school analysis technique. It is based on the
concept that movement in the price of one asset affects the other. However,
in the current fast-paced world of trading, it is marred with several
limitations. These traditional methods lack an intuitive visual
representation and prove inefficient when dealing with multiple assets.
This led to the development of visualization techniques that have
revolutionized correlation analysis. Among these innovative techniques,
heatmaps stand out with their color-coded depiction of correlation strength.
These tools have brought about a revolution in portfolio optimization,
offering traders a dynamic and visually intuitive means to navigate the
intricate web of asset relationships in today’s complex financial markets.
Are you ready to take your correlation trading to the next level? Dive
deeper and harness the power of cutting-edge visualization with
Bookmap’s Correlation Tracker Indicator
. Discover the tools that seasoned traders are using to make informed
decisions in dynamic markets.
Sign Up Now