See order flow more clearly in real time.
Compare plans to access deeper market visibility for order flow.
Education
August 18, 2024
SHARE
Exploring the Link: Order Flow and Price Action

Imagine making money with just a few clicks—it’s like a modern magic trick. The financial market opens a door to trade and profits, but here’s the secret: success isn’t a given. Especially for newcomers who dive in without knowing the ropes. One crucial rope to grab onto is the link between order flow and price action.
Think of order flow as the heartbeat of trading—it affects prices in fascinating ways. If you’re a trader, getting this connection can be your superpower. It helps you time trades better, catch potential turnarounds, and find hidden opportunities in the market. Let’s take a closer look at this powerful connection and uncover how it can help you trade smarter.
What Is Order Flow?
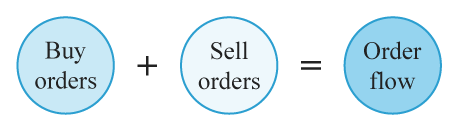
Order flow refers to the real-time stream of buy and sell orders placed in the financial market for assets such as stocks, bonds, commodities, and even cryptocurrencies. All this data is electronically recorded in an order book.
An order flow comprises two primary sides, which are:
- Buy Orders (Bids): This component represents the demand side of the market and reflects traders’ willingness to buy assets at specific prices.
- Sell Orders (Asks): These represent the supply side of the market and indicate traders’ intention to sell assets at specific prices.
By assessing order flow, traders and investors can gauge the real-time sentiment of the market, detecting potential imbalances. Moreover, consistent monitoring of order flows aids in identifying instances of institutional buying or selling.
Components of Order Flow
Order flow has several key components that offer insights into the demand and supply dynamics within the market. Let’s explore these components:
| Components | Explanation |
| Market Orders |
|
| Limit Orders |
|
| Canceled Orders |
|
| Trading Volume |
|
| Bid-Ask Spread |
|
| Order Timing |
|
How Traders Use Order Flow
Recognizing the significance of crafting effective trading strategies is paramount. By diving into order flow, traders can attain profound insights into market composition and spot potential price movements as well as emerging trends.
This is how traders use order flow to understand market dynamics:
- Gauge Market Sentiments:
Understanding market sentiment is crucial, and it’s as simple as observing the volume of buy and sell orders. An overflow of buy orders indicates bullish sentiment, while an abundance of sell orders signifies bearish sentiment.
- Identify Support and Resistance Levels:
Order flow analysis aids traders in pinpointing key price levels. The concentration of buy orders indicates the support level, while sell orders define the resistance level.
- Liquidity Assessment:
The depth of order books, with substantial buy and sell orders, indicates higher liquidity. This means more participants are ready to transact at those levels. Conversely, shallower order books imply lower liquidity due to smaller order sizes.
- Recognize Market Timing:
By examining the volume of orders at different price levels (also known as Volume profile analysis), traders can recognize the correct entry, exit, and stop-loss levels. Usually, the presence of higher volumes at a specific price level shows significant trading interest, which is helpful in determining the right market timing.
Deciphering Price Action
In the trading world, the importance of predicting stock market movements cannot be undermined. It helps traders strategically position themselves ahead of market movements and time their entry and exit points to perfection.
The Basics of Price Action Trading
“Price action” is a technique in which traders interpret and analyze the movement of the price of an asset on a chart. The focus is laid on raw price data, including patterns, trends, and key levels, without paying heed to indicators or other external factors.
Most traders use price action to predict potential price movements, solely relying on the observed price patterns. Here are several ways to use price action:
| Uses | Primary Aim | Technique |
| Trend Analysis | To identify uptrends and downtrends |
|
| Price Levels | To identify support and resistance levels |
|
| Spot Reversals | To identify spot reversals |
|
| Place Stop-losses | To identify appropriate price levels at which stop-losses can be placed |
|
Chart Patterns and Price Action
Traders who use price action often rely on diverse chart patterns to predict potential price movements. These patterns largely stem from market participants’ perceptions and behaviors. Some of the most common chart patterns are listed below:
- Head and Shoulders Pattern:
- Consists of three peaks —a higher peak (head) flanked by two lower peaks (shoulders)
- Signals a potential reversal from an uptrend to a downtrend
- Most traders watch for the break of the neckline (a support level connecting the lows of the shoulders) to confirm the pattern.
- Inverse Head and Shoulders Pattern
- Comprises three troughs—a lower trough (head) flanked by two higher troughs (shoulders)
- Indicates a potential reversal from a downtrend to an uptrend
- The breakout of the neckline (a resistance level connecting the highs of the shoulders) confirms the pattern.
- Double Top and Double Bottom:
- The “Double Top” pattern forms after an uptrend and consists of two peaks at the same price level.
- The “Double Bottom” pattern forms after a downtrend and comprises two troughs at approximately the same level.
- Both of these patterns denote trend reversals.
- Ascending Triangle:
- Arises as price forms higher lows, encountering a horizontal resistance level.
- Implies potential sustained growth if price surpasses the resistance.
- Descending Triangle:
- Occurs when the price makes lower highs and reaches a horizontal support level.
- Points to a potential downward continuation if the price breaks below the support.
- Flag Patterns:
- Arise after a sharp price movement
- A bullish flag forms during an uptrend, whereas a bearish flag occurs during a downtrend.
- Rising Wedge and Falling Wedge:
- Rising wedges have upward-sloping trendlines.
- Falling wedges have downward-sloping trendlines.
- Both patterns signify trend reversals and surface at price highs and lows.
The Relationship Between Order Flow and Price Action
To gain a deeper understanding of how market prices move and change, it is critical to become aware of the relationship between order flow and price action. It’s because the dynamics of order flow directly impact price action and can lead to changes in price movements. Let’s explore the relationship further:
- Supply and Demand Situation:
- An excess of buy orders relative to sell orders can lead to increased demand, pushing prices higher (bullish price action).
- Conversely, a surge in sell orders compared to buy orders can lead to excess supply, causing prices to decrease (bearish price action).
- Market Sentiment:
- A sudden surge in aggressive buying indicates bullish sentiment and leads to upward price movement.
- Conversely, a surge in aggressive selling can signal bearish sentiment and result in downward price movement.
- Stop-Loss Orders and Breakouts:
- A cluster of stop-loss orders below a support level can lead to price acceleration if triggered, resulting in a sharp downward move (stop run).
- Breakouts above resistance or below support can occur when order flow leads to a concentration of buy or sell orders at those levels.
- News and Events Impact:
- The release of major news or events can lead to a surge in order flow and cause significant price movements.
- Traders analyze the order flow around such events to anticipate price direction.
Using Order Flow to Predict Price Movements:
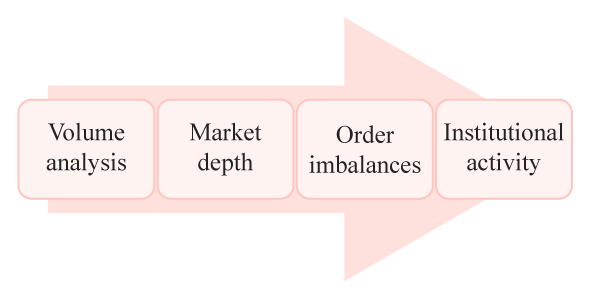
Traders use various strategies to analyze order flow and predict price movements. Some popular strategies include:
- Volume Analysis: By studying trading volumes at different price levels, areas of high trading interest can be identified. High volume indicates potential price reversals or breakouts.
- Depth of Market: Traders analyze the order book’s depth to assess liquidity and potential price impact. A deeper order book with narrow bid-ask spreads suggests high levels of liquidity.
- Order Imbalances: Significant order imbalances can signal short-term price reversals or continuation of momentum.
- Institutional Activity: Recognizing large orders from institutional traders can offer insights into potential trends.
How To Analyze Order Flow and Price Action
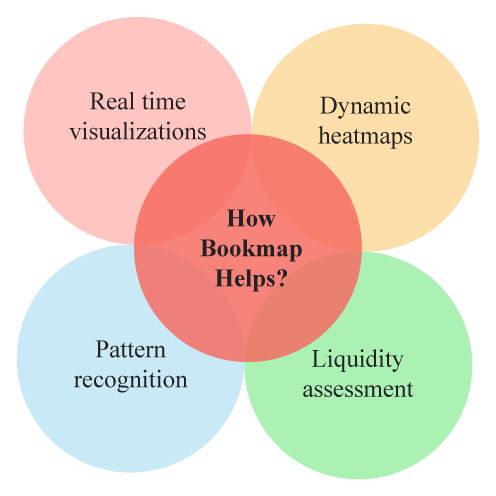
To navigate the intricate landscape of order flow and price action, traders are empowered by advanced tools like Bookmap. These tools play a pivotal role in establishing a profound understanding of market dynamics and trends. With features designed to provide real-time insights, traders gain a competitive edge in decision-making.
- Real-Time Visualizations:
Bookmap offers real-time visualizations of order book data, allowing traders to observe market depth, the density of orders at various price levels, and shifts in order flow. This visual representation aids in spotting trends and understanding the distribution of buy and sell orders.
- Dynamic Heatmaps:
The dynamic heatmap feature of tools like Bookmap highlights changes in market activity. Areas of intense order flow are color-coded, indicating where trading interest is concentrated. Traders can quickly identify pivotal price levels where significant activity is taking place, making informed decisions about entry and exit points.
- Pattern Recognition:
By visualizing order flow data, traders can identify patterns that signify potential market shifts. Whether it’s sudden clusters of orders or abrupt spikes in activity, these patterns can signal imminent reversals, breakouts, or trend continuations.
- Making Informed Decisions:
The combination of these features empowers traders to make well-informed decisions. Whether it’s identifying hidden liquidity, recognizing trends, or predicting short-term price movements, these tools provide the necessary insights to thrive in the dynamic trading environment.
In summary, trading tools like Bookmap bridge the gap between order flow and price action, offering traders a comprehensive perspective on market movements. By leveraging these tools, traders can unlock the potential of order flow analysis and enhance their trading strategies for greater success.
Want to harness the power of order flow and price action for better trading decisions? Start your journey with Bookmap today and unlock a new level of market understanding.
Conclusion
In conclusion, understanding how order flow and price action work together is crucial for successful trading. This knowledge helps reveal market sentiment, guides entry and exit decisions, and improves risk management.
Being skilled at interpreting how order flow affects prices enables traders to spot market imbalances, anticipate shifts in trends, and make well-timed decisions about when to enter or exit trades. This understanding forms a strong foundation for achieving trading success in a dynamic market environment.
Sign Up Now