
Our 4th of July Sale is Live
Offer Valid July 4 – July 11
Get 50% off Global+ AND data for 3 months—or save 30% on Global+ for the full year
Claim Your DealReady to see the market clearly?
Sign up now and make smarter trades today
Interviews
February 11, 2024
SHARE
How I Found the Missing Element for Technical and News Traders
An account of my personal experience with Bookmap and market liquidity
Trading at most exchanges has switched from a floor-based to electronic trading. Today, even individual and retail traders can receive information and execute their orders in a sub-second time interval. This change significantly impacts numerous aspects of trading.
Everything now has to be considered on a millisecond scale, and everything happens much quicker. Furthermore, a substantial majority of orders are canceled within a second. Hence, the processes are far more complex than they have been before, and all these factors make it more complicated to analyze the market’s behavior.
Before using Bookmap, I worked with a platform where only a traditional DOM was displayed. There were a lot of limitations in observing and interpreting the market activity. That was a tough process: I could spend more than ten hours in front of the screen watching and waiting for a large seller or buyer to step into the market. The possibility of missing that piece of important information during the observation was extremely high.
Bookmap appeared really helpful in terms of the order flow visualization. The possibility of missing information about the market activity is almost zero. With the new features, all important market data can be easily displayed to get a better insight into the market movement.
Bookmap visualizes all factors, such as order submission and cancelation, and each trade execution will be recorded. This data helps traders to understand the mechanism of the auction market. For example, the precise analysis of the limit order book and the dynamic order flow is required to build accurate algorithmic trading strategies. Even regulation authorities can benefit from a deeper understanding of the dynamics and behavior behind the trades.
There are two types of information used by most traders: a technical analysis and news.
Traders of both orientations always face the following problems:
| Technical Analysis | How Bookmap Improves Decisions |
| Failure to recognize the participant’s activity at a specific technical level.
|
Bookmap displays all market activity such as limit orders, volume traded / executions, as well as provides unique indications derived from such data as hidden liquidity (an iceberg order). |
| There are too many levels that need to be marked, and a trader is confused as to which level will get the response from the participant.
|
Bookmap can filter out the strong price levels and the weak price levels based on the real liquidity. This reduces the risk of being trapped into false levels. |
| News Analysis | |
| There are too many News data that need to be processed. It’s hard to differentiate between long-term and short-term information.
|
A trader will get the confirmation for any response from the information that comes from rumors, news, or any fundamental data by looking at the participants’ behavior during the event. |
| The market is changing fast in terms of information. Today’s News data may no longer work after the new information becomes available on the market.
|
All changes in a participant’s sentiment or opinion are reflected by the actions taken by the traders and displayed on Bookmap. A trader can filter the information according to his/her needs. |
A scenario where BOOKMAP helps a Technical Trader to make better decisions
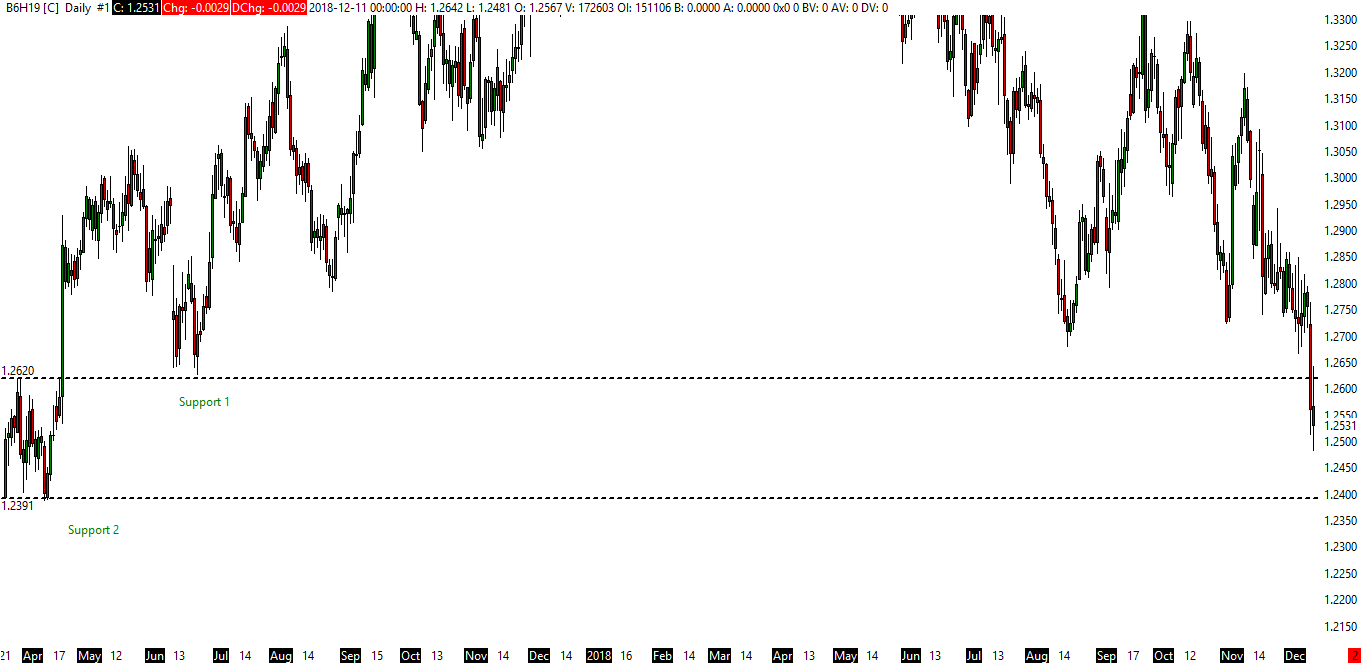
Figure 1. GBP/USD Daily Chart with Technical Support
Figure 1 shows the GBP/USD at a daily chart timeframe. There are two key support levels that may be used by a technical trader: 1.2620 and 1.2391.
We can expect several views and decisions from the technical trader:
- A tendency to go long at Support Level 1;
- A tendency to wait at Support Level 2 which is considered to be a strong support and take a long position.
What really happens? How Bookmap can help to choose the right level?
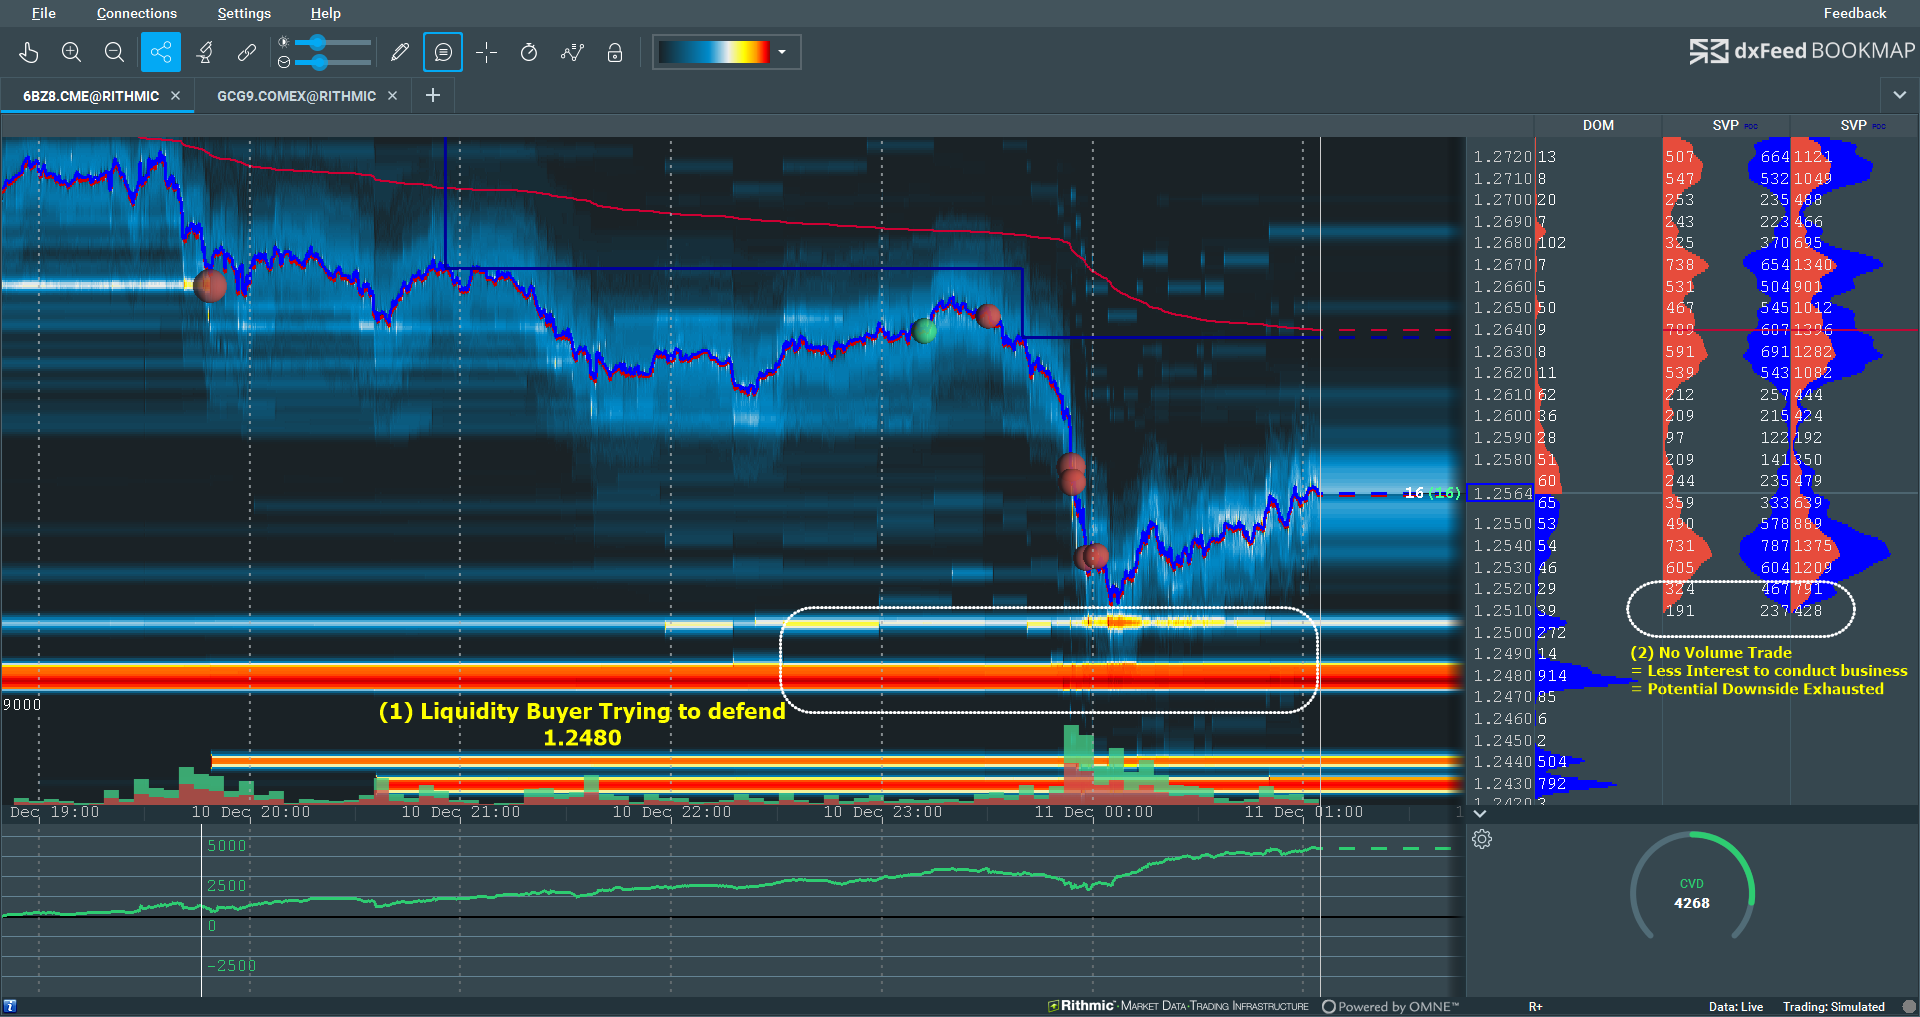
Figure 2. Bookmap displays the liquidity in the market. Strong buying liquidity at the key level and the volume traded help to confirm that the trend reaches exhaustion
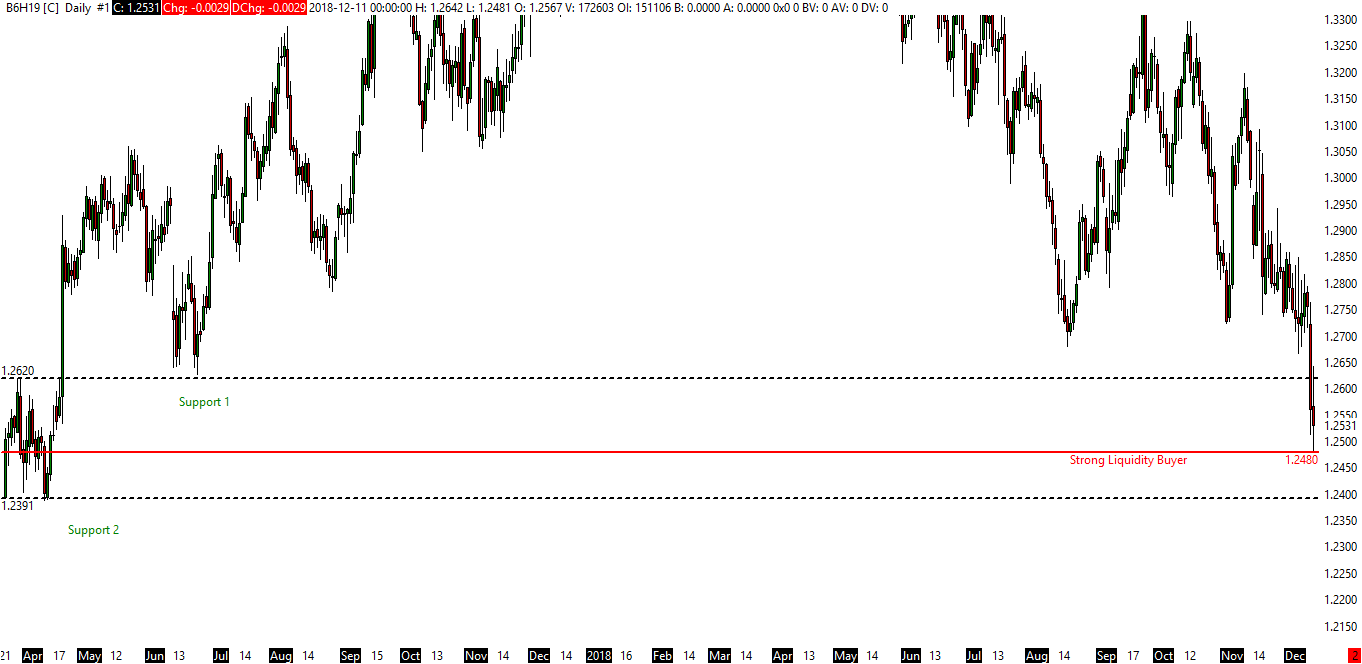
Figure 3. A liquidity buyer at 1.2480 trying to defend
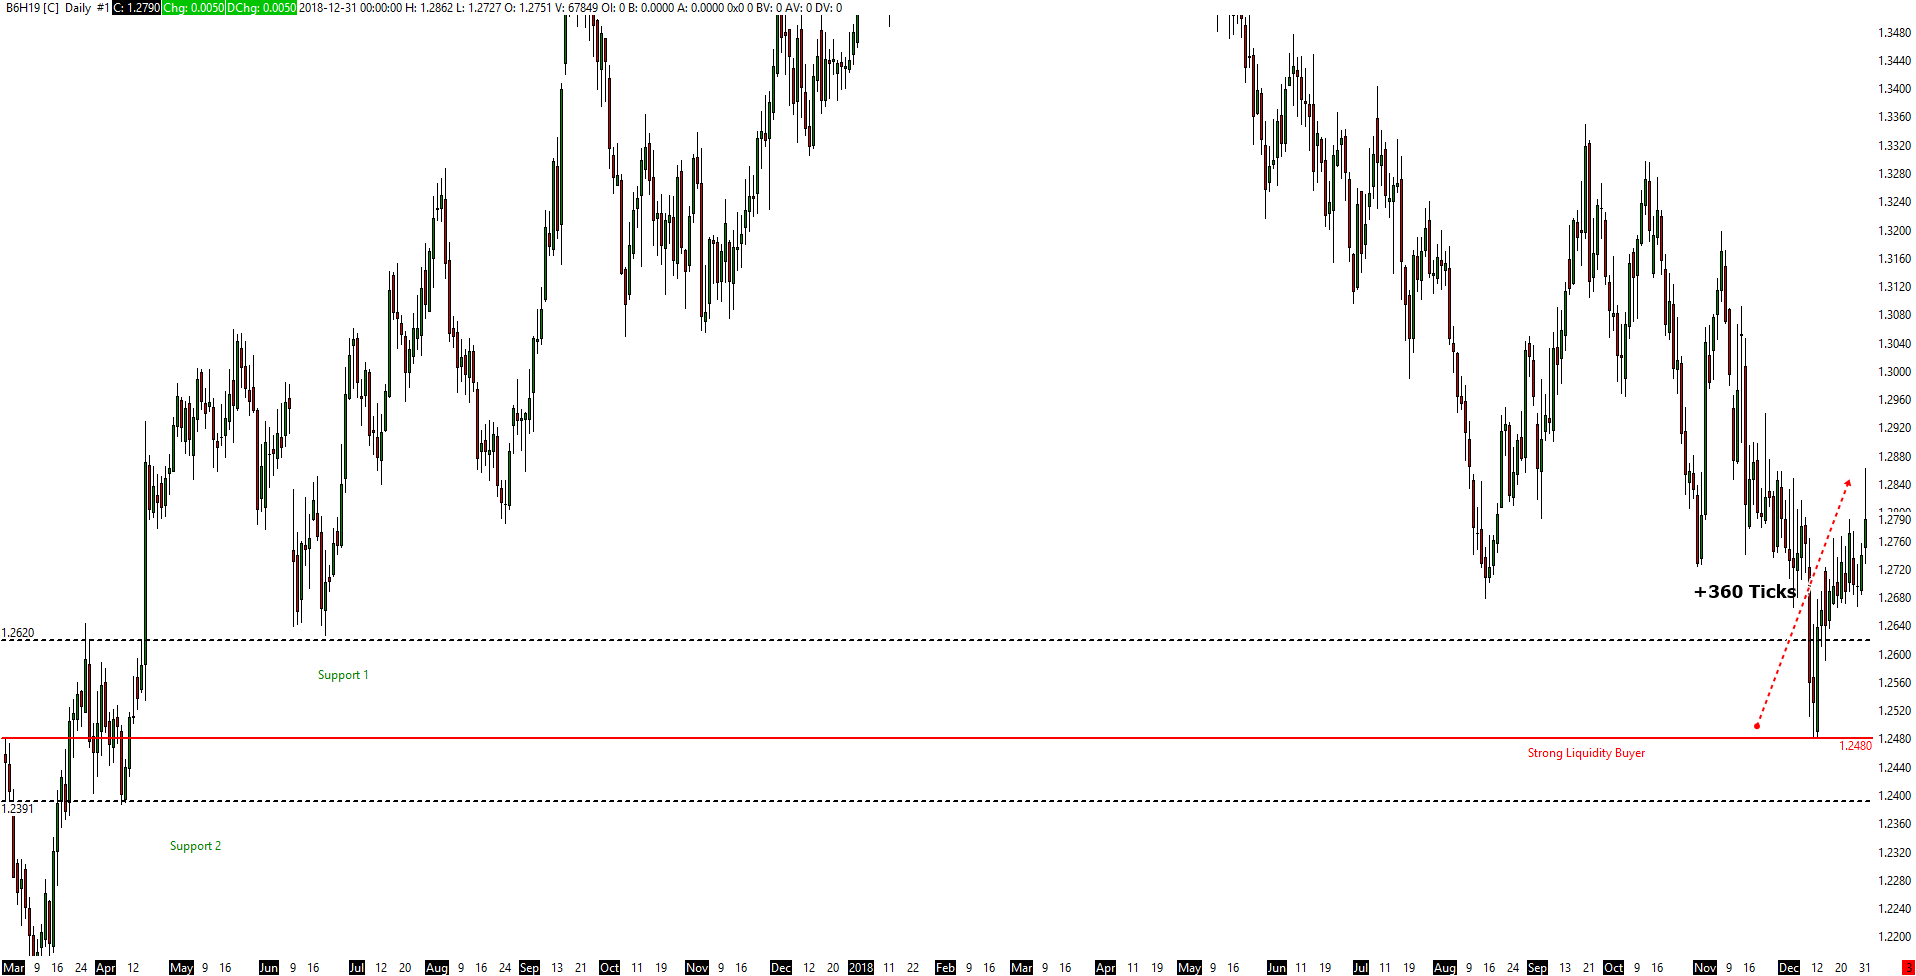
Figure 4. A responsive buyer causes the increase in the price by almost 360 ticks
Figure 2 demonstrates how Bookmap shows the liquidity buyers at 1.12480, trying to hold their position as shown in Point (1). At this stage, we can see that the traded volume becomes obviously lower. This indicates less interest of participants in conducting business in this area. Hence the clue that potential for the downside movement has been exhausted.
Figure 3 shows the comparison level between a technical trader and an order flow trader that is using Bookmap. A technical trader may think that Support Level 1 will be held, but the order flow shows that there are no buyers waiting at that price level.
Once Support 1 breaks because of lack of liquidity buyers, the market potential to move down to Support 2 increases. However, they evidence that the buyer is waiting at 1.12480 and trying to defend this level. This causes the market to move by 360 ticks as shown in Figure 4.
As a conclusion, Bookmap has a big advantage in terms of market information and therefore, reduces the risk of a false analysis. A technical trader can improve his/her decision at a specific level such as support and resistance. Perception about support or any other price level often proves to be false if there is lack of information about liquidity buyers and sellers. This proves that Bookmap is very useful in keeping traders well informed.
A scenario where BOOKMAP helps a News Trader to make better decisions
News traders collect and act upon new information on the instrument value. They buy or sell an instrument depending on whether the news is good or bad. The information such as News, Fundamental Data, Breaking News, etc., will be used to predict the price change.
All information is reflected in the market. This has been explained by the efficient market hypothesis which states that asset prices fully reflect all available information. All responses or actions taken by the participants regarding this information can be analyzed with Bookmap. All opinions on the market are converted into trading decisions: sending limit orders and market orders. This crucial information can be recorded and analyzed to produce better decisions. Also, information “noise” can easily be filtered out using Bookmap.
GBP/USD Market Crash, January 3, 2019
On January 3, 2019, Forex market faced a market flash crash after the news about APPL that triggered a response from other markets. Focusing on GBP/USD, we can see that the Flash Crash occurs during the Asian Session where the liquidity of the market is very low. This condition leads to market crash in GBP/USD, when it drops almost 120 pips down within ten seconds with the traded volume being less than 200 lots.
This clearly indicates that the movement is caused by the illiquid market rather than by real sellers. Figure 5 below shows the movement of GBP/USD during the Flash Crash event on the morning of opening of the Asian session about ten seconds before responsive buyers stepped in.
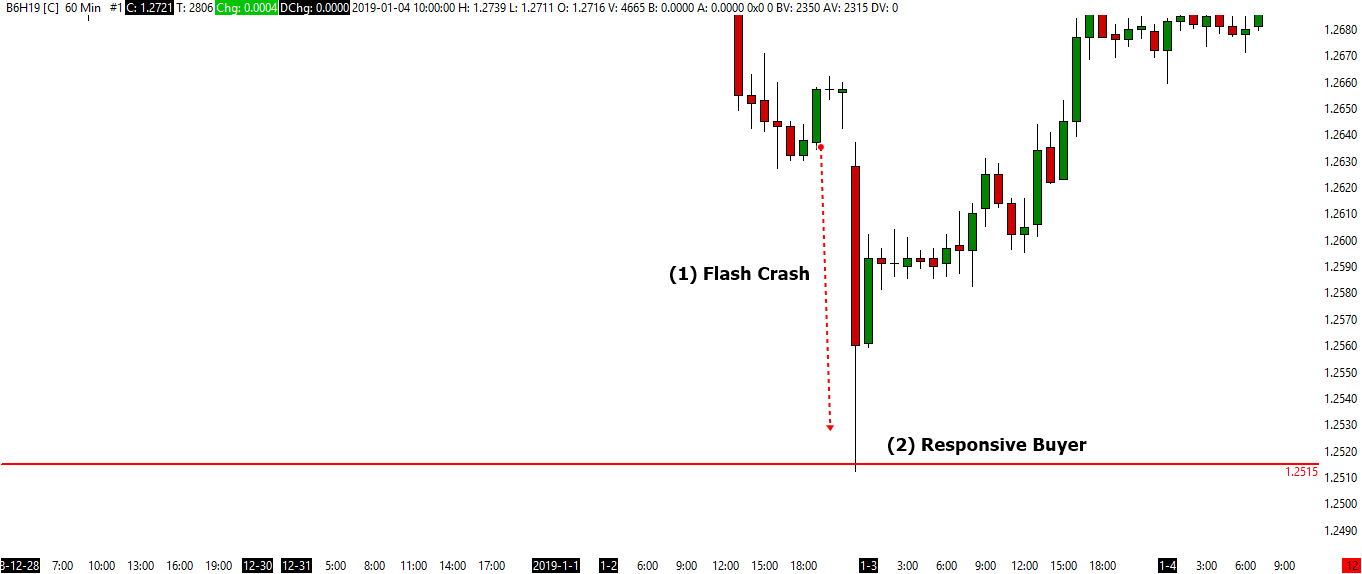
Figure 5: GBPUSD during Flash Crash on January 3, 2019
By looking at normal charts, news traders may have no idea what the cause of the movement was and how large it can be. Bookmap provides great advantage as it shows the response and condition during the event. By analyzing the data visualization from Bookmap, traders can understand the mechanics of any event that occurs on the market.
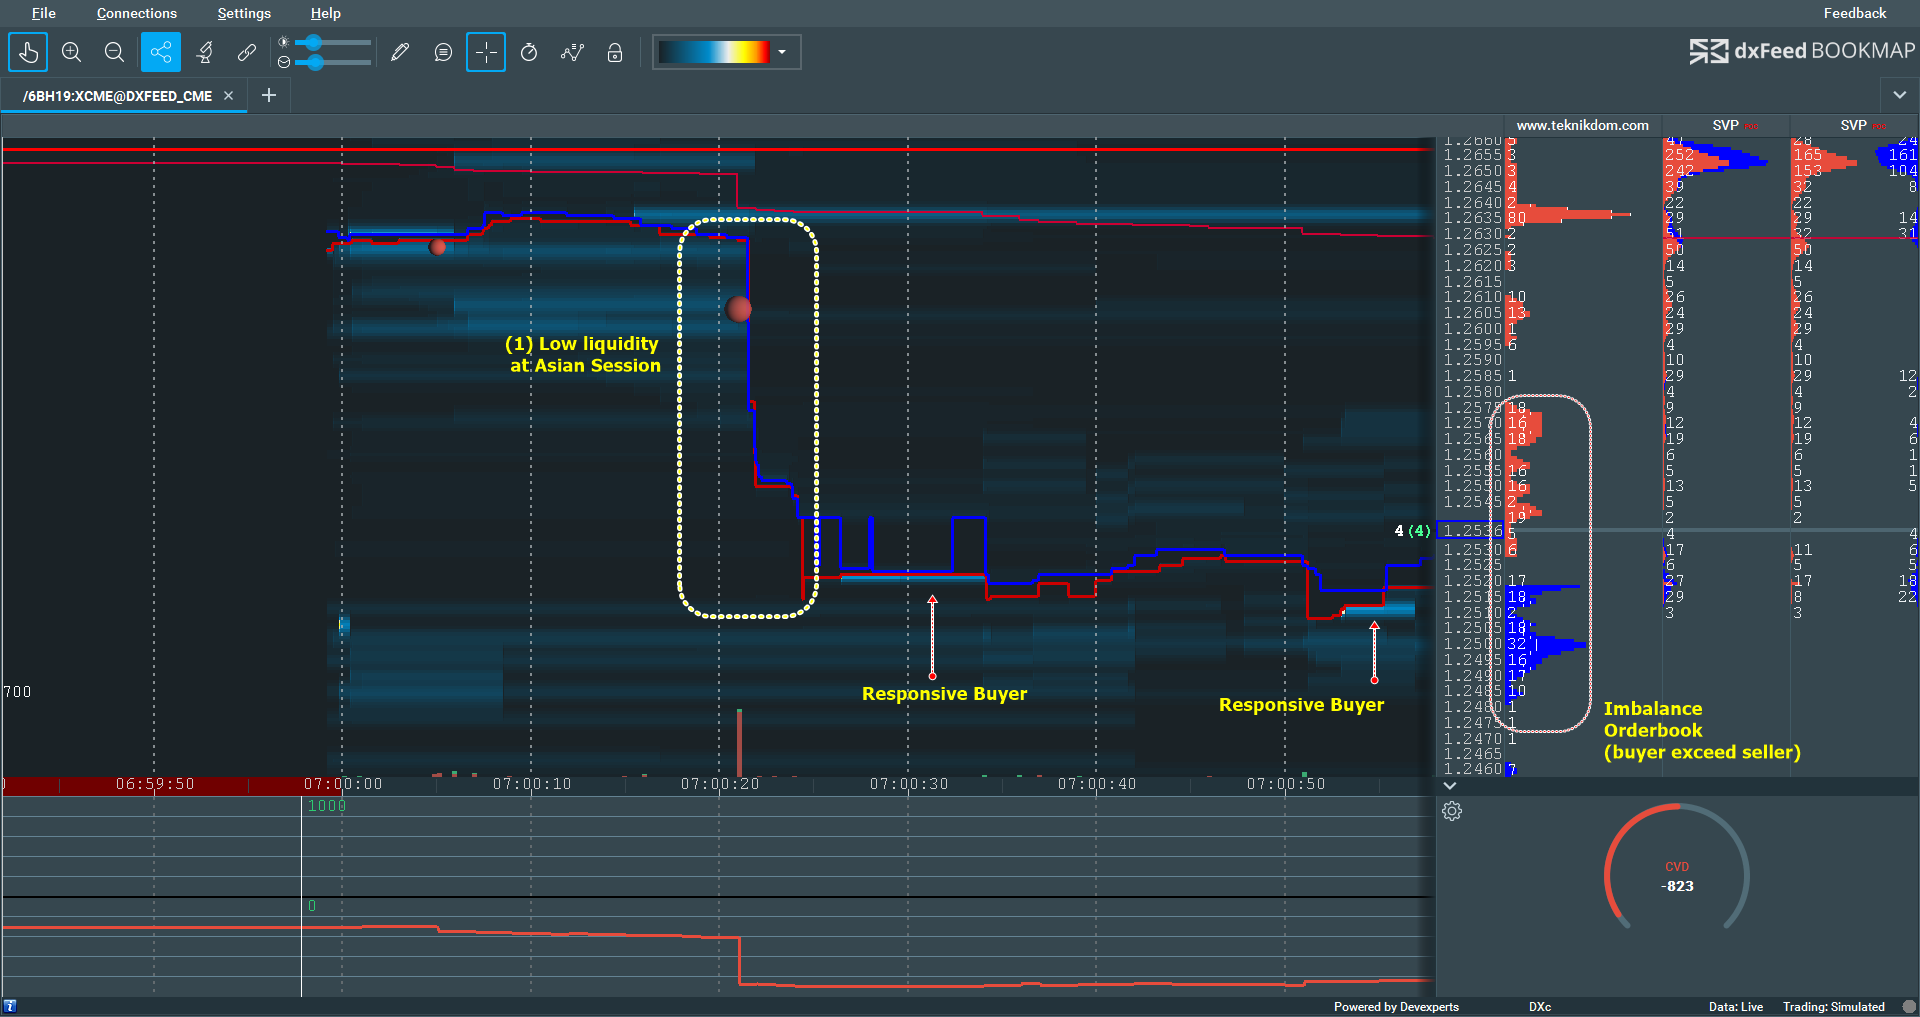
Figure 6. GBP/USD during the Flash Crash of January 3, 2019
Figure 6 shows how the market can go wild during the illiquid market at the Asian session. After opening in Asia, the Flash Crash occurs in less than ten seconds. Volume and liquidity are very low, which indicates that the movement is caused by rapid market orders, and stop-loss traders may hit the market. Then responsive traders stepped in with large limit orders of around 100 lots. This indicates interest from buyers. The order book also shows an imbalance where aggressive buyers start to auction higher.
This condition cannot be seen by technical traders if they rely on candlesticks and public information rather than the real activity on the market.
Thus, we may conclude that Bookmap is really a game changer for news traders because it gives access to all information that enters the market. It reduces the risk and increases the odds for staying on the right side of the game.
Author: Norabidin Basiran (Don Malaya)
Contact him: