See market activity more clearly in real time.
Compare plans to access deeper market visibility for market activity.
Education
March 5, 2025
SHARE
How This Tool Can Change How You Trade: A Deep Dive into Order Flow & Liquidity Analysis
Every trader wants an edge in the market—a way to see beyond just price action and better anticipate market moves. While traditional charts show past price movements, they don’t reveal the hidden liquidity, trapped traders, or the true battle between buyers and sellers.
That’s where Bookmap’s order flow and liquidity tools come in. By providing real-time market depth, traders can make better-informed decisions based on actual supply and demand, not just candlestick patterns.
What You’ll Learn in This Guide
- How to use heatmaps, stops & iceberg orders, and volume profiles to refine trade execution.
- Why tracking liquidity zones is critical for precision entries and exits.
- How Bookmap helps traders identify hidden risks and opportunities in real time.
📌 Want to see this in action? Compare Bookmap Plans Here
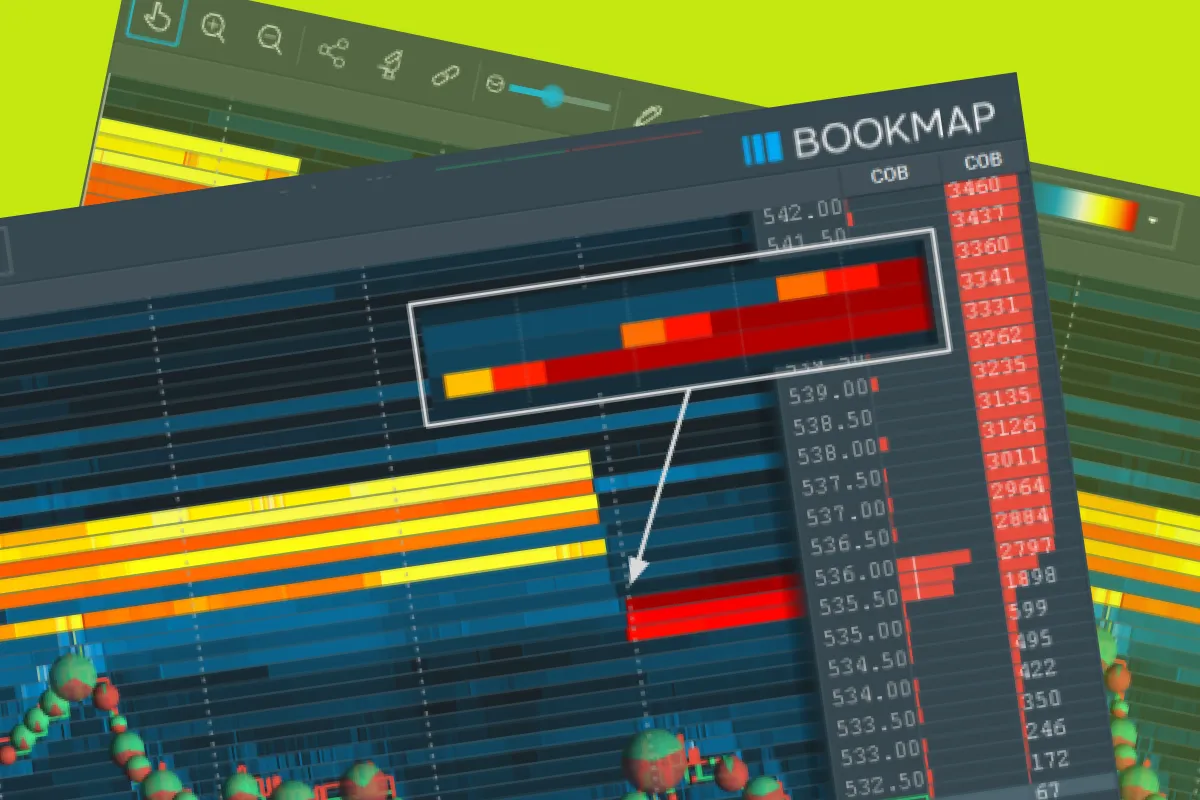
Seeing the Market Differently with the Liquidity Heatmap

Traditional charts only show price movement but fail to display where market participants are positioning their orders. This missing information can lead to poorly timed trades and unexpected reversals.
How the Liquidity Heatmap Works
- Bright areas represent high liquidity, showing where large buy and sell orders are stacked.
- Darker areas indicate low liquidity, where price can move with less resistance.
- Traders use the heatmap to anticipate support and resistance levels before price reacts to them.
Why It Matters
Instead of relying on lagging indicators or static price charts, the heatmap provides a real-time view of order flow, allowing traders to adjust their strategies dynamically.
Example:
A trader identifies strong bid liquidity resting at $3,200 on the S&P 500 Futures (ES). Instead of entering a trade randomly, they wait for buyers to absorb that level before executing, reducing risk and improving trade timing.
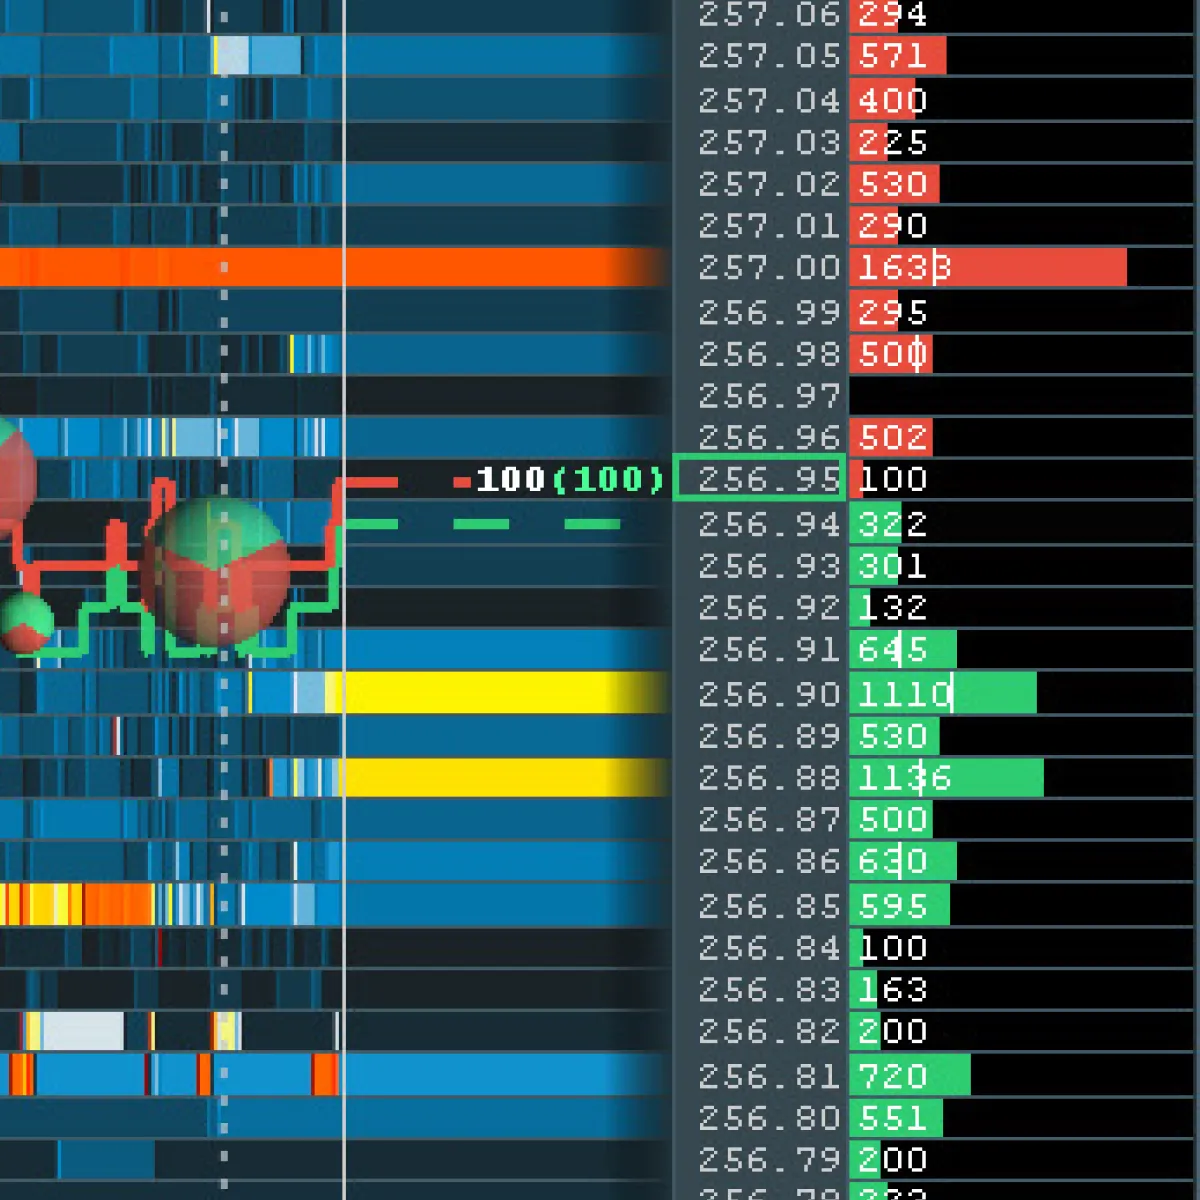
Stops & Icebergs: Understanding Market Dynamics

Stops and iceberg orders provide insights into who is in control—buyers or sellers—and how price is likely to react.
Stop Orders and Their Impact
- Stop orders trigger when price reaches a certain level, often leading to sudden price surges.
- Large clusters of stops can result in fake breakouts or accelerated momentum moves.
Iceberg Orders: Hidden Institutional Activity
- Iceberg orders are large orders broken into smaller pieces to avoid detection.
- Institutions use icebergs to accumulate or distribute positions without revealing their full intent.
Example:
A trader spots an iceberg absorbing heavy selling pressure at $1,500 on a stock. Instead of shorting into a breakdown, they recognize that large buyers are stepping in, signaling a potential reversal.
Volume Profiles: Confirming Trade Setups with Data
Volume profiles help traders understand where market participants are most active and identify areas of strong support and resistance.
Key Concepts of Volume Profiles
- High Volume Nodes (HVN): Price tends to consolidate here, acting as strong support or resistance.
- Low Volume Nodes (LVN): Price tends to move quickly through these areas with little friction.
- Delta Profiles: Show whether buyers or sellers are in control at specific price levels.
Using Volume Profiles for Smarter Trades
By analyzing how volume is distributed, traders can refine their entries and exits, ensuring they are not stepping into weak trade setups.
Example:
A trader sees strong buying activity at a major low-volume node. Instead of entering blindly, they wait for additional confirmation from liquidity and order flow to time their trade effectively.
Putting It All Together: A Data-Driven Approach to Trading
Bookmap’s tools provide a holistic view of market structure, giving traders a real-time edge by integrating liquidity, order flow, and volume dynamics into their strategy.
How to Apply This to Your Trading
- Use the heatmap to identify real support and resistance levels.
- Watch stops and iceberg orders to understand where large traders are positioning.
- Confirm trades using volume profiles to avoid false breakouts or breakdowns.
Instead of reacting to price action alone, traders using Bookmap can anticipate where the market is likely to turn and position themselves accordingly.
📌 See how Bookmap’s tools can improve your trading decisions. Compare Plans Here.
Sign Up Now