See order flow more clearly in real time.
Compare plans to access deeper market visibility for order flow.
Education
May 19, 2025
SHARE
How to Spot Trend Reversals Early Using Order Flow Analysis
 Trying to catch a trend reversal without order flow is like skydiving blindfolded! Not only is it reckless, but it is also bound to end badly. In trading, timing a reversal isn’t just about spotting fancy chart patterns! Instead, it is about understanding what’s happening under the hood. That’s where order flow starts to matter. By tracking how volume shifts, where liquidity pools form, and when aggressive buyers or sellers enter the market, you move from guessing to knowing.
So, do you want to master reversal trading with order flow? In this article, you will learn how to spot trend reversals using our real-time market analysis tool, Bookmap. Also, you will understand common order flow trend change signals. Read this article till the end to trade confidently and make better trade entries.
What Reversal Trading Really Looks Like with Order Flow
In reversal trading, you enter a trade right when a current trend is about to change direction. For example,
- Suppose the market has been moving up.
- Now, you, as a trader, practice reversal trading.
- You try to catch the moment the market starts to move down (or vice versa).
- Your goal is to spot this turning point early enough to benefit from the new trend.
Now, this sounds simple, but spotting trend reversals isn’t easy! To detect reversals precisely, many traders look for familiar chart patterns. Check out the graphic below:
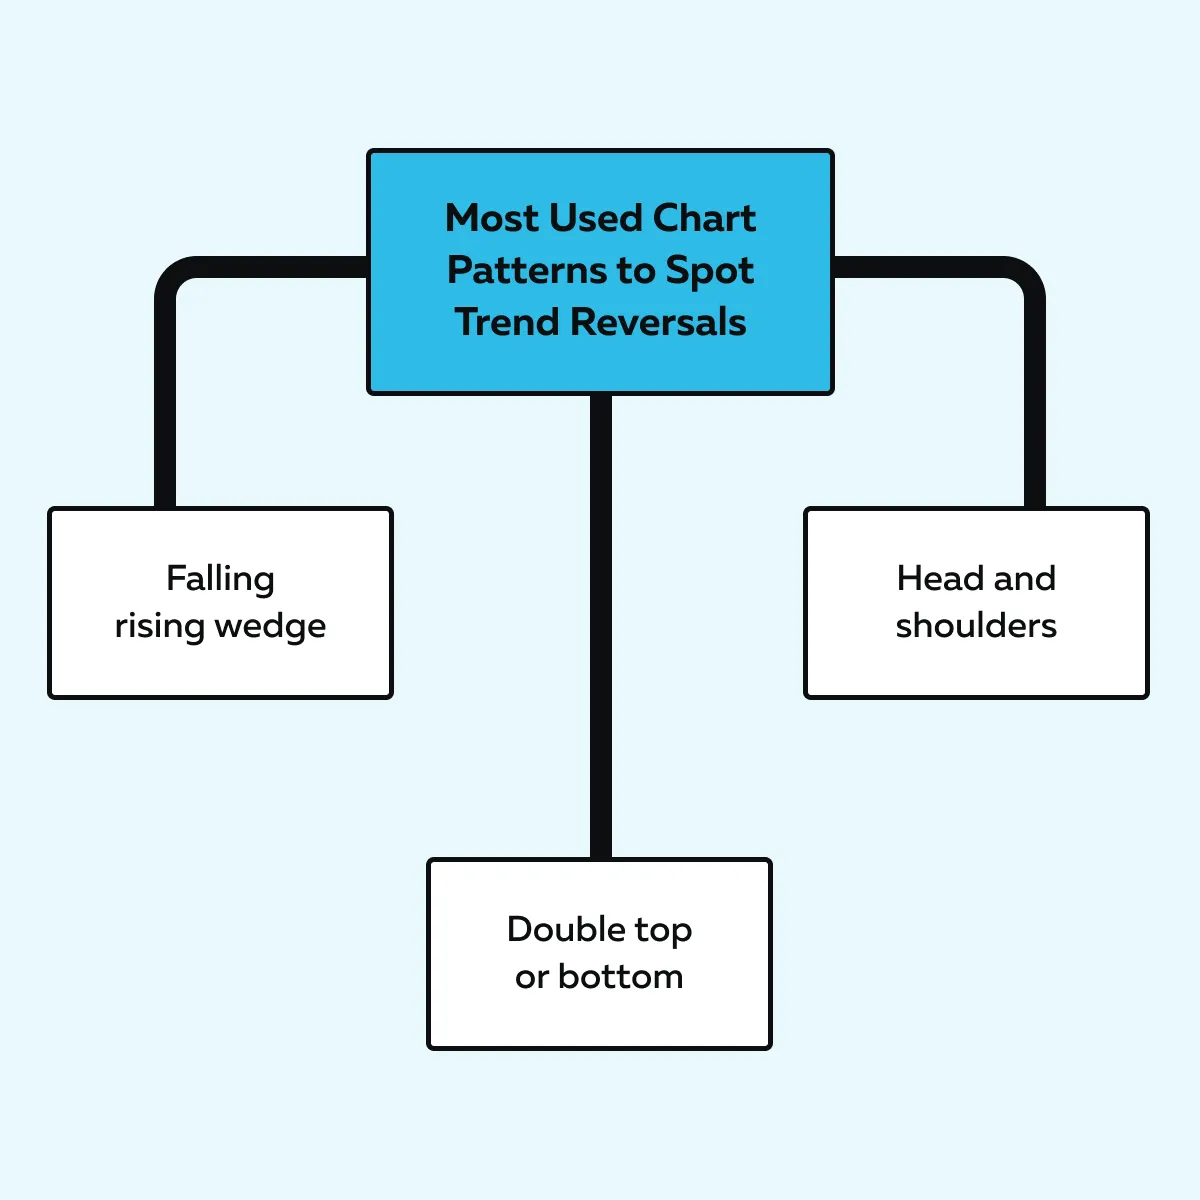
These patterns suggest the price might reverse soon. However, they are not always reliable on their own! This is where order flow comes into play. Order flow gives you a real-time look at what’s happening behind the candles, such as:
- How many buyers or sellers are active?
- Where are the large orders sitting?
- How much volume is being traded at certain prices?
How do we track order flow?
You can start using our advanced market analysis tool, Bookmap. Using it, you can visualize order flow. Instead of just looking at a price chart, you can see:
- Liquidity levels,
- Volume spikes,
- Aggressive buying or selling behavior.
This data allows you to understand order flow trend change signals. Through our tool, Bookmap, you can see that buying pressure is weakening, and selling is taking over (or vice versa).
Let’s understand better through an example:
- Suppose on our tool, Bookmap, you observed that:
- Price is rising,
but
- Buying volume is dropping.
-
- These are signs that buyers are losing strength.
- You see liquidity (big resting orders) suddenly pulled from one side of the market.
- This event signals hesitation or a likely reversal.
- Additionally, if aggressive sellers suddenly take control even while the price is still near the highs, that’s another red flag.
This way, you can better time your entry by watching how volume and liquidity behave (particularly around key levels).
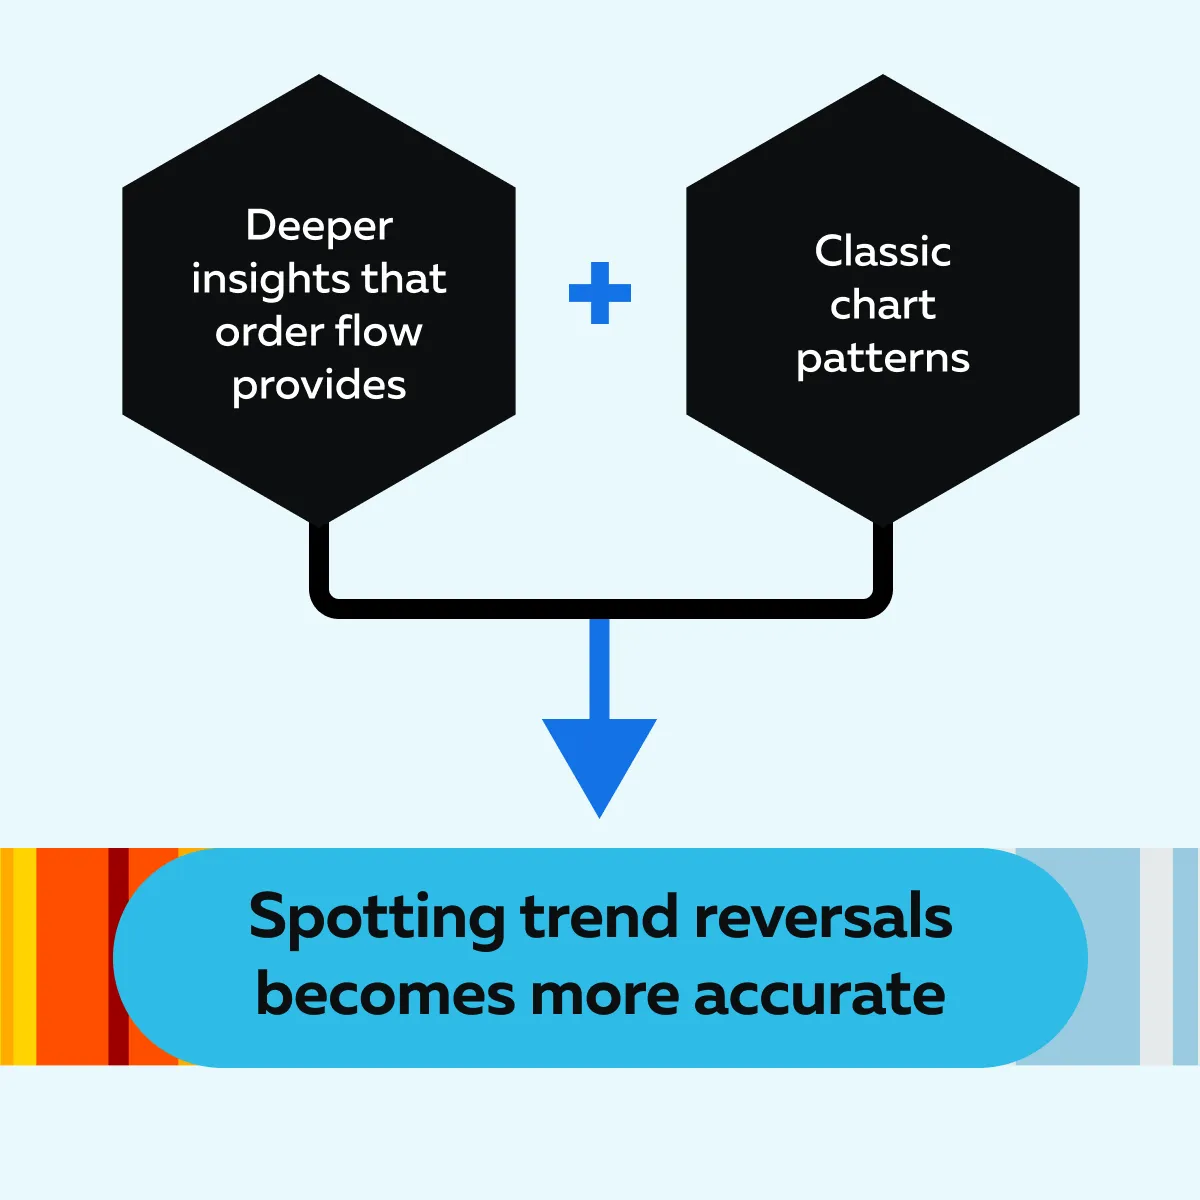
The Essence of Reversal Trading
Always remember that you should never guess based on patterns! Instead, you must confirm those patterns with real-time data (which shows how market participants are behaving). Check out the graphic below for more clarity:
Improve your trade timing using real-time order flow analysis—start using Bookmap today.
The Anatomy of a Reversal: What to Watch for in Order Flow
To understand how reversal trading with order flow works, you must divide market behavior into clear phases. One of the best ways to do this is by using an inverse head and shoulders pattern. For the unaware, it is a classic structure that often marks major trend reversals.
Let’s check out the five distinct phases you can look at while spotting trend reversals through our Bookmap:
1. Trending Move into a Higher-Timeframe Level
Please note that every reversal begins with a trend (usually a downtrend). But for that trend to be ripe for a reversal, it needs to:
- Run into an area of higher-timeframe support,
or
- Hit a completed Average True Range (ATR) for the session.
When this happens, the market has moved far enough to exhaust itself. As this downtrend occurs, you’ll usually see sellers (aggressors) hammering into high bid-side liquidity on our tool, Bookmap. That liquidity shows up as large zones of pending buy orders.
But here’s the key! Even though sellers are active, price starts to slow down. This event is one of the earliest order flow trend change signals! In this phase, aggression remains high, but it’s no longer affecting the price.
2. Absorption Begins and the Downtrend Flattens
This is where absorption comes into play. High-bid liquidity doesn’t just exist passively! Instead, it begins to absorb those aggressive sell orders. On our Bookmap, you’ll notice large volume dots (often red) that don’t push prices much lower. This is indicative of selling pressure being met with strong passive buying.
Then comes the shift! Buyers begin to appear – not in overwhelming numbers yet, but enough to balance out the volume. And importantly, the angle of the downtrend flattens.
This phase signals that the:
- One-sided momentum is weakening,
and
- The battle between buyers and sellers is evening out.
3. The Final Push – The “Head” Forms
Now comes what looks like one last gasp from the sellers. The price pushes slightly lower than the previous swing (the left shoulder). This move forms the “head” in the inverse head and shoulders pattern.
But this time, something’s different! This push goes straight into another pocket of high-bid liquidity. As a result, instead of a clean breakdown, you’ll notice aggressive buyers step in right after the liquidity transacts.
On our Bookmap, this shows up as:
- Larger green volume dots,
and
- Thick volume bars.
These signs indicate that buyer activity is increasing in intensity. Please note that this is the tipping point. Here, many experienced traders start spotting trend reversals. That’s because it is no longer just a weak downtrend. Now, buyers are beginning to take control.
4. Right Shoulder and Market Shift
After the “head” forms, the price often pulls back slightly. However, the character of the pullback changes:
- The selling volume is lower,
and
- The structure creates a higher low.
Now, this is your right shoulder. In this phase, you will also see new bid-side liquidity appear higher up. This sign signals that passive buyers are stepping in with more confidence. Due to this, the volume footprint becomes more bullish.
And now, we’re seeing a fundamental shift in market momentum from sellers to buyers. Want to gain confirmation? Check out the graphic below to learn how you can do this:
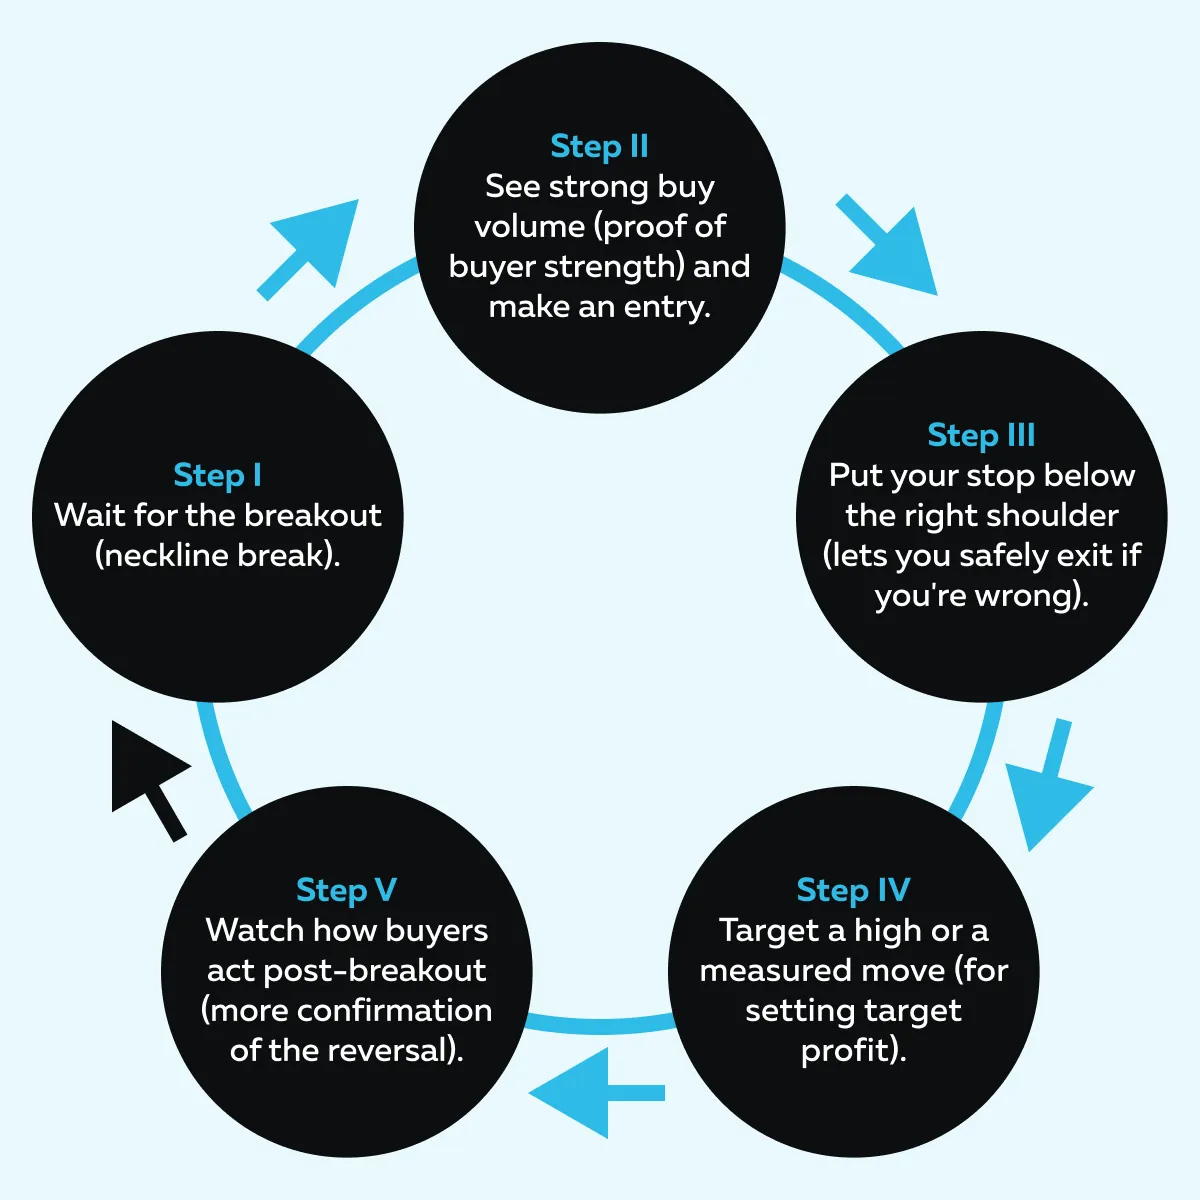
5. Breakout and Entry Consideration
At this point, the pattern is nearly complete! Thus, most traders begin watching for a breakout, which usually comes in the form of a price break above a:
- Minor trendline,
or
- Local swing high.
Now, you should make an entry on the breakout. But only when the buy volume surges. That’s because volume confirms interest. It might be a fake move if the price breaks out, but the volume is low. In contrast, if buy volume surges, it means buyers are stepping in, which is a powerful order flow trend change signal.
Post-entry, you should perform these steps:
A) Place Stop-Loss Orders Just Below the Right Shoulder
Be aware that if the price drops below the right shoulder, the pattern has failed. The right shoulder is a support level in this structure. If it’s broken, the setup is no longer valid. So, ideally, you should place your stop just below the right shoulder.
B) Target the Previous Range High
This point is your first potential profit target. The previous range high is the market’s last high before dropping into the head. This point is a safe place to make a profit. That’s because the price often returns to that level after a reversal.
C) Perform a Measured Move (For Setting a More Aggressive Target)
Alternatively, you can follow the “measured move” technique. It is an advanced (but popular) way to find a bigger profit target. Let’s see how you can do it:
-
- Measure the distance from the head (lowest point) to the neckline (breakout level).
- Now, project that same distance upward from the breakout point.
- This projection gives you a rough idea of how far the price could go if the reversal continues.
- It’s called the measured move.
Want more clarity on order flow trend change signals? Watch this video now!
The Phase 5 Process Flow – At a Glance
To understand better, study this graphic below:
3 Steps for Identifying Reversals Using Order Flow
Reversals don’t happen randomly. They follow a pattern, particularly when seen through order flow. Let’s learn how you can spot trend reversals step-by-step using:
- Volume,
- Liquidity,
- Market structure.
Step 1: Spot the Context
Before a reversal can happen, you need the proper setup. That means the market should be:
- Trending (either up or down),
and
- Approaching a vital level.
Ideally, the trend should move to:
- A higher timeframe support or resistance zone,
- A value area is low or high,
- A completed ATR (Average True Range) target for the session.
For example,
-
- Suppose, during a persistent downtrend, the price sells off hard.
- It reaches an area with high bid liquidity (a zone where big buyers are waiting).
- You might see this on Bookmap as thick horizontal bands under the price.
- That’s the context where a reversal becomes more likely.
This is the first clue that reversal trading with order flow might be worth considering.
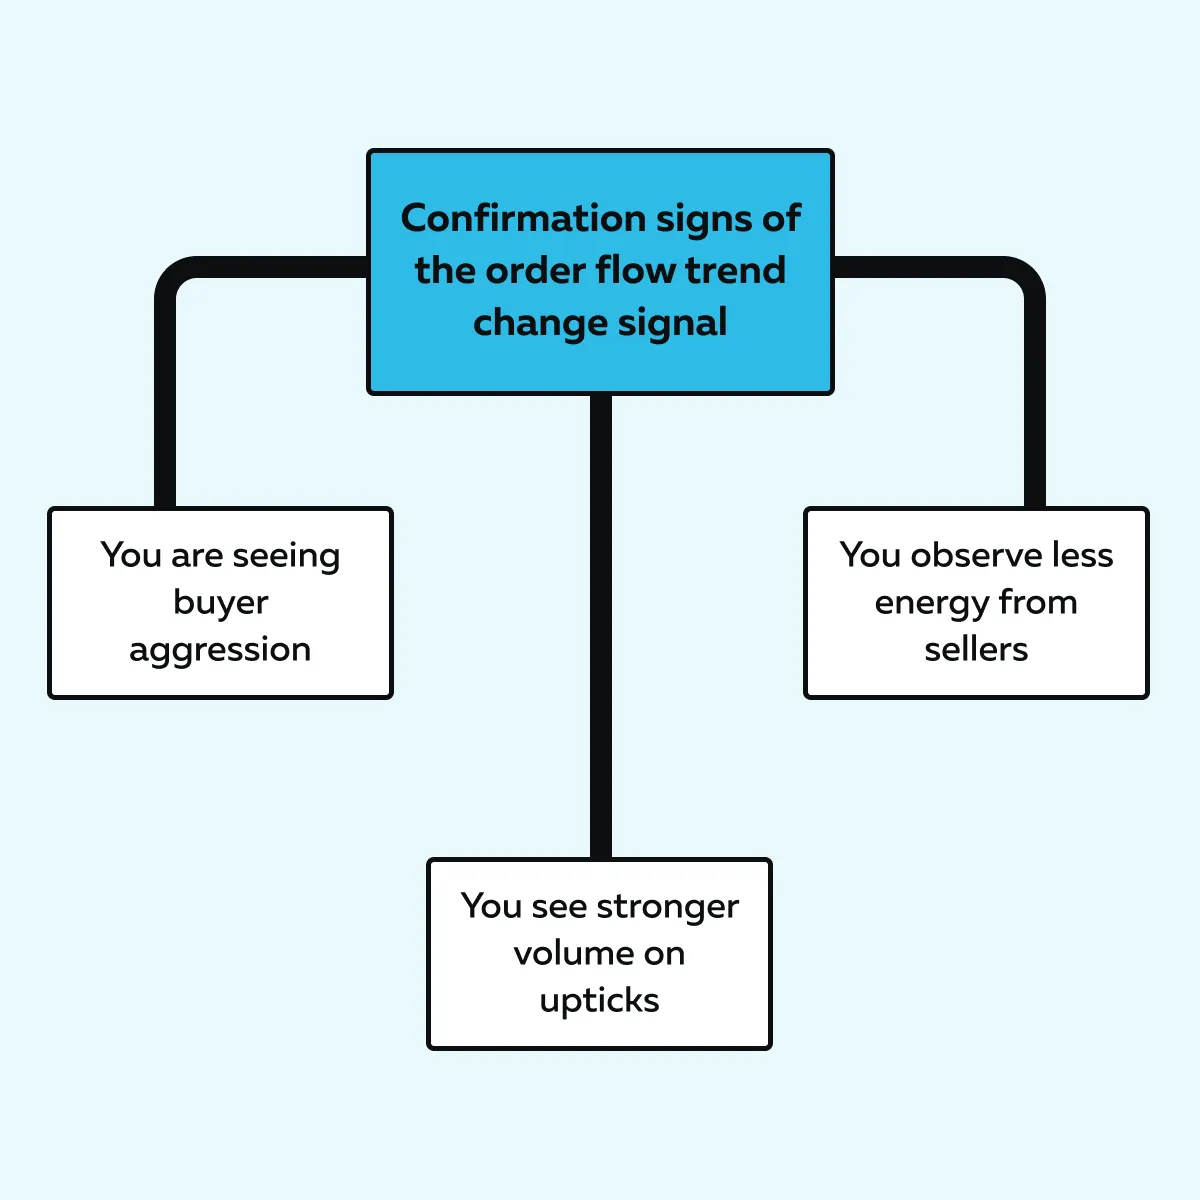
Step 2: Watch the Reaction at Liquidity
Now that the price has reached a key area, what happens at that level tells you a lot. This step is about spotting trend reversals in progress (before the price flips).
Ideally, you should watch for the following:
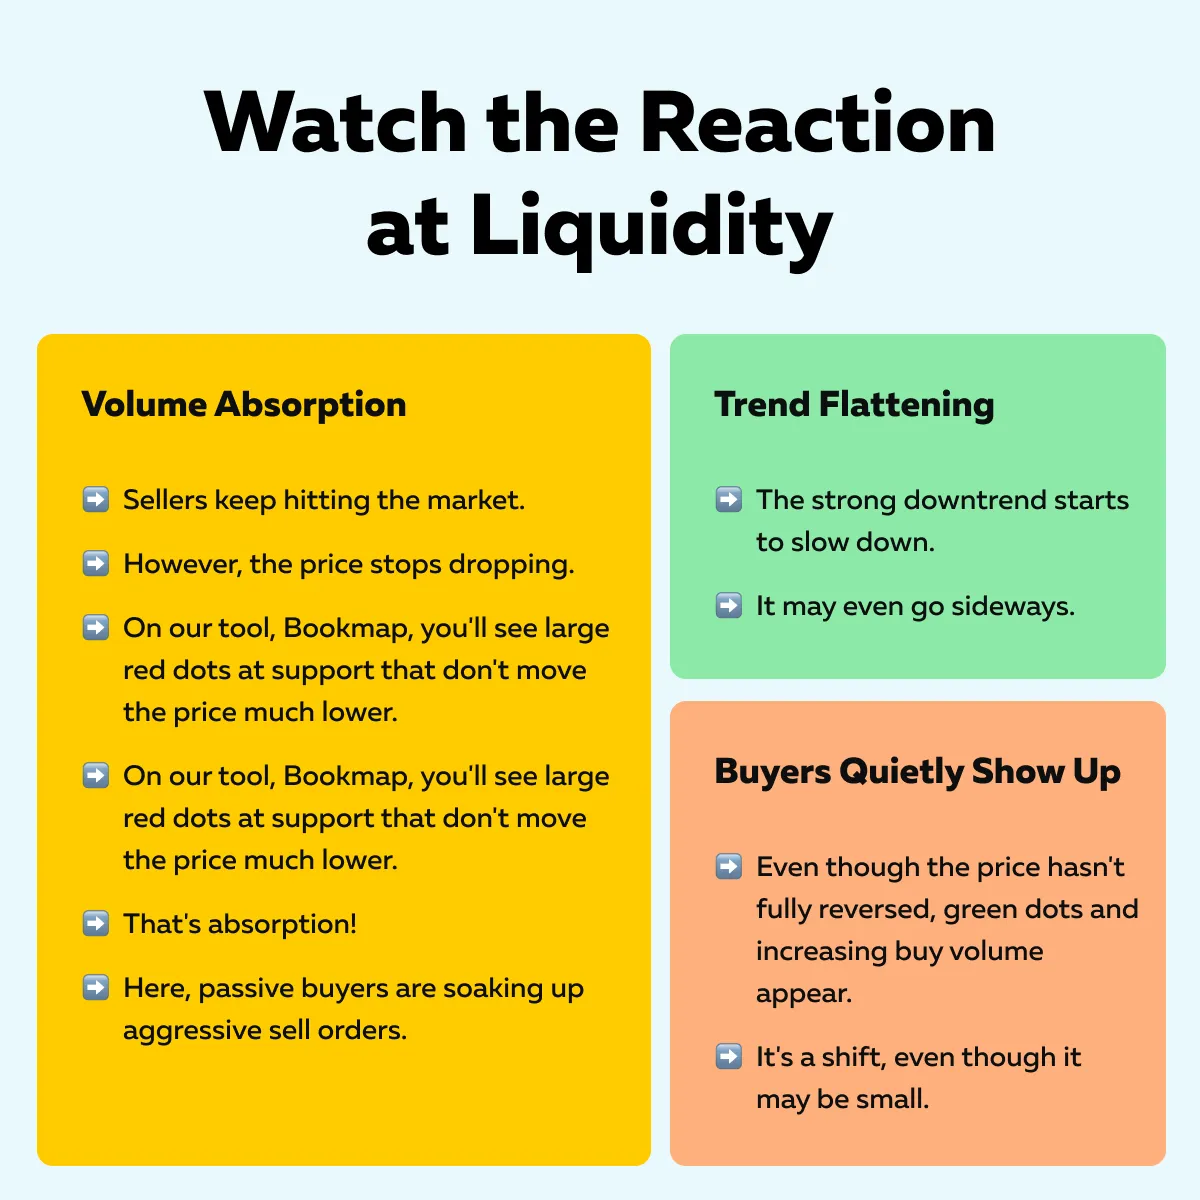
Catch market reversals early by clearly visualizing liquidity shifts with Bookmap.
Step 3: Confirm with Structure and Aggression Shift
Now, you need confirmation that the market is truly turning. You can gain this confirmation by looking for a minor swing structure to break (maybe a small lower high gets broken to the upside).
On that break, watch for a surge in buy volume (bigger green dots and stronger volume bars on our Bookmap). At the same time, bid-side liquidity starts building. This build-up signals that buyers are aggressive and becoming more confident.
This change in both volume and liquidity behavior shows that the market is shifting. It’s a clear order flow trend change signal and likely the start of a trend reversal.
Mistakes Traders Make in Reversal Setups
Reversal trades can let you earn substantial profits. However, many traders mess them up by:
- Jumping in too early,
or
- Ignoring key order flow clues.
Below are some common mistakes and how to avoid them:
Anticipating Too Early
One of the most common mistakes in reversal trading is trying to predict the turn before it starts. A trader might think, “This is the bottom,” and enter on hope alone! However, the price keeps falling.
Let’s understand what goes wrong in this approach:
- They don’t wait for volume absorption (where large passive buyers are soaking up aggressive sellers).
- They don’t wait for the buy volume to show up.
- They depend on guesswork instead of watching for signs of a trend change in the order flow.
Pro Tip
Let the pattern complete! Wait for the complete formation of a chart pattern (like an inverse head and shoulders), or at least wait until buyers start entering aggressively. In our tool, Bookmap, buyer entry is depicted by larger green dots and stronger volume bars. That’s your sign!
Ignoring Liquidity Behavior
Another big mistake is that traders focus only on price levels (like support/resistance). They ignore whether actual orders are sitting there. Please realize that just because a chart says “support” doesn’t mean buyers will appear there.
If there’s no real liquidity on the bid, the price might blow through that support like it’s not even there. Thus, you should always use our tool, Bookmap, to see whether there’s meaningful bid-side interest (big resting orders that could absorb selling).
Without understanding how liquidity behaves, you’re trading blind. To spot trend reversals, you must see where the big players place their bets.
Using Price Alone Without Volume Context
Many traders rely purely on chart patterns (like double bottoms or head and shoulders). They ignore what the volume is saying. Be aware that patterns without volume confirmation are weak. If there’s no shift in aggression, the reversal won’t hold.
What to do instead?
Use our Bookmap to check:
- Are buyers stepping in?
- Are sellers being absorbed at support?
- Are buyers aggressive on breakouts?
These are the order flow trend change signals that make patterns meaningful. Always remember that price action only tells part of the story. Volume and liquidity complete the picture!
Reversal Doesn’t Mean One-and-Done: Managing the Trade
Many traders think the market will shoot up or down nonstop once a reversal begins. That’s rarely true! You must understand that reversals often happen in phases:
- A breakout followed by a pullback,
- Some sideways chop before the next move,
- Maybe even a retest of the original level.
Follow these tips for more innovative trade management-
- Don’t panic on the first pullback. If support holds and buy volume stays strong, it might be a chance to scale in again.
- Use discretion, as some reversals turn into continuation trades. This especially happens if buyers keep dominating the order flow.
- Remain flexible and watch how liquidity and volume behave after the entry.
Conclusion
Reversal trading is profitable only if you can spot reversals early and accurately. It is vital to recognize when market sentiment is shifting. And that’s where order flow becomes highly important.
You can track it through our modern real-time analysis tool, Bookmap. Using it, you can see real-time volume, liquidity, and aggression. These insights make it easier to confirm when a trend is about to reverse.
With our Bookmap, you don’t just guess! Instead, you’ll trade based on what the market does beneath the surface. Want to master reversal trades? Dive deeper into advanced techniques at Bookmap’s Learning Center.
Sign Up Now