


See market activity more clearly in real time.
Compare plans to access deeper market visibility for market activity.
Trading Basics
March 5, 2026
Updated
How to Trade the Opening Bell Like a Pro: A Step-by-Step Guide
Table of Contents
- Why the Opening Bell Is Different
- Pre-Market Preparation
- Momentum Trading Strategy at the Open
- Step-by-Step Opening Bell Strategy
- Identifying Trend Exhaustion Points
- Using Technical Confirmation
- Managing Risk During the Open
- Frequently Asked Questions
The opening bell is one of the most volatile moments of the trading day. Prices move fast, liquidity shifts quickly, and traders who aren’t prepared often find themselves caught in whipsaws, stop runs, or rapid reversals.
While this speed can make trading the open difficult, professional traders—including institutions—use structured strategies to navigate the first few minutes with a clear plan.
In this guide, we’ll cover:
✔ How to identify key liquidity levels before the open
✔ Step-by-step strategies to trade the first 15–30 minutes with confidence
✔ How Bookmap’s order flow tools help traders avoid getting trapped
📌 Want to see live order flow during market opens? Compare Bookmap Plans Here
Understanding the Opening Bell: The Chaos and Opportunity
The opening bell is one of the most active periods of every trading session because overnight information is immediately reflected in market prices. Institutions, hedge funds, market makers, algorithms, and retail traders all interact within a relatively short period, creating significant movement in both price and liquidity.
Unlike quieter periods later in the day, the opening session frequently produces:
- increased volatility
- wider bid-ask spreads
- rapid changes in liquidity
- elevated trading volume
- strong directional moves—or equally sharp reversals
Rather than treating this volatility as random, experienced traders focus on how liquidity develops during the opening auction and whether aggressive buying or selling is being absorbed or accepted by the market.
What Drives Market Behavior at the Open?
- Pre-market positioning → Traders adjusting overnight positions at the open.
- Market orders flooding in → Stop-losses and retail orders executing instantly.
- Institutional order execution → Large players using liquidity for efficient entry/exit.
How Retail Traders Can Benefit
By focusing on order flow and liquidity analysis, traders can identify high-probability zones before the open, rather than reacting emotionally once the market is live.
Momentum Trading Strategy During the Opening Bell
Many opening bell traders use momentum trading strategies because the highest trading volume of the day frequently occurs during the first thirty minutes.
Rather than buying simply because price is moving, momentum traders attempt to determine whether strong participation is actually supporting the move.
High-quality momentum often includes:
- expanding traded volume
- liquidity supporting price advances
- higher highs with continued buying participation
- aggressive execution maintaining control
Weak momentum frequently appears when price continues moving while participation begins slowing or liquidity starts shifting against the move.
Bookmap helps visualize these differences by showing both executed trades and the liquidity supporting those moves instead of relying solely on price action.
Pre-Market Preparation: Identifying Key Liquidity Zones
Preparation before the opening bell often determines whether traders spend the session reacting emotionally or executing a structured plan.
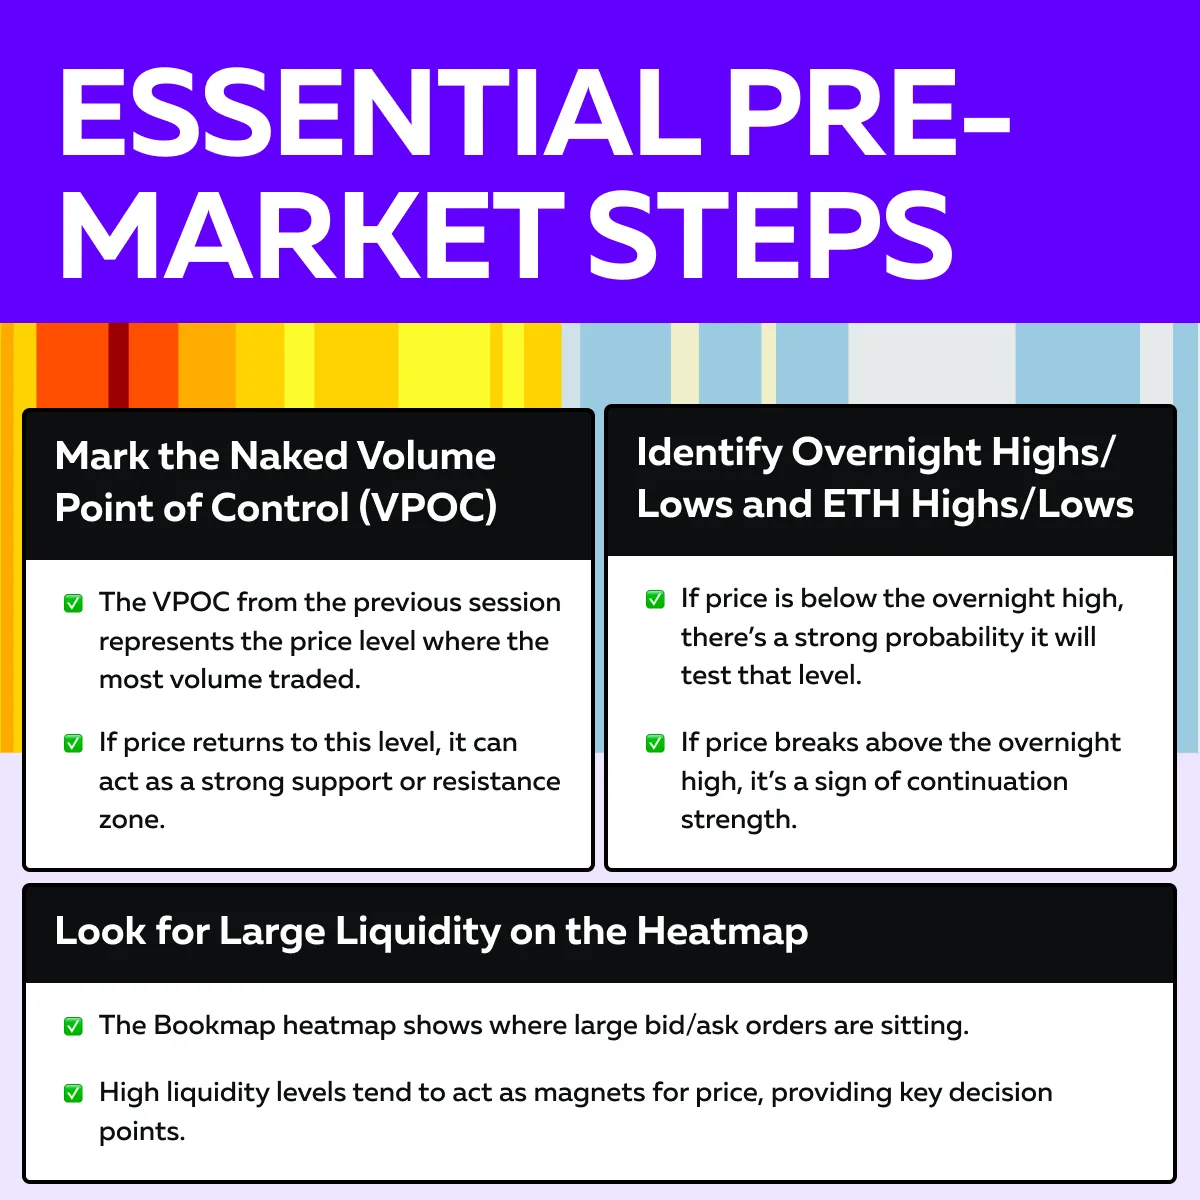
Before markets open, many professional traders identify important reference levels including:
- overnight highs and lows
- previous day’s high and low
- overnight liquidity concentrations
- major support and resistance
- scheduled economic events
Rather than predicting direction, this preparation creates multiple scenarios that can be evaluated once real-time order flow begins developing.
📌 Example:
Before the open, a trader notices a large bid order at $3,900 and a major resistance at $4,000. Instead of blindly trading the open, they plan to wait for price to test one of these levels and observe how liquidity behaves.
One of the biggest mistakes during the opening bell is assuming every strong move will continue indefinitely.
Momentum often begins weakening before price visibly reverses.
Common signs of trend exhaustion include:
- aggressive buying producing smaller price advances
- large sell liquidity appearing above price
- repeated failures to extend new highs
- increasing absorption near resistance
- decreasing participation despite continued movement
Likewise, bearish trends often weaken when aggressive selling produces diminishing downward progress while buyers begin absorbing available liquidity.
Recognizing exhaustion helps traders avoid chasing moves after much of the opportunity has already occurred.
Step-by-Step Strategy: Trading the First Minutes with Confidence
Rather than attempting to predict market direction immediately after the opening bell, many professional traders wait for evidence confirming who is actually controlling liquidity.
The following process emphasizes observation before execution.
1. Watch for Liquidity Absorption
Liquidity absorption occurs when large buy or sell orders hold price steady despite aggressive orders hitting the tape.
📌 What to Look For in Bookmap:
✔ Large buy liquidity holding firm at a key support level → Possible long setup.
✔ Large sell liquidity staying intact at resistance → Possible short setup.
Example:
Before the market opens, Bookmap shows large resting bids at $3,800. Price quickly dips into that area at the open, and sellers fail to push lower. Buyers start stepping in aggressively—this is a sign of absorption, and price is likely to bounce.
2. Identify Stop Sweeps and Reversals
The open is prime time for stop runs—market makers and institutions push price through stop levels to trap retail traders.
📌 How to Spot a Stop Run in Bookmap:
✔ Large red volume spike on a breakdown, but no follow-through → Possible reversal.
✔ Sudden price spike past liquidity followed by a sharp pullback → Stop hunt.
Example:
A trader sees price breaking below the previous day’s low, triggering stop-losses. However, price immediately snaps back up, indicating sell liquidity was absorbed by a large buyer. This is a high-probability reversal opportunity.
3. Use Volume Point of Control (VPOC) Migration to Confirm Trend Direction
The Volume Point of Control (VPOC) represents the price where the most trading volume occurs during the session.
✔ If the VPOC shifts higher, buyers are in control → Look for long setups.
✔ If the VPOC shifts lower, sellers dominate → Favor short setups.
📌 Example:
At the open, the VPOC starts migrating higher as aggressive buyers step in. This signals a bullish move, providing confirmation for long trades targeting key resistance levels.
Using Technical Confirmation Alongside Order Flow
Order flow provides valuable insight into market participation, but many traders combine it with broader technical analysis when evaluating opening trades.
Common confirmation tools include:
RSI and MACD Crossover Analysis
Momentum oscillators like the Relative Strength Index (RSI) and Moving Average Convergence Divergence (MACD) can help identify whether momentum is strengthening or weakening after the opening move.
Rather than generating entries by themselves, many traders use these indicators as secondary confirmation alongside liquidity behavior.
Monitoring Volatility Breakouts
Periods of expanding volatility frequently accompany strong opening trends.
Instead of assuming every breakout will continue, traders evaluate whether increasing volatility is supported by sustained buying or selling participation visible through order flow.
When price breaks above resistance without corresponding participation, failed breakouts become increasingly likely.
Managing Risk: Trading Open Setups with Proper Execution

Managing risk during the opening bell is often more important than identifying the perfect entry.
Because volatility can change dramatically within seconds, traders frequently reduce position size during the first few minutes while waiting for clearer confirmation.
Effective opening risk management typically includes:
- predefined maximum loss
- smaller initial position sizing
- waiting for liquidity confirmation
- avoiding emotional entries after large moves
Because the open is volatile, traders must:
✔ Size appropriately – Avoid large positions until a clear trend emerges.
✔ Set predefined risk levels – Use order flow to refine stop placement.
✔ Wait for confirmation – Don’t jump in without evidence of absorption, sweeps, or volume shifts.
📌 Example:
A trader plans a long trade near the overnight low, but instead of entering immediately, they wait for liquidity absorption at that level. Once buyers confirm control, they enter with a stop-loss just below the low, reducing risk exposure.
Opening Bell Trading Requires Flexibility
Every opening session develops differently.
Some mornings produce strong directional trends immediately after the opening auction, while others spend considerable time rotating around overnight value before eventually breaking higher or lower.
Rather than forcing trades every morning, experienced traders adapt their expectations to current market conditions.
The ability to remain patient until order flow confirms participation often produces more consistent results than attempting to predict the opening move.
Conclusion
Trading the open is not about prediction—it’s about probability and execution. The key to success is understanding liquidity, absorption, and market mechanics instead of relying on lagging indicators.
Key Takeaways for Trading the Open
✔ Identify major liquidity levels before the market opens.
✔ Watch for absorption and stop runs to confirm trade entries.
✔ Use VPOC migration to gauge market direction.
✔ Manage risk carefully by waiting for confirmation before entry.
📌 Want to improve your ability to trade the open with confidence? Explore Bookmap’s Tools Here.
Frequently Asked Questions
Are you interested in intraday scalp strategies or longer-term trend following?
This guide focuses primarily on intraday trading during the opening bell. However, many of the same concepts—including liquidity analysis, market structure, and order flow—can also support longer-term trend-following strategies.
Do you need guidance on setting up stock scanners or choosing specific technical oscillators?
Many traders combine stock scanners with technical indicators such as RSI and MACD to identify potential opportunities before the market opens. These tools become more effective when used alongside real-time order flow rather than in isolation.
What makes the opening bell different from the rest of the trading day?
The opening session typically experiences the highest trading volume, increased volatility, and rapid liquidity changes as overnight information is incorporated into market prices.
Which technical indicators work best during the opening session?
Many traders monitor RSI, MACD, moving averages, and volatility measures alongside order flow. Rather than relying on any single indicator, combining technical confirmation with liquidity analysis generally provides stronger trade validation.
Should beginners trade the market open?
The opening bell can provide significant opportunities, but it is also one of the fastest-moving and most volatile periods of the trading day. Many new traders benefit from observing the open before actively participating or by practicing in simulation first.
How does Bookmap help traders during the opening bell?
Bookmap visualizes real-time liquidity, executed volume, absorption, stop runs, and evolving market depth. This allows traders to observe how buyers and sellers are interacting before committing to a position.
Sign Up Now
Latest Articles