See cpi more clearly in real time.
Compare plans to access deeper market visibility for cpi.
Education
April 8, 2025
SHARE
How to Trade USD Reactions on CPI Day: Strategies for Stock Market Traders

Suppose trading is a game! If that’s the case, then CPI announcements are the sudden plot twists that can make or break your trading strategy. That’s because CPI reports directly influence interest rates and market sentiment. Such an influence often causes intense price swings in stocks, the USD, and commodities.
Want to trade profitably during the CPI day? Also, we’ll explain how to read liquidity signals on our real-time market analysis tool, Bookmap, so that you can spot high-probability setups. So, want to sharpen your trading skills? Study the article carefully to trade CPI volatility with confidence and improve your timing.
Why CPI Matters for Stock Market Traders?
The Consumer Price Index (CPI) is considered to be one of the most important economic indicators. For the unaware, it measures inflation, directly influencing the Federal Reserve’s decisions on interest rates. Thus, CPI announcements usually have a substantial impact on financial markets.
How does CPI Influence Interest Rates and Markets?
Firstly, study the graphic below to get a gist of the concept:
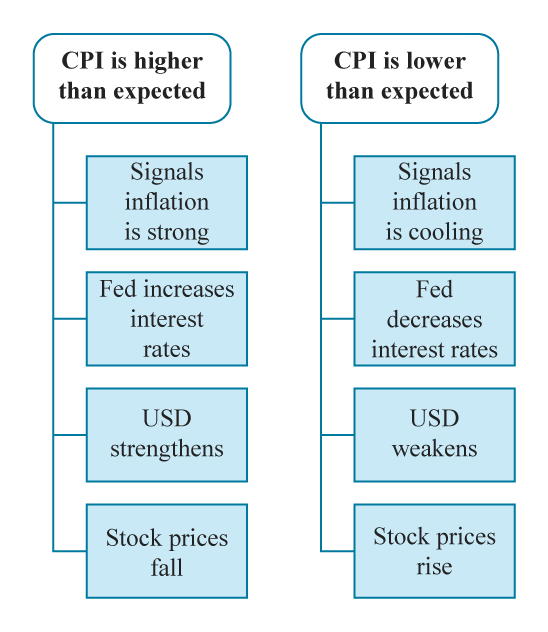
How do CPI announcements impact USD and stock prices?
Now, let’s understand in detail:
When CPI comes in higher than expected, it signals that inflation is still a problem. Usually, this prompts the Fed to raise interest rates to slow down the price surge. Now, these higher rates strengthen the USD. However, at the same time, they put pressure on stocks because a rate increase leads to:
- A rise in borrowing costs rise,
and
- A decrease in corporate profits.
On the other hand, if CPI is lower than expected, it suggests inflation is cooling, increasing hopes that the Fed might pause or cut rates. Such sentiment:
- Weakens the USD,
and
- Boosts stocks.
That’s because lower rates make borrowing cheaper and support economic growth.
The June 2022 CPI Shock
A classic example of the impact of CPI can be seen in the case of June 2022. At that time, inflation data came in much hotter than expected. Let’s see what happened:
- Markets had been hoping inflation would slow.
- However, the CPI report showed the opposite.
- This data led to a sharp selloff in stocks.
- Traders feared aggressive Fed rate hikes.
- The USD reaction on CPI day was intense.
- As a result, investors rushed to the dollar for safety.
- Meanwhile, major indices like the S&P 500 dropped sharply.
Thus, if you are trading CPI announcements, you must understand how these numbers affect interest rates, currency moves, and stock prices.
Step-by-Step Trading Approach for CPI Announcements
To trade CPI announcements, you need:
- Careful preparation,
- A quick reaction, and
- A solid strategy.
To help you with this, below are four major steps you must follow:
Step 1: Pre-CPI Release Preparation
Please note that successful trading of CPI announcements starts before the data is released. In this step, your goal is to:
- Understand what the market expects,
and
- Identify key price levels where liquidity is concentrated.
Let’s see how you can do this:
| Check Market Expectations | Mark Technical Levels | Plan Possible Scenarios |
|
|
|
By preparing ahead of time, you can react with confidence rather than emotion! Also, it improves your ability to deal with the:
- USD reaction on CPI day,
and
- CPI impact on stocks
Step 2: Immediate CPI Reaction (First 1-5 Minutes)
When the CPI announcement is released, markets react within seconds! This period is highly volatile (as there are rapid price swings). Primarily, this happens because traders digest the data.
Find it tempting to jump in immediately? But, you must first carefully observe liquidity shifts before making any trades. Let’s see how you can do it:
Watch Liquidity, Avoid Impulsive Trades!
We often see substantial liquidity withdrawals in the first few minutes after CPI data drops. Due to this, large buy and sell orders disappear (as traders wait for directions). Such aggressive liquidity absorption happens because big players step in to buy or sell heavily at key levels.
Thus, avoid chasing the first move! Remember, there are always sharp whipsaws before the market picks a clear direction.
Let’s understand better through an example:
The scenario
- Suppose the CPI number is higher than expected.
- Now, this signals persistent inflation.
- This signal makes a Fed rate hike more likely.
The market reaction
In such a situation, the market usually reacts like this:
| USD Strengthens Rapidly | Stock Market Selloff |
| Forex traders rush into the dollar, pushing it higher. | As rate hike fears rise, equities drop sharply. |
Master Tip: Take the Bookmap Confirmation
Ideally, you should watch Bookmap’s heatmap during these times to spot large liquidity zones getting absorbed, confirming a strong move.
Step 3: Identifying Tradable Secondary Setups (5-15 Minutes Post-Release)
After the initial CPI reaction, the market remains volatile. However, gradually, it starts to reveal more evident patterns! When such patterns emerge, you should look for secondary setups. Please note that these trade setups are more stable opportunities 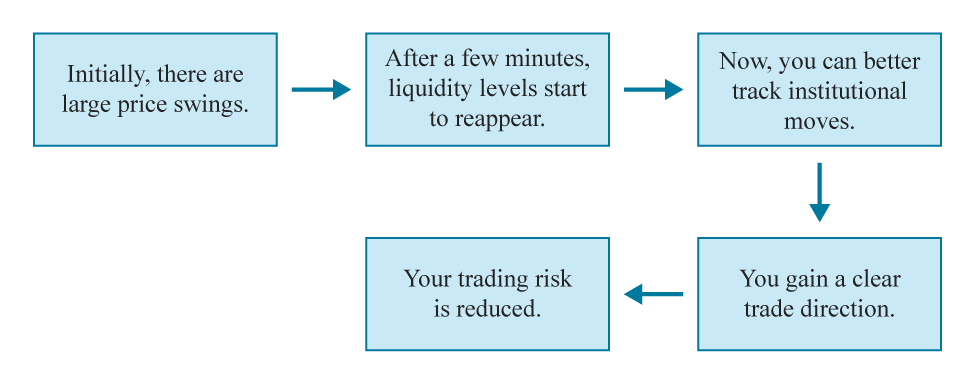 compared to the chaotic first few minutes.
Why Wait for Secondary Setups?
Why should you trade after a few minutes of the CPI report release?
The first reaction is often extreme, leading to large price swings that may trap impulsive traders.
However, after a few minutes, liquidity levels start to reappear. You can clearly see where big players are willing to buy or sell, providing you a better chance to enter a trade with:
- Reduced risk,
and
- Clearer direction.
How to Spot Tradable Setups on Our Bookmap?
On our tool, Bookmap, you should look for zones with large buy or sell orders that are placed again after an initial move. These re-emerging liquidity zones act as:
- Support (for buying),
or
- Resistance (for selling).
Check out the graphic below:
How to watch and interpret liquidity shits on Bookmap?
By watching these liquidity shifts on Bookmap, you can easily spot high-probability trade setups with better accuracy.
Let’s understand better through an example:
- Say the CPI number was higher than expected.
- It led to an initial stock market selloff.
- However, 10 minutes later, large buy orders appear below the S&P 500 futures price on Bookmap.
- This interest suggests that institutions are stepping in to buy.
- Now, it could lead to a reversal or bounce.
As a trader, you must wait for this confirmation instead of reacting to the first move. By waiting, you have a better chance of catching a more reliable trade.
Step 4: Confirming Directional Moves (15-60 Minutes Post-Release)
By this stage, the CPI announcement’s impact is becoming more evident. Now, you as a trader should focus on confirming whether the initial reaction was:
- Just a knee-jerk move,
or
- The start of a sustained trend.
This stage is where monitoring liquidity levels and volume spikes becomes crucial.
How to Confirm Market Direction?
| Aspects | Watch for sustained liquidity at key levels | Look for volume spikes | Absorption patterns help validate the direction |
| Situation | Suppose large orders keep appearing at a specific price level. | Suppose the price moves in one direction with increasing volume. | Suppose the price keeps testing a level but fails to break through. |
| Interpretation | It signals strong support or resistance. | It confirms that big traders are backing the move. | It means strong buyers or sellers are controlling the market. |
Track your CPI trading strategies and performance clearly with Bookmap’s Trading Journal.
Let’s study an example for more clarity:
- Say the CPI data was higher than expected.
- This spike leads to rate hike fears.
- These fears trigger an initial selloff in stocks.
Now, to confirm that this bearish move will continue, you should:
- Check Bookmap for liquidity
-
- If large sell orders remain above the current price, sellers are still in control.
- Monitor price action:
- If each attempt to bounce is met with aggressive selling absorption, it signals a downward trend.
Based on these confirmations, plan a short trade! Now, you can confidently take a short position (because you now know that the CPI impact on stocks is pushing markets lower).
Precise Entry and Exit Timing Around CPI Volatility
To trade CPI announcements profitably, you need precise timing to avoid getting caught in wild price swings. Check out the graphic below to learn how to about it:
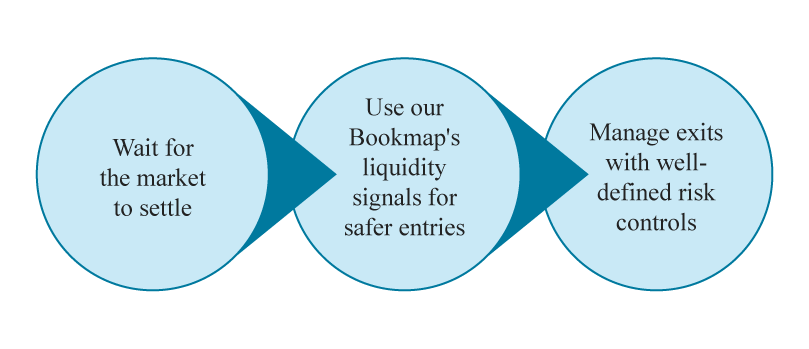
How do you trade on the CPI day?
Let’s understand in detail:
Entry Timing
The best entries come after the initial CPI reaction has played out. If you jump too early, you will be stopped by extreme volatility! Thus, instead, follow these three steps:
| Step I: Wait for volatility to settle | Step II: Look for Bookmap signals | Step III: Watch for absorption |
|
|
|
Exit Timing and Risk Management
Be aware that CPI impact on stocks can cause sharp reversals. Thus, you need a strong exit strategy to lock in profits and limit losses. This is what you can do:
- Use visible liquidity walls
- Set exit targets near areas where large orders are stacked on our Bookmap.
- These often act as turning points.
- Keep stop-losses tight
- Because of high volatility, stop-losses should be placed around key liquidity shifts.
- By doing so, you can protect yourself if the market moves unexpectedly.
- Adjust based on price action
- You should close the position early if:
- Price struggles to continue in your trade’s direction,
- You should close the position early if:
and
- Liquidity absorption weakens.
Clearly visualize stock market liquidity around CPI events—use Bookmap’s advanced order flow tools.
Common CPI Trading Pitfalls and How to Avoid Them
While trading CPI announcements, many traders fall into common traps. Check out the graphic below:
Common CPI Trading Traps You Must Avoid
Below is how to avoid these mistakes and trade CPI volatility:
Trading Immediate Unconfirmed Reactions
One of the biggest mistakes traders make is jumping into a trade when CPI data is released. They do so without waiting for confirmation.
Why it’s risky?
Please note that the first few minutes are often dominated by:
- Algorithmic trading,
and
- Emotional retail traders.
Thus, it leads to fake breakouts and sharp reversals. Also, entering too early can get you stopped before the actual move begins.
How to avoid it?
Instead of rushing in, wait for Bookmap confirmation. Ideally, you should look for:
- Liquidity reappearing at key levels,
or
- Absorption patterns.
Both of them indicate actual buying or selling pressure. For example,
- Say CPI is higher than expected.
- As a result, markets spike down in panic selling.
- However, large buy orders appear below the price on Bookmap.
- Now, this means institutional traders are stepping in to buy.
- Thus, it is safer to enter a long position.
Ignoring Liquidity Signals
Disregarding liquidity data from Bookmap is a costly mistake! Many traders rely only on price charts. They don’t realize that major liquidity levels act as barriers where price:
- Slows down,
- Reverses, or
- Accelerates.
Why it’s risky?
Entering or exiting trades without considering where large orders sit can lead to poor timing, often causing unnecessary losses or missed opportunities.
How to avoid it?
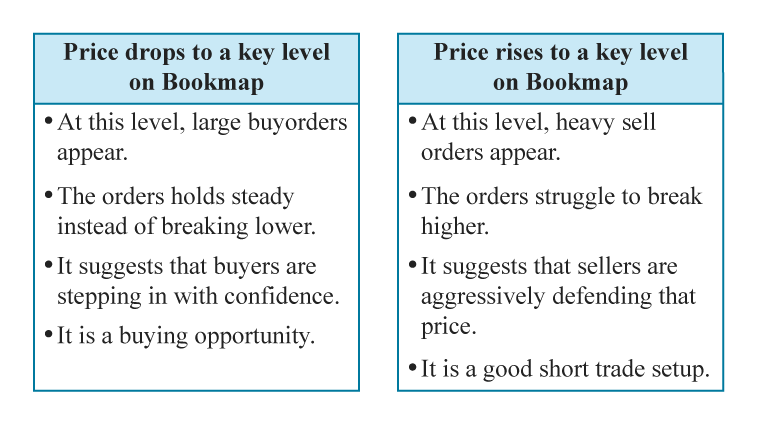
Before entering a trade, check where significant liquidity zones are located on Bookmap’s heatmap. That’s because these are potential turning points. Check out the graphic below:
How to analyze the presence of liquidity at key price levels on Bookmap?
In both cases, these liquidity zones are useful for spotting high-probability trades based on Bookmap’s real-time data.
Poor Position Sizing and Risk Management
While trading CPI announcements, you have to face extreme volatility. Most CPI-driven moves are fast and unpredictable. They can wipe out accounts if the risk isn’t managed correctly.
Thus, you must use proper position sizing and place stop losses for risk management. Let’s see how:
| Opt for an ideal position size | Have a clear exit plan | Use Bookmap’s liquidity levels to place stop-losses |
|
|
|
For example,
- Suppose you short the market after a bearish USD reaction on CPI day.
- Now, place your stop above a major liquidity wall.
- This move prevents random price spikes from stopping you out before the actual move happens.
Conclusion
To successfully trade CPI announcements, you require a structured and disciplined approach. It starts with careful pre-event preparation. Next, check economic calendars for expected vs. previous CPI data and identify key liquidity zones on our Bookmap before the release.
Once CPI data drops, patience is key! That’s because the first few minutes are highly volatile. Thus, you should observe liquidity shifts before making any decisions. Using Bookmap’s heatmap, you can confirm direction by showing where large buyers or sellers are stepping in.
Lastly, for entry timing, wait for re-emerging liquidity or absorption signals. Also, your exit strategies should be based on visible liquidity walls (with well-placed stop-losses to manage risk). Master precise entry and exit timing during CPI volatility—try Bookmap’s real-time market visualization.
Sign Up Now