See liquidity more clearly in real time.
Compare plans to access deeper market visibility for liquidity.
Education
April 8, 2025
SHARE
How to Trade USD Volatility Around Key Events: Step-By-Step Guide
Want to trade major USD events? Do you have a plan? If not, you are just skydiving without a parachute and hoping for the best! That’s because price movements are usually wild when markets react to CPI, FOMC, and NFP reports. These movements create both risks and opportunities. So, would you like to be on the right side of these shifts most of the time?
This article will teach you how to trade USD volatility events using structured strategies and patience. You will learn how to use our modern real-time analysis tool, Bookmap, for liquidity analysis. We will also explain why the CPI, FOMC, and NFP reports profoundly impact the markets and how to prepare before these events by marking liquidity zones. Additionally, we will understand how to react smartly during the initial volatility and use Bookmap to identify large liquidity walls.
So, do you want to trade these events confidently? Read this article till the end, and don’t let yourself fall into the trap of impulsive decisions!
Trading the CPI (Consumer Price Index) Release
Trading CPI and FOMC events are highly volatile because these reports directly influence:
- Monetary policy,
and
- Interest rate expectations.
For the unaware, the Consumer Price Index (CPI) measures inflation. It is one of the key factors the Federal Reserve weigh in when making decisions about interest rates. Check out its relevance through the graphic below:
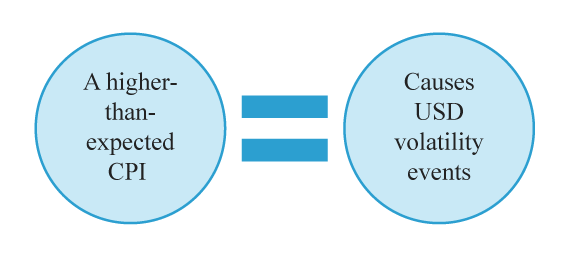
The CPI report impacts USD.
This volatility occurs because traders adjust their positions based on expected rate hikes. Let us learn how you can smartly deal with the CPI release:
Step 1: Pre-Event Preparation
Firstly, understand that the CPI reports show how fast prices are rising. Let us see how the Federal Reserve reacts basis these reports:
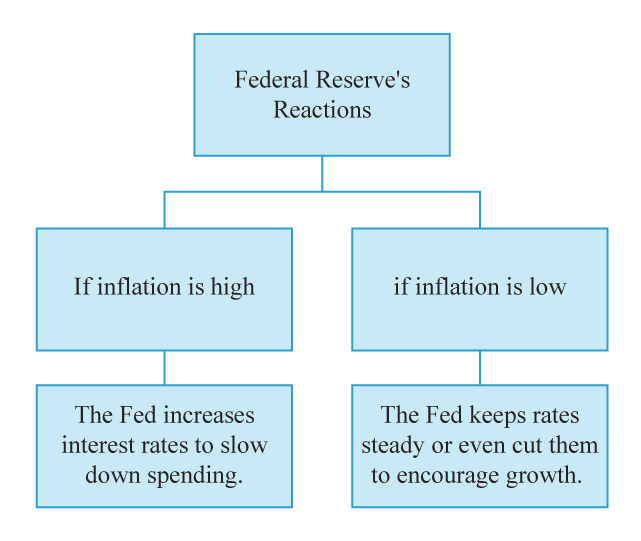
How does the Fed react to inflation fluctuations?
Before the release of the CPI, it is essential for traders to check economic calendars for the consensus forecast. This forecast represents the expected CPI number based on economists’ predictions. Please note that markets often react not just to the actual CPI number but also to how that number compares to the forecast.
Let us see how:
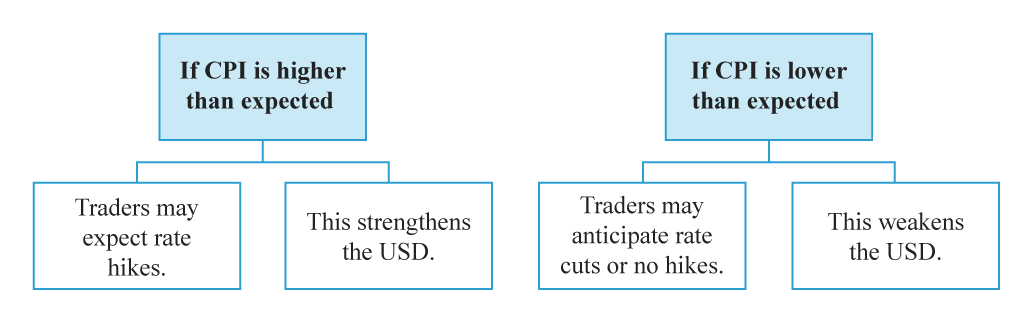
How does CPI impact trader’s expectations?
Next, you should identify key technical levels!
Before the event, it’s crucial to analyze key price levels, which can be quickly done using our advanced market analysis tool, Bookmap. It offers a unique feature called “heatmaps,” which allow you to visualize liquidity zones where large buy or sell orders are waiting.
By analyzing these zones, you can identify support and resistance levels. These are levels where price has historically reacted strongly.
Key Preparation Steps:
- Identify and note support and resistance levels on your chart.
- Identify liquidity clusters on Bookmap.
- These are areas where large buy/sell orders exist.
- For guidance, be aware of past price reactions to CPI releases.
Step 2: Immediate Reaction (First 5 Minutes Post-CPI)
When the CPI number is released, markets react instantly. This period is highly volatile, and price movements can be unpredictable. In this step, you should:
A) Watch for Liquidity Shifts and Volume Surges
In our Bookmap, look for shifts in liquidity, as they show where large market participants are placing their orders. Right after the release, you may notice:
- The sudden disappearance of liquidity (liquidity withdrawal) if traders remove large resting orders;
- Aggressive absorption, wherein large buy or sell orders get executed rapidly, showing strong interest in one direction; and
- High trading volume, as institutions adjust their positions.
B) Avoid Immediate Impulsive Trades
It is tempting to jump in right away! But remember that the market usually moves erratically in the first few minutes. Thus, instead of chasing after price movements, wait for at least 1-2 minutes to clearly understand the market.
A Smart Trading Tip
Let the initial volatility settle. Avoid any trading decisions during the first 5 minutes after the CPI release which prevents you from getting caught in:
- Fake breakouts,
or
- Sudden reversals.
Step 3: The Secondary Move (5-30 Minutes Post-CPI)
A more structured move forms after the first wave of volatility, which is the right time to look for solid trading opportunities. Let us understand in detail:
Watch for the Reappearance of Large Liquidity Levels
Be aware that big players such as institutions and hedge funds have adjusted their positions by this time. Also, large liquidity levels that disappeared earlier may reappear at this point. These levels now act as new support or resistance zones. Use them to make better entry decisions.
How to Define Entries Clearly?
| Buying Setup | Selling Setup |
|
|
Let us gain more clarity through the graphic below:
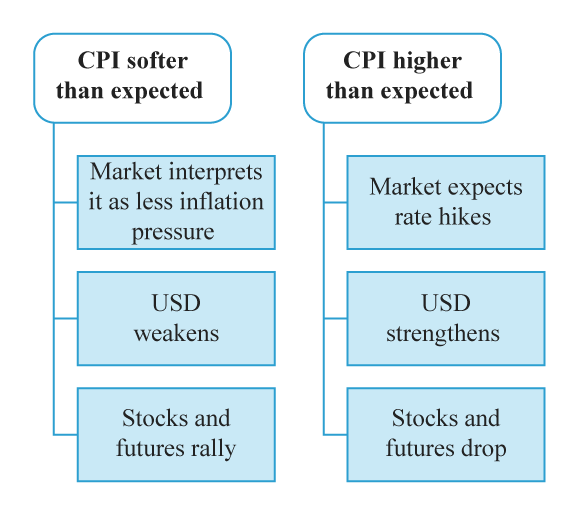
The effect of CPI expectations on USD, Stocks, and Futures
Trading the FOMC (Federal Open Market Committee) Announcement
The FOMC meeting is one of the most critical events for traders, as it determines interest rate policy. Usually, markets react strongly to FOMC decisions because interest rates influence:
- Borrowing costs,
- Inflation,
and
- Economic growth.
You need a structured approach to profitably trade USD volatility events around FOMC. For your reference, some steps are mentioned below:
Step 1: Pre-FOMC Analysis
The FOMC sets:
- Interest rates,
and
- Monetary policy.
If the Fed raises rates, it strengthens the USD and weakens stocks. On the other hand, if they cut rates or signal a pause, the opposite happens:
- USD weakens,
and
- Risk assets (stocks, gold, crypto) rally.
Please note that even if the Fed does not change rates, their forward guidance regarding the economy can still create volatility. In such a scenario, you should do the following:
A) Review Market Expectations
Before the FOMC announcement, you should check economic calendars. That’s because markets usually price in rate hikes or cuts ahead of time. Their reaction largely depends on whether the Fed’s decision meets, exceeds, or disappoints expectations. Check the graphic below:
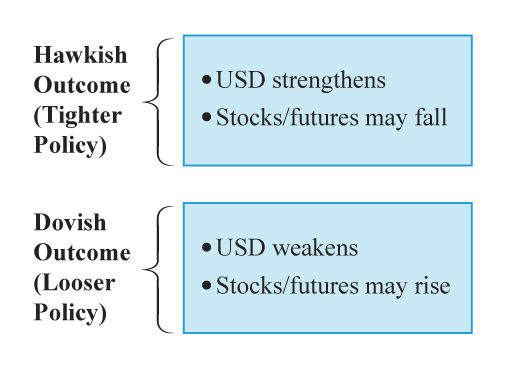
How do the Fed’s decisions impact USD and stocks?
B) Mark Key Liquidity Levels on Bookmap
You should identify large liquidity levels using our real-time market analysis tool, Bookmap. For the unaware, these are areas where significant buy or sell orders are waiting. Choose these levels as support and resistance zones.
Before FOMC release:
- Identify key levels where the price has reacted strongly in the past.
- Look for large liquidity clusters on our Bookmap.
- These areas suggest potential turning points.
Perfect your entry and exit timing during market-moving events using Bookmap’s advanced order flow tools.
Step 2: Initial Reaction (First 15 Minutes Post-FOMC)
When the announcement is released, the market moves rapidly. The first 15 minutes can be highly volatile. In this phase, the price usually swings in both directions because traders react to the news. However, ultimately, the market settles into a trend.
Look for Liquidity Absorption on Bookmap
In this step, you should use our tool, Bookmap, to analyze liquidity absorption- where large players, such as institutions, either support or cap price movement by executing large orders. By watching it, you can determine the market direction accurately. Let us understand better through two examples:
| Example of Bullish Absorption | Example of Bearish Absorption |
|
|
Pro Tip
Avoid trading in the first few minutes. Let the initial volatility settle to avoid getting caught in a fake move. Track your performance during event-driven volatility clearly—try Bookmap’s Trading Journal now.
Step 3: Press Conference & Continued Reaction (15-60 Minutes Post-FOMC)
About 30 minutes after the FOMC statement, the Fed Chair, usually Jerome Powell, holds a press conference. Please note that markets often react even more to his words than the initial rate decision. Let us see how:
- If he sounds hawkish, focussing on inflation and indicating the possibility of rate hikes, the USD may strengthen.
- If he sounds dovish, expressing concerns about slowing growth and hinting at potential rate cuts, the USD may weaken.
Here, you as a Trader Should Watch for New Liquidity Walls On Bookmap
As Powell speaks, new liquidity levels often form. These walls give clues about market direction. Check the graphic below:
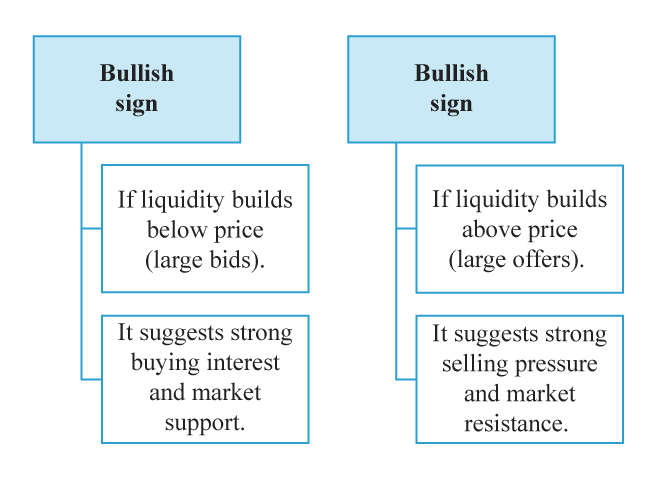
How do we analyze liquidity levels on Bookmap?
Practical Trading Tips
Suppose Powell sounds dovish and hints at slower rate hikes. On Bookmap, you see strong liquidity forming below the price, indicating a good buying opportunity.
In contrast, suppose Powell sounds hawkish and focuses on inflation and rate hikes. You will see that liquidity is building above the price on our tool, Bookmap, which presents a good selling opportunity.
Trading the NFP (Nonfarm Payrolls) Report
The Nonfarm Payrolls (NFP) report is also one of the most significant market-moving monthly events. It measures job growth in the U.S., excluding the agriculture sector, and serves as a key indicator of economic health.
Be aware that employment levels influence Federal Reserve policy. Thus, NFP often triggers USD volatility events across:
- Currencies,
- Commodities,
- Stocks,
and
- Bonds.
To profitably trade NFP, you can follow this approach:
Step 1: Before the NFP Report
The Federal Reserve closely watches job data because:
- Strong employment suggests a healthy economy,
and
- Weak job growth raises concerns.
Check out the graphic below to learn how NFP numbers affect expectations for interest rates:
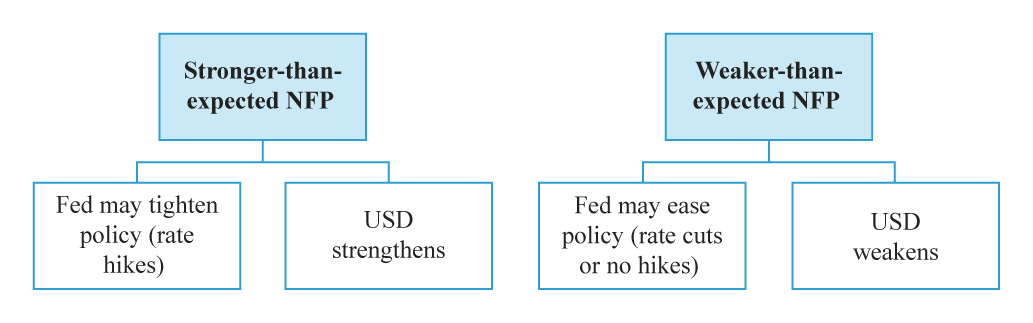
The impact of NFP numbers on expectations for interest rates
So, in this step, you to perform the following:
A) Check Market Expectations
Before the release, check economic calendars for the consensus forecast, which indicates what analysts expect. That is because markets react not just to the actual number but also to how it compares to the forecast.
Let us understand better through the graphical example below:
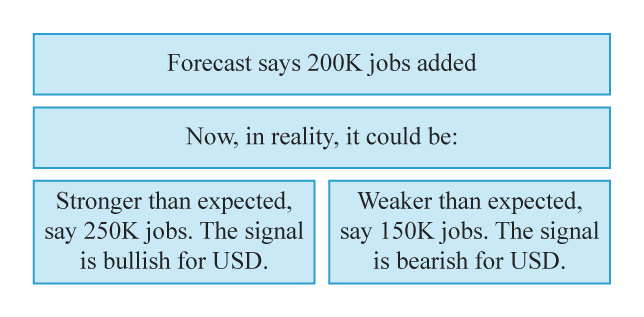
How does the relationship between job forecast and reality impact USD?
B) Identify Key Liquidity Levels
Before NFP, use Bookmap to mark major liquidity zones, which serve as support and resistance levels. These are price areas where big orders are waiting. They can act as turning points when the market reacts to the report.
Pre-NFP Checklist:
Identify past reaction zones from previous NFP reports.
Look for large buy/sell orders on Bookmap that could influence price action.
Be ready for sharp volatility when the data is released.
Step 2: Initial Market Reaction (First 10 Minutes Post-NFP)
The first 10 minutes after the NFP release can be chaotic. There could be price whipsaws in both directions. Liquidity shifts rapidly in this phase because institutions reposition their trades.
In this step, you should watch the following on our Bookmap:
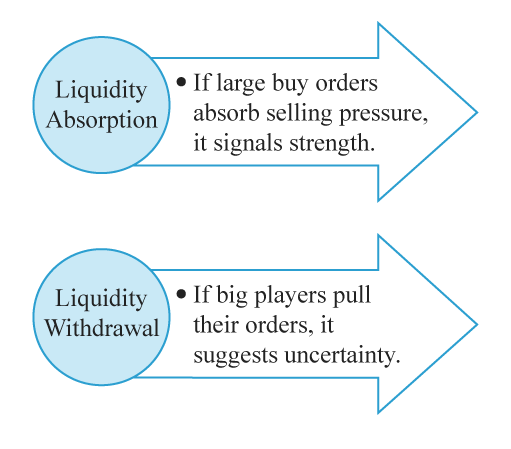
What to watch on Bookmap?
What happens due to a strong NFP reaction?
If NFP comes in much stronger than expected:
- USD rallies as traders price in a tighter Fed policy.
- Stock indices drop because higher rates make borrowing more expensive.
- Gold falls since higher rates strengthen the USD, reducing gold’s appeal.
Here, you should use our tool, Bookmap. It shows rapid liquidity absorption in USD futures, commodities, and stocks. Using it, you can confirm the market’s direction.
Step 3: Second Wave Trade Opportunities (10-30 Minutes Post-NFP)
Once the initial volatility settles, a more structured move often appears, which is why you should look for opportunities. Let us see how:
Wait for Secondary Setups
The best trade setups often come after the first 10 minutes. In this phase:
- Liquidity builds up,
and
- Price direction becomes more apparent.
What to Look for on Bookmap?
On our tool, Bookmap, specifically look for the following:
| Liquidity build-up | Clear trend confirmation |
|
|
For more clarity, let us study an example of a trade setup:
- Suppose NFP comes in strong.
- But after an initial rally, liquidity builds above price as resistance.
- Now, the market starts reversing as traders take profits.
- Here, you should short and sell if the price struggles to break resistance.
General Tips for Trading USD Volatility Events (Across All Types)
Trading USD volatility events like CPI, FOMC, and NFP can be highly rewarding. But, they are also risky due to sudden price swings. To improve your trading success, below are some tips to manage risk:
1. Keep Position Sizes Small
This strategy makes sense during high-impact events like trading CPI and FOMC events because the market can move unpredictably. Sometimes, it even moves in both directions before settling into a trend.
Large positions can lead to huge losses if the market moves against you.
What to Do?
- Trade with smaller position sizes than usual.
- If your average trade size is two lots, consider reducing it to one or less.
- This downsizing reduces the emotional pressure and helps you manage risk better.
For Example:
- Let us say you trade the NFP report.
- The market whipsaws 50-100 pips before stabilizing.
- A smaller position ensures that your losses are manageable, even if you’re wrong.
2. Use Tight Stop-Losses Based on Bookmap Liquidity Zones
Large players use liquidity zones to execute big orders because they act as support and resistance. When you place your stop-loss too close to random price points, it leads to unnecessary stop-outs. Thus, use our tool, Bookmap, to:
- Identify key liquidity areas,
and
- Set stops strategically.
How to Place Stop-Losses Smartly?
- Look at Bookmap heatmaps to see where liquidity is stacked.
- If you’re going long and buying, place your stop below a strong liquidity zone for support.
- Alternatively, if you’re going short and selling, place your stop above a large liquidity wall for resistance.
For Example:
- You see a strong liquidity wall at 1.2500 in EUR/USD.
- You go long at 1.2515.
- You did so, expecting the price to bounce off the liquidity.
- Instead of using a random stop, you placed it just below 1.2500, where actual liquidity exists.
- This move prevents you from being stopped out by short-term noise while still controlling risk.
3. Stick to Your Predefined Entry and Exit Plan
Fear and greed can make you hesitate or overtrade during volatile events. If you do not have a clear plan, you might exit too early or hold onto losing trades for too long. Thus, you must stay disciplined while trading.
How to Stay Disciplined?
- Define entry and exit points before the event. Do not adjust them emotionally!
- Use liquidity confirmation on Bookmap.
- Wait for signs that large orders are backing your trade.
- If the trade does not go as planned, exit quickly instead of hoping for a reversal.
Conclusion
You need a structured approach to successfully trade USD volatility events such as CPI, FOMC, and NFP. Instead of reacting impulsively, you should plan well, monitor market expectations, and use Bookmap to identify key liquidity zones.
Remember that the first few minutes after an event are often highly volatile. Thus, be patient and wait for a clear direction before entering trades.
Use liquidity absorption and liquidity walls as guides. By monitoring them on Bookmap, you can confirm strong support and resistance levels. Also, keep your position sizes small and set stop-losses based on liquidity zones.
Most importantly, discipline is key! Thus, stick to predefined entry and exit points instead of making emotional decisions. Visualize liquidity in real-time and trade key USD events confidently with Bookmap.
Sign Up Now