See market more clearly in real time.
Compare plans to access deeper market visibility for market.
Education
August 19, 2024
SHARE
Interpreting Volume and Order Flow: A Comparative Analysis

In the ever-changing stock market, fortunes favor those who seize market opportunities. Through comprehensive market research, investors can identify undervalued securities and sectors that have the potential for immense growth.
The interpretation of “volume” and “order flows” helps participants to identify emerging trends, spot institutional activities, and gauge market sentiments. Additionally, it equips traders to evaluate support and resistance levels, as well as gauge market liquidity.
Let’s dive in to understand the intricacies of trading volume and order flow. Equipped with this knowledge, we’ll explore how successful traders and investors leverage these insights to create effective trading strategies.
The Importance of Trading Volume: Insights for Better Trading Decisions
The interpretation of trading volumes helps the stock market participants understand the dynamics of trading a particular security. This understanding helps in making informed decisions while also spotting potential stock market imbalances.
Market imbalance occurs when there is a disparity in the buying and selling interest of a particular security, which often causes price distortions. Such imbalances are usually due to:
- Shifts in market sentiments
- Market orders placed by large institutions, and
- Unexpected news events
Let’s look at an example to understand market imbalances:
On a particular trading day, the shares of Company ABC opened at $50 apiece. After two hours, the company’s quarterly earnings report beats all the market expectations.
This leads to a sudden change in the market sentiments. Most retail and institutional investors and/or traders start placing large buying orders. The trading volume of the stock surges and puts upward pressure on the current market price (CMP).
The limited number of sellers causes the CMP to inflate, leading to “price distortion”. The caused the stock price of Company ABC to exceed the fundamental value.
Interpreting trading volumes, the market participants recognize the unsustainable CMP and anticipate a correction. Thereby, they accordingly form trading strategies, say, by taking short positions.
What Is Trading Volume?
Trading volume represents the total number of shares or contracts traded for a particular security in a given time frame, which is usually one trading day.
For Example:
On a particular trading day, Company XYZ, a listed entity actively trading on the New York Stock Exchange (NYSE), showed the following data:
- Opening Price: $120
- Closing Price: $125
- High: $132
- Low: $118
- Volume: 1,000,000 shares
In this context, the provided data signifies that throughout the trading day, a total of 1,000,000 shares were exchanged between buyers and sellers at various price points. This demonstrates how trading volume captures the extent of market activity and engagement in terms of shares bought and sold during a specific period.
Understanding trading volume is essential as it offers insights into the level of interest, liquidity, and participation in the market, all of which play a pivotal role in comprehending price movements and making informed trading decisions.
How Do Traders Use Volume In Market Analysis?
Most stock market traders analyze the dynamics of trading volume to understand the market imbalances, sentiments, and volatility. It often acts as an efficient technical indicator and helps in forming effective trading strategies. It helps traders in the following ways:
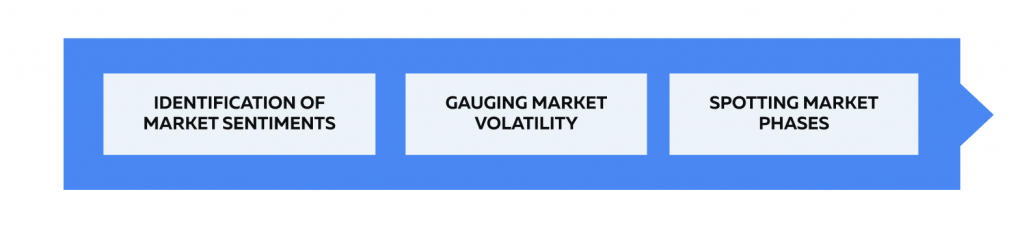
1. Identification Of Market Sentiments:
An analysis of trading volumes helps to identify the prevailing market sentiments in the following manner:
| Bullish Sentiment | Bearish Sentiment |
| The trading volume of a stock increases. | The trading volume of the stock decreases. |
| There is a sudden influx of “buy orders”. | There is a sudden influx of “sell orders”. |
| Most traders attempt to buy the stock at a higher price. | Most traders attempt to sell the stock at a lower price. |
| The price of the stock increases sharply. | The price of the stock decreases sharply. |
2. Gauging Market Volatility:
If there is the presence of high trading volumes during volatile trading days, it indicates:
- Presence of a major market-moving news or event
- Strong potential for major price swings
- Increased market uncertainty
- A strong market interest
3. Spotting Market Phases:
As suggested by the popular Wyckoff method, the prices in a typical stock market move through four different phases, which are Accumulation, Mark-up, Distribution, and Downturn. A deeper analysis of trading volumes helps the traders to identify the current market phase:
| The Four Market Phases | The Behavior of Trading Volume | The Effect on Stock Price |
| Accumulation | Relatively low trading volumes compared to other phases | Price moves upward due to buying pressure |
| Mark-up | Trading volumes start to increase | Price keeps increasing and reaches its peak due to continued buying interest |
| Distribution | A significant increase in the trading volumes | Price shows a minor decline due to the initiation of selling pressure |
| Downturn | High trading volumes remain consistent | Price declines significantly due to a greater number of sell orders and limited buy orders |
Decoding Order Flow
Trading volumes act as an important technical indicator and play a crucial role in determining market moves. However, many traders don’t limit themselves to just one method; instead, they utilize various approaches.
By decoding “order flows”, traders can understand the reason behind short-term movements in the market price. This allows them to discern the market participants’ true intentions at the different price levels and gain insights into the dynamic interplay of demand and supply. Let’s closely examine order flow and grasp how it shapes well-informed trading decisions.
What is Order Flow?
Order flow refers to the cumulative number of trades placed by various market participants at different prices and quantities for a specific security. In the stock market, traders and investors execute transactions using different types of market orders, including:
- Buy Order:
A buy order is executed immediately at the best available “ask price.” For instance, if John wants to buy 175 shares of Apple Inc., his order will be fulfilled promptly at the prevailing ask price of $192 per share.
- Limit Order:
A limit order can be further divided into:
| Limit Buy Order | Limit Sell Order |
| This type of order is placed to buy at a particular price or any lower price. | This type of order is placed to sell at a particular price or any higher price. |
For example,
|
For example,
|
- Sell Order:
A sell order involves an immediate sale executed at the best available “bid price.” For instance, if John wants to sell 175 shares of Apple Inc., his order will be swiftly fulfilled at the prevailing bid price of $195 per share.
The Role Of Order Flow In Trading Decisions
One of the primary objectives of order flow analysis is to enable traders to predict future fluctuations in stock prices. Traders widely use it to make price and/or trend projections in the following manner:

- Recognizing Momentum:
The rapid execution of market orders establishes market momentum, indicating a “sense of urgency” among traders to open or close positions in anticipation of emerging market trends. Analyzing order flow can help understand momentum shifts and anticipate potential trend reversals or continuation patterns.
- Identifying Support And Resistance Levels:
A significant number of buy orders placed at a specific price establish the “support price” for that particular security, indicating that stock prices won’t fall below this level. Conversely, a significant number of sell orders at a specific price establish a “resistance level,” showing that the stock price won’t move upward beyond this level.
- Analyzing Market Liquidity:
The presence of high trading volumes, profound order depth, and narrower bid-ask spreads indicate a highly liquid market. In contrast, shallower order depth and tighter bid-ask spreads reveal a less liquid market with the possibility of even market buy and sell orders remaining pending.
Volume Vs. Order Flow: A Comparative Analysis
The formulation of an effective trading strategy not only helps in objective decision-making but also maximizes profit potential. An assessment of “Trading Volumes” and “Order Flows” aids in identifying clear market entry and exit points, contributing to a robust trading strategy.
While both the terms are related to each other, they offer unique perspectives and assist traders differently. Let’s delve into a more comprehensive comparison by examining the table below:
| Parameter | Trading Volume | Order Flow |
| What does it mean? | Represents the total number of shares or contracts traded for a particular security in a given period (say one trading day) | Represents the real-time flow of different types of market orders placed in respect of a particular security |
| Type of Data Used | Historical data | Spontaneous live data |
| Timing of Calculation | At the end of a trading period | Calculated in real-time as orders get placed |
| Majorly Used For: |
|
|
Synergies Between Trading Volume and Order Flow
Trading volumes and order flows are often used together by most market participants to gain complementary perspectives and make accurate market predictions. This powerful combination works in tandem, offering the following benefits:
- Identification of market sentiments
- Determination of support and resistance levels
- Spotting market trends and reversals
- Assessment of market liquidity
- Identification of short-term trading opportunities
This collaborative use of trading volumes and order flows enhances traders’ ability to grasp the intricate movements of the market, providing a well-rounded perspective that aids in informed decision-making and effective strategy development.
Leveraging Trading Tools for Volume and Order Flow Analysis
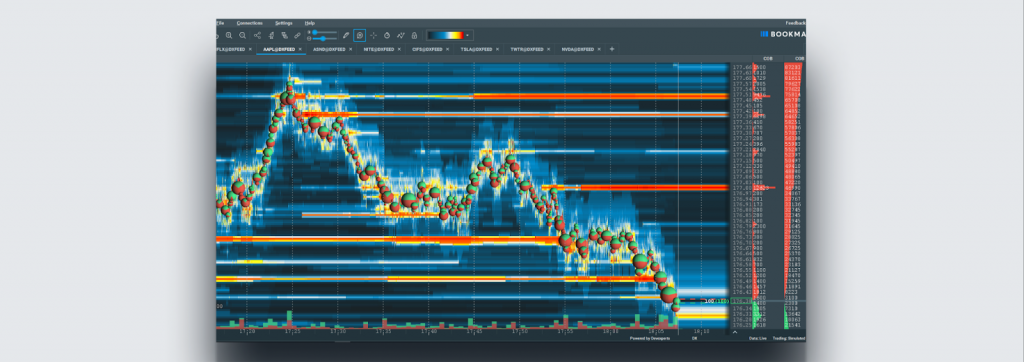
Interpretation and analysis of volume and order flow data provide valuable insights and enhance traders’ understanding of market dynamics. Trading tools, such as Bookmap, make this process easier by offering advanced features and visualizations.
Intelligently designed by experts, Bookmap’s Volume Dots, Heatmap, and Volume Bars aid traders in the following ways:
- Volume Dots:
- display real-time volume data on the price chart
- help in gaining an understanding of the supply and demand dynamics at a specific price level
- identify significant areas of liquidity
- Heatmap:
- offers a graphical representation of order flow data
- color-codes different price levels based on traded volume and order flow activity
- Volume Bars:
- show the volume traded at each price level
- help traders identify price areas at which substantial trading is happening
By utilizing Bookmap’s Volume Dots, Heatmap, and Volume Bars, traders can gain deeper insights into market activity and trends.
Conclusion
The analysis of trading volumes and order flow equips traders and investors with the tools needed to create effective trading strategies, enhancing their ability to achieve successful outcomes in the market. By harnessing the combined power of these tools, traders can identify emerging trends, evaluate support and resistance levels, gauge market liquidity, and assess momentum, among other insights.
Bookmap’s cutting-edge trading tools further streamline this analysis, providing intuitive visualizations and a host of advanced features that simplify the process and enhance traders’ decision-making capabilities.
Ready to elevate your trading with advanced insights into volume and order flow? Sign up for Bookmap and take the first step towards enhanced market understanding today.
Sign Up Now