See bookmap pro more clearly in real time.
Compare plans to access deeper market visibility for bookmap pro.
Futures
July 8, 2024
SHARE
MBO Insights From Bookmap Traders
Using the Stop & Iceberg Tracker, and Liquidity Tracker
Here we have a collection of top trader’s Tweets on how they successfully navigate the markets, armed with Bookmap’s order flow trading tools. In combination with MBO data, the Stop & Iceberg Tracker and Liquidity Tracker provide a remarkable level of market transparency previously hidden from retail traders. While these addons are powerful tools, they are not a day trading signals service. Instead, these professional traders combine the skills of order flow tape reading with some of the best indicators for day trading available. See how these traders use the Stop & Iceberg order flow indicators at levels of confluence to develop successful day trading strategies. For more information on the Bookmap MBO Bundle tools, please read our article here.
ES high liquidity price target at 3850 achieved. Uptrend pullback entries supported by bullish liquidity, SpotGamma levels (white dashed lines), Iceberg orders (blue line in subpanel), and buyers absorbing shown with the Absorption Indicator (green squares). @bookmap_pro pic.twitter.com/WiT6Dbt1jO
— Doug Pless (@dougpless) February 4, 2021
Doug Pless combines Bookmaps heatmap and Stop-Iceberg Tracker with SpotGamma levels to give him conviction in a bullish trend that reached his target of a high liquidity level.
#Bookmap captures nice fills of high liquidity from 3720-3685 in the #ES_F, followed by a return back to high liquidity at 3735. Notice how larger icebergs sell on the way down, then start buying at the bottom while others are stopped out.#orderflow #DayTrading pic.twitter.com/8SYcPKo4U6
— Bookmap (@bookmap_pro) January 30, 2021
The ES trades into high liquidity. Icebergs are on the sell-side on the way down and flip to start buying the stops that are triggered.
ES – BookMap Stop/Iceberg + Liq Tracker + Auction Mkt Theory – For Illustration Only. Please R/T. Tx! Tom B. #ES_F #NQ_f #orderflow #bookmap @bookmap_pro #daytrading pic.twitter.com/Xwzeay32G4
— Tom B. (@TomB_Trades) January 26, 2021
A great illustration of the power of the heatmap and Bookmap’s Stop-Iceberg and Liquidity Trackers. Liquidity being pulled and added, iceberg absorption, market order exhaustion—it’s all there. And Bookmap visualizes these live auction phenomena for traders on a daily basis.
Unlucky for paper. All that buying, barely moved the market 3P? Trapped. $TICK was weak from the open & hinted multiple times this buyer doesn’t have the broader market behind him. Remember, paper doesn’t always win @bookmap_pro #ES_F #NQ_F #RTY_F #YM_F #SPX #SPY $SPX $SPY $DIA pic.twitter.com/2DX7YiMwQ6
— Futures Trader 26 (@futurestrader26) January 21, 2021
A buyer/buyers get trapped in a large position, some of which is absorbed by icebergs. Without the market trend behind the buyers, prices have only one way to go and they are forced to close out.
Es short @bookmap_pro pic.twitter.com/50VP86AEky
— dov oren (@oren_dov) January 19, 2021
An example of a trade using a falling CVD in combination with liquidity seen on the heatmap to enter short, control risk, and identify a realistic profit target.
https://twitter.com/futurestrader26/status/1351570385272242182?s=20
A trader just staring at a candlestick chart will remain completely oblivious to the kind nuanced information embedded in the order book. Here the behavior of the bids is reminiscent of an algorithm.
blue sweep is coming treasury yields rising and stocks are selling – bigger corporate taxes, negative for techs. Watch those treasury yields if they break out they will drag stocks lower.
You can see some CVD and iceberg selling on @bookmap_pro.
ROLLER COASTER#SPX #bluesweep pic.twitter.com/kWrXCwv9Mz— Tomas Brychta (@fxbryt) January 6, 2021
MBO can also help with trading the news. Here we can see CVD and iceberg selling on the E-Mini S&P 500 as traders braced for a blue sweep during the 2021 US elections.
In NQ, the situation looked like this. She was the strongest, but not extremely strong. I entered short over the Iceberg Sell area. Stoploss over 12740. Target Iceberg Sell area. https://t.co/eKsVnl9ZMB pic.twitter.com/0xn3wDTekg
— Paya Prochazka (@PayaProchazka) December 22, 2020
Paya Prochazka discusses his trade with Scott Pulcini. He took a short position above a sell iceberg area, his stop protected behind the offers above, targeting a return into the iceberg zone.
Volatile day covering the full range of levels. Interesting convergence of key options levels and icebergs too.$ES $SPY $SPX pic.twitter.com/H9TQYlgKUt
— SpotGamma (@spotgamma) December 11, 2020
Sometimes icebergs also correlate with key options levels.
Awesome Double Whammy sell setup in CL accented by large sell absorption stopping that bungy jump rally in its tracks using the INCREDIBLE SI Indicator and new Absorbption Indicator from @bookmap_pro pic.twitter.com/lpiHF5Ynrk
— scottpulcinitrader.com (@scottpulcinitr1) December 1, 2020
Huge buy stops are met with sell icebergs, marking the very top of the market (after a brief test at a higher high).
Paper is not happy. If more offers start pulling & buyers accept above yesterday’s close, stops above yH become vulnerable @bookmap_pro #ES_F $ES_F #NQ_F $NQ_F #SPX #SPY $SPX $SPY $DIA $QQQ $NDX $IWM $VIX #ES $ES #NQ $NQ#futures #orderflow #trading #daytrading #stockmarket pic.twitter.com/3LpLLSpg7p
— Futures Trader 26 (@futurestrader26) November 20, 2020
As offers pull and prices continue to move against buy icebergs, stops above the previous day’s high become vulnerable.
10P balance @ ON #VWAP, successful breakout, triggering buy-stops for new ATHs aided by long-term high liquidity resting on the offer before the crack #ES $ES #ES_F $ES_F #NQ $NQ #NQ_F $NQ_F #SPX $SPX #SPY $SPY#futures #orderflow #trading #daytrading #stockmarket @bookmap_pro pic.twitter.com/mzj0TbxIIA
— Futures Trader 26 (@futurestrader26) November 9, 2020
Buy stops triggered breakout into new all time highs. Notice the retest of the area where large offers were consumed before brief widening of bid-ask spread and jump higher.
https://twitter.com/vvvangoh/status/1323357982021832705?s=20
A combination of events are triggered at precisely 10am on the E-Mini NASDAQ 100 futures (possibly by an algo): a run on stops right into sell icebergs, the market spiking and then falling off.
Liquidity on the offer (10s) flips over to the bid (06s) & holds, more offers above cancel, buy-stops fire off, a tiny sell-iceberg didn’t get paid, vacuum galore #ES $ES #ES_F $ES_F #NQ $NQ #NQ_F $NQ_F #SPX $SPX #SPY $SPY @bookmap_pro pic.twitter.com/tNuSGVbIdu
— Futures Trader 26 (@futurestrader26) November 2, 2020
Offers pull before being getting hit and bids are posted. Buy stops are triggered and sell icebergs show a loss, a combination of which Futures Trader 26 refers to as a “vacuum”.
Responsive sellers iced their way into 3400s @ balance high. Once she was able to crack the MID of balance, the other side was inevitable. Anticipated buyers @ 85-80s to be hurt but #NQ_F failed to crack his open to lower + made new HOD into the close @bookmap_pro #ES_F $ES_F pic.twitter.com/WPgBYxCGmB
— Futures Trader 26 (@futurestrader26) October 27, 2020
Iceberg sellers at a balance high kept a lid on the Nasdaq. When the retest failed and the middle of balance was broken, market sellers took the market as low as the cluster of bids at 3388.
Start of a major breakdown of a balance in ZW into the close, confirmed by large sell ice using the INCREDIBLE SI Indicator by @bookmap_pro stopping any attempt at moving higher and the breakdown out of multiple TAS boxes using @tasmarketpro Looking to add shorts on Globex open pic.twitter.com/PGWlQuvG4i
— scottpulcinitrader.com (@scottpulcinitr1) October 27, 2020
As Wheat futures break away from a balance area in the market close, Scott Pulcini uses the large sell icebergs detected by the Stop-Iceberg Tracker as confirmation to seek to add shorts on the Globex open.
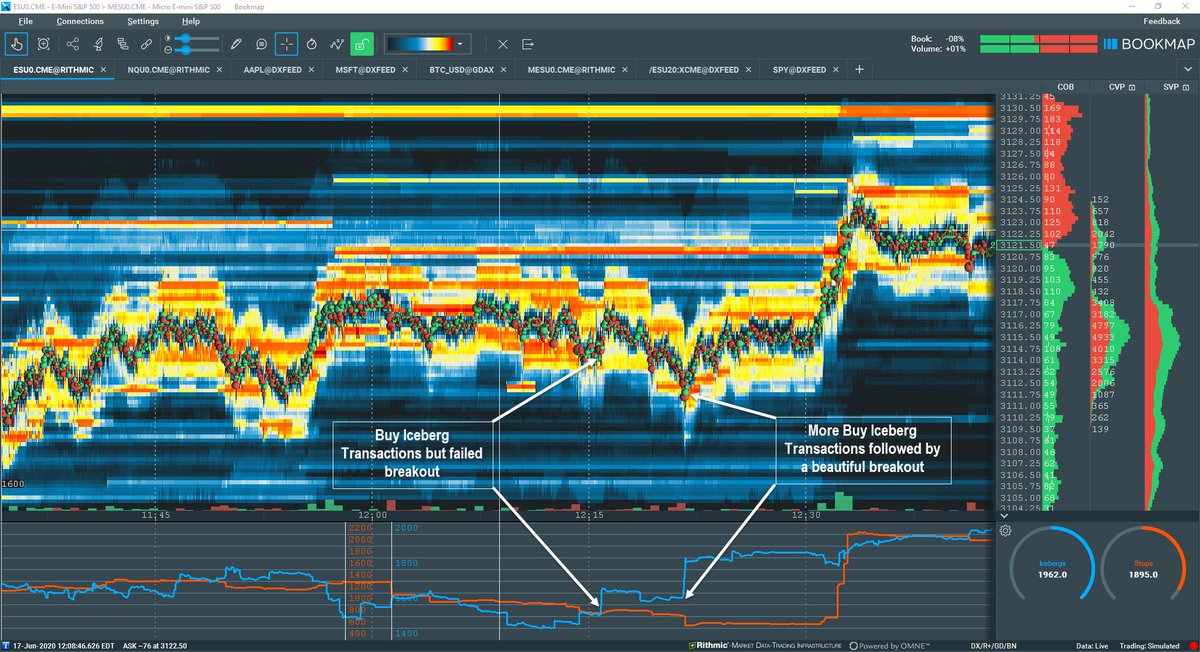
https://twitter.com/futurestrader26/status/1321114960743772166?s=20
Futures Trader 26, an avid Bookmap user based in the United Kingdom, shares an image of how quadruple buy icebergs on the E-Mini attempt to keep prices above the previous day’s cash close.
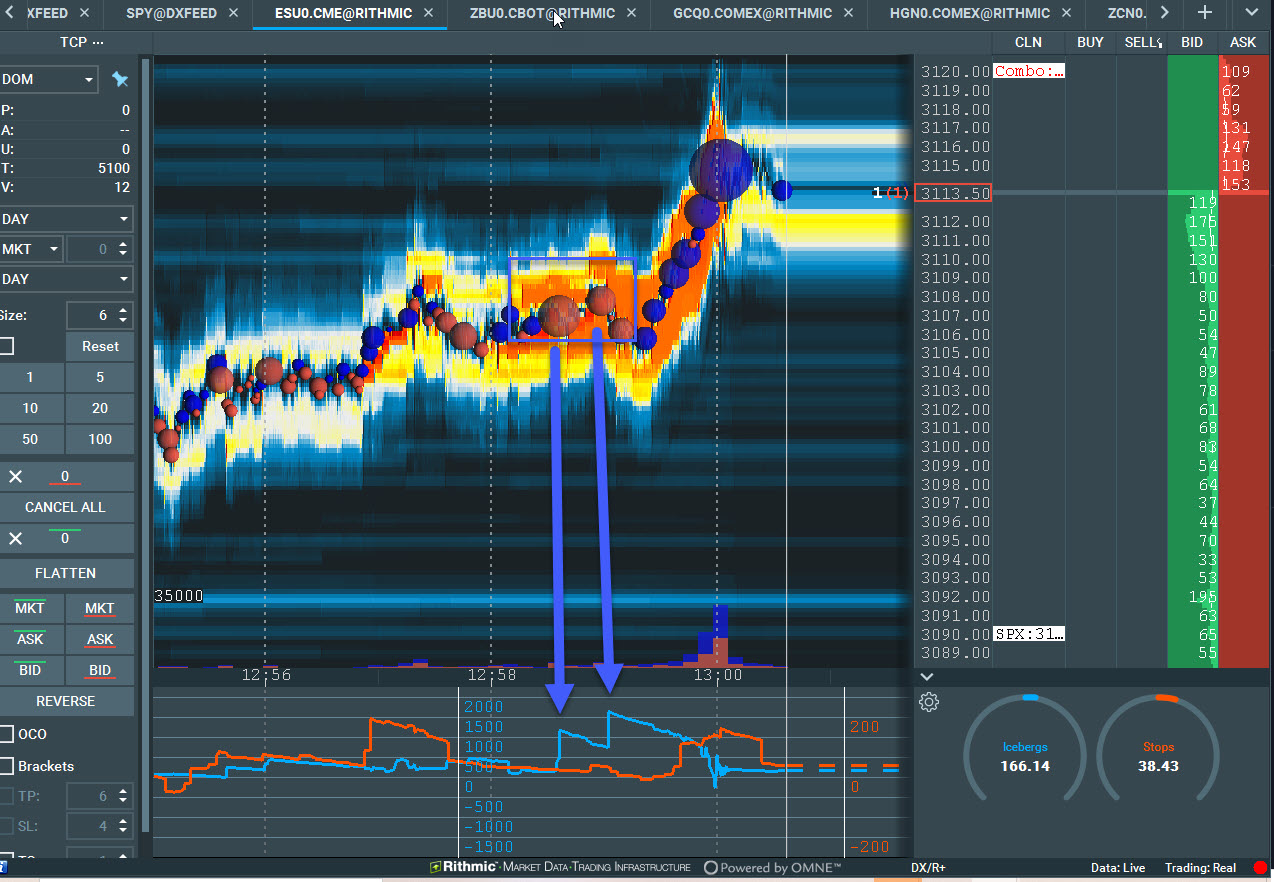
June 16, 2020 @scottpulcinitr1
“Monster buy icebergs using @bookmap_pro,
1150 and 1640 from the 3105-3108 level.”
Veteran order flow trader Scott Pulcini notices in the ES two significant buy iceberg spikes occurring back-to-back; one was for 1150 and the other for 1640 contracts. You can see there is a stop run occurring before the iceberg transactions, but price accepts in this newly established range of 3105-3108. Just because there is a stop run, doesn’t mean the price will reverse; it’s all about the context and follows through after the event has occurred. Within this new range, large iceberg buy transactions give pretty good insight for the potential breakout to the upside, which ensued shortly afterwards for a nice move up to 3115. In this example, Scott is using the S-I Tracker setting of the Exponential Accumulation output. It records the spike but then begins to reset back to zero-based on a 50% decay rate.
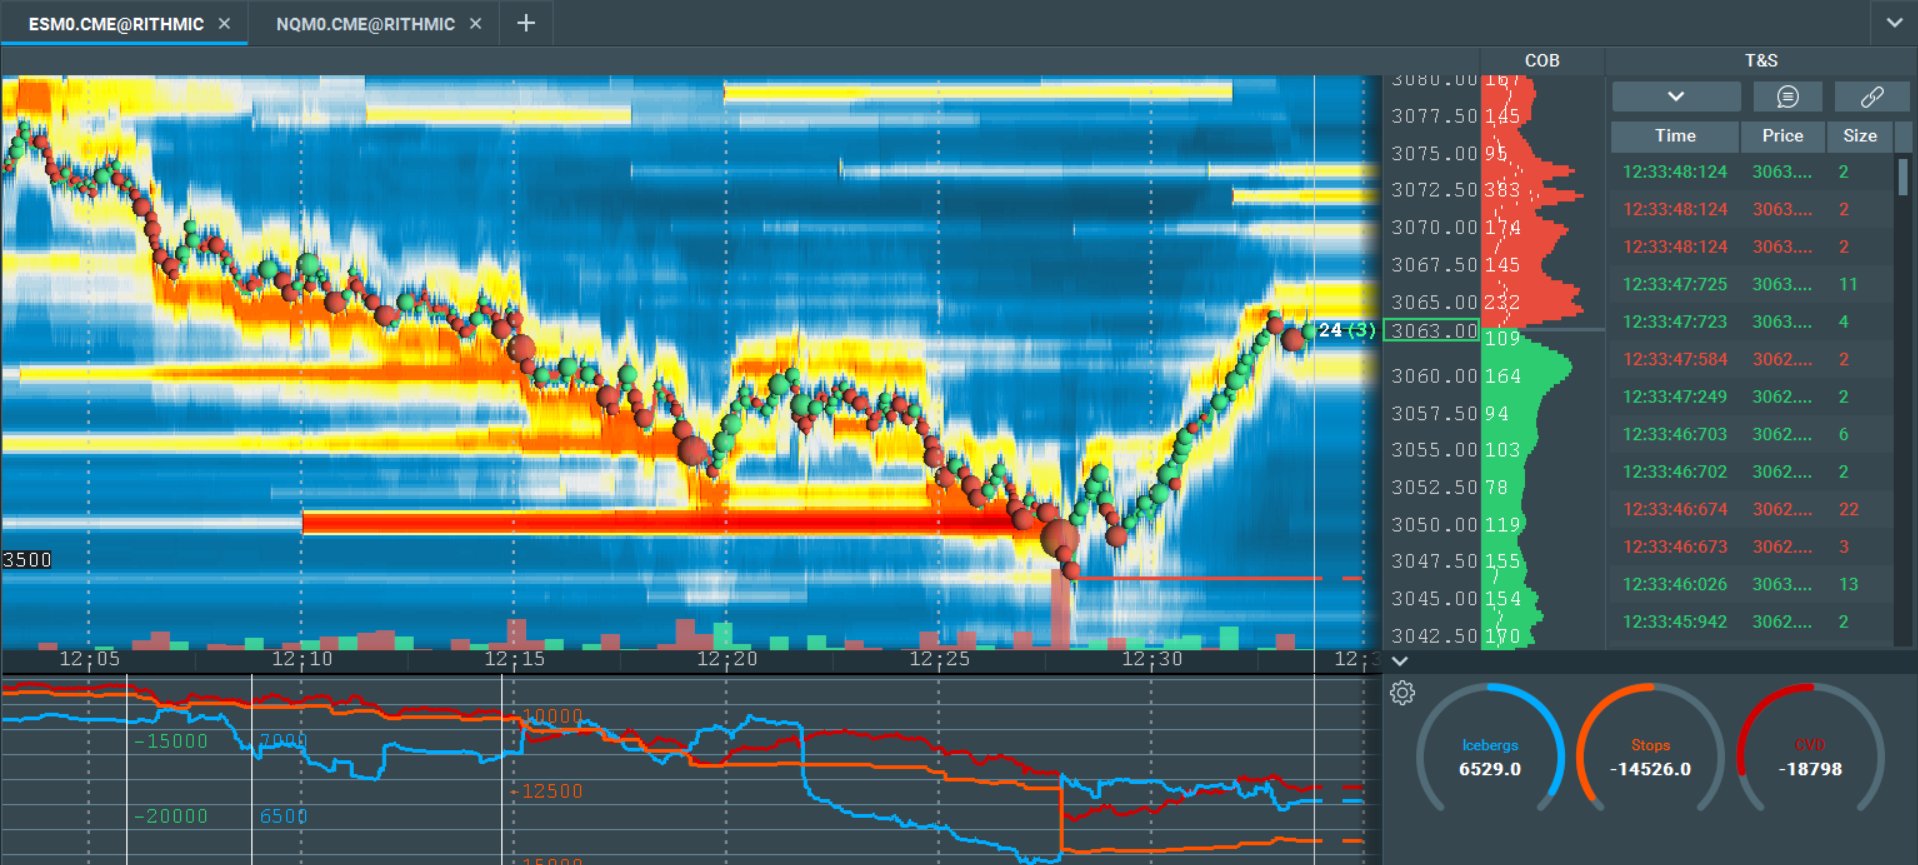
June 21, 2020 @SeanTheNoob
“Stop run to Stop run perfect trade-off @bookmap_pro,
liquidity to liquidity lil 30 point ripper.”
Sean notices the larger downside drop in the ES after 18:00. It appears to be the 6 pm eastern time Globex open. Price drops into a level of high liquidity and roughly 200 stop orders are triggered. At about the same moment roughly 300 iceberg orders transact. This is a lot at this time in the market. Notice the big spikes in the sub-chart with the Stop&Iceberg Tracker. These are native CME iceberg order transactions. Sean also has the Bookmap Gobal+ addons. It includes the synthetic Iceberg detector. Read about the difference between Native and Synthetic/Heuristic iceberg. The synthetic iceberg detector displayed 249 iceberg buy transactions, it is displayed on the main chart with the green text 249. Note it is relatively inline with the native CME MBO Iceberg Tracker output. Sean points out the sell-off price move into the 3030 high liquidity level then moves toward the other side of the range to test that area of high liquidity around 3060 for about a 30 point move. A great example of using MBO stops and icebergs data together with levels of high liquidity.
Jun 18, 2020 @bookmap_pro
“Bookmap’s Stop & Iceberg Tracker. In the order flow, the price at the bottom of the ES range but buyers are still in control of this structure. Excellent confluence from the S-I Tracker as several iceberg orders transact.”
A slightly bullish structure after 12 pm ET. More volume at higher highs as stranger buy volume begins entering the market. Looking for a price to test 3120-3125. Yet sellers manage to drop on pullbacks right into larger players waiting on the other side with iceberg orders, absorbing the selling pressure. The SI Tracker picks them up and we gain insight to their location in the structure and look for a much higher potential for the breakout to the upside.
Jun 13 @scottpulcinitr1
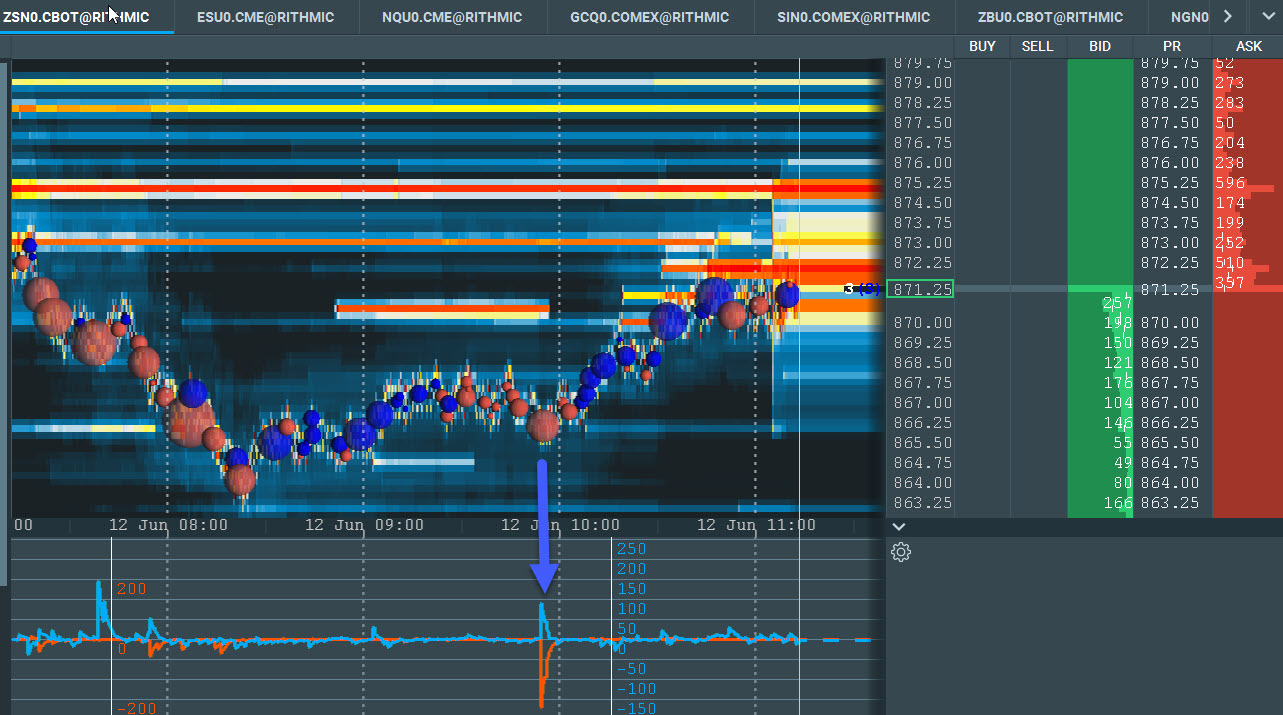
“Textbook long setup in ZS on Friday using @bookmap_pro: large sell stop runs into waiting buy icebergs, confluent with the POC and support levels on the 10, 30 and 60 min using.”
Fantastic insights from Scott trading Soybeans. He is stalking price after he sees some buying starting to emerge after the drop. A sell stop run is triggered and stop out the weaker new buyers. Yet on the other side of the trade are larger players absorbing the selling. Buying picks up and charges after higher liquidity levels on the offer. Note Scott also mentions he is watching higher time frame structural elements.
Jun 11, 2020 @livingrightco
Replying to@bookmap_pro
“Iceberg/Stops NAILED the bottom, very cool!”
The ES trends lower as it fills high levels of liquidity on the bid all the way down to the 3050 figure. Aaron notices the large stop run below the 3050 figure, as well as the larger players absorbing with buy icebergs on the other side of the trade. Once the price gets back up above the 3050 level, buyers jump in and push the price up to higher levels of liquidity around the 3060-3065 area.
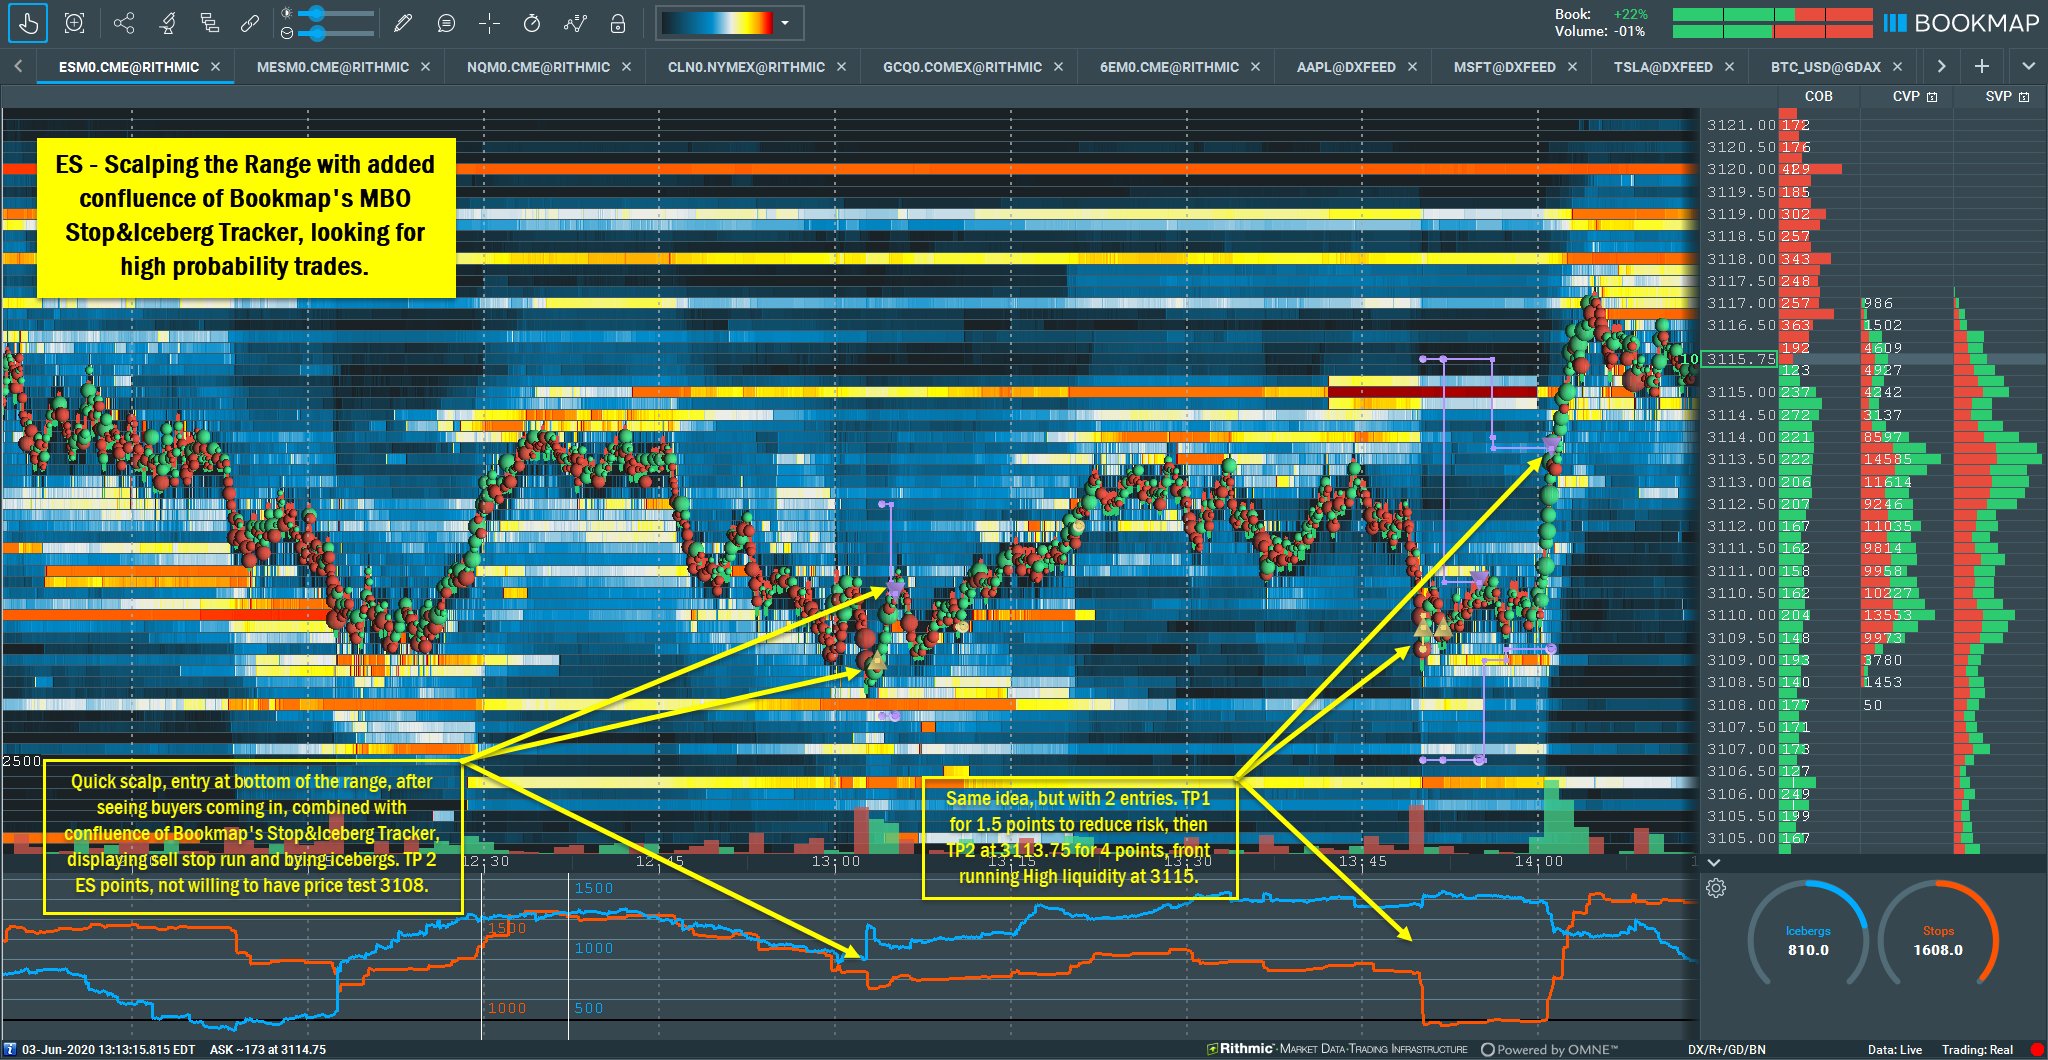
Jun 3, 2020 @FlowOrder
“Exploring a few range-bound scalps with the new Bookmap MBO Stop&Iceberg Tracker in the ES. Really adds a nice confluence for higher probability trades…”
Scalping some small ranges, testing out the S-I Tracker. Note the importance of the market structure and then look for additional confluence with the S-I Tracker. This adds to the higher probability of a positive outcome. The trader wasn’t looking to hit a home run, but carefully reduce risk with high probability trades.
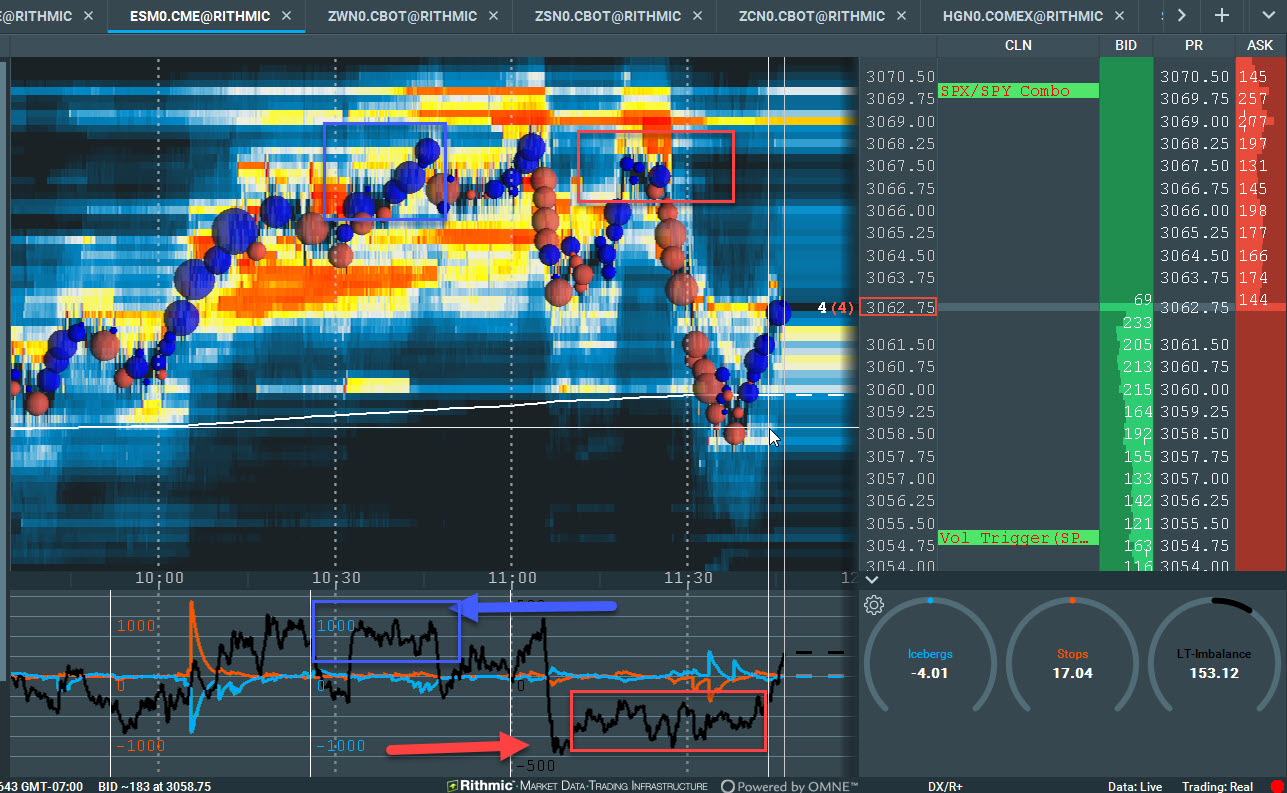
·Jun 2, 2020 @scottpulcinitr1
“That last move up to the 3067.50 area had a different look before the last sell-off if you were watching the @bookmap_pro Liquidity Tracker. Very negative vs the first time up there.”
Here Scott is carefully watching the market structure and liquidity levels. He notes the first leg and the selloff combined with a dramatic shift of the aggressive high liquidity on the offer, captured by the Liquidity Tracker Black Line in the sub-chart. This lends insight for the potential for a second leg lower, which unfolds nicely to the downside.
June 8, 2020 @SeanTheNoob
“Catching the bounce right on the chart setup I had marked out, the MBO iceberg/stop data doesn’t lie.”
Sean marks up the 3162 swing from the ES cash open and is waiting for the liquidity to at that level to transact. However, he notes a significant stop run and buy icebergs absorbing the selling in front of that high liquidity 3162 level. This is a nice trick by those iceberg traders and allows them to enter a position before the high liquidity levels waiting in the order book. A nice rally to the upside ensues and reaches for the high liquidity on the offer up at 3177.
May 27, 2020 @Wyckoff_EOD
Replying to @scottpulcinitr1
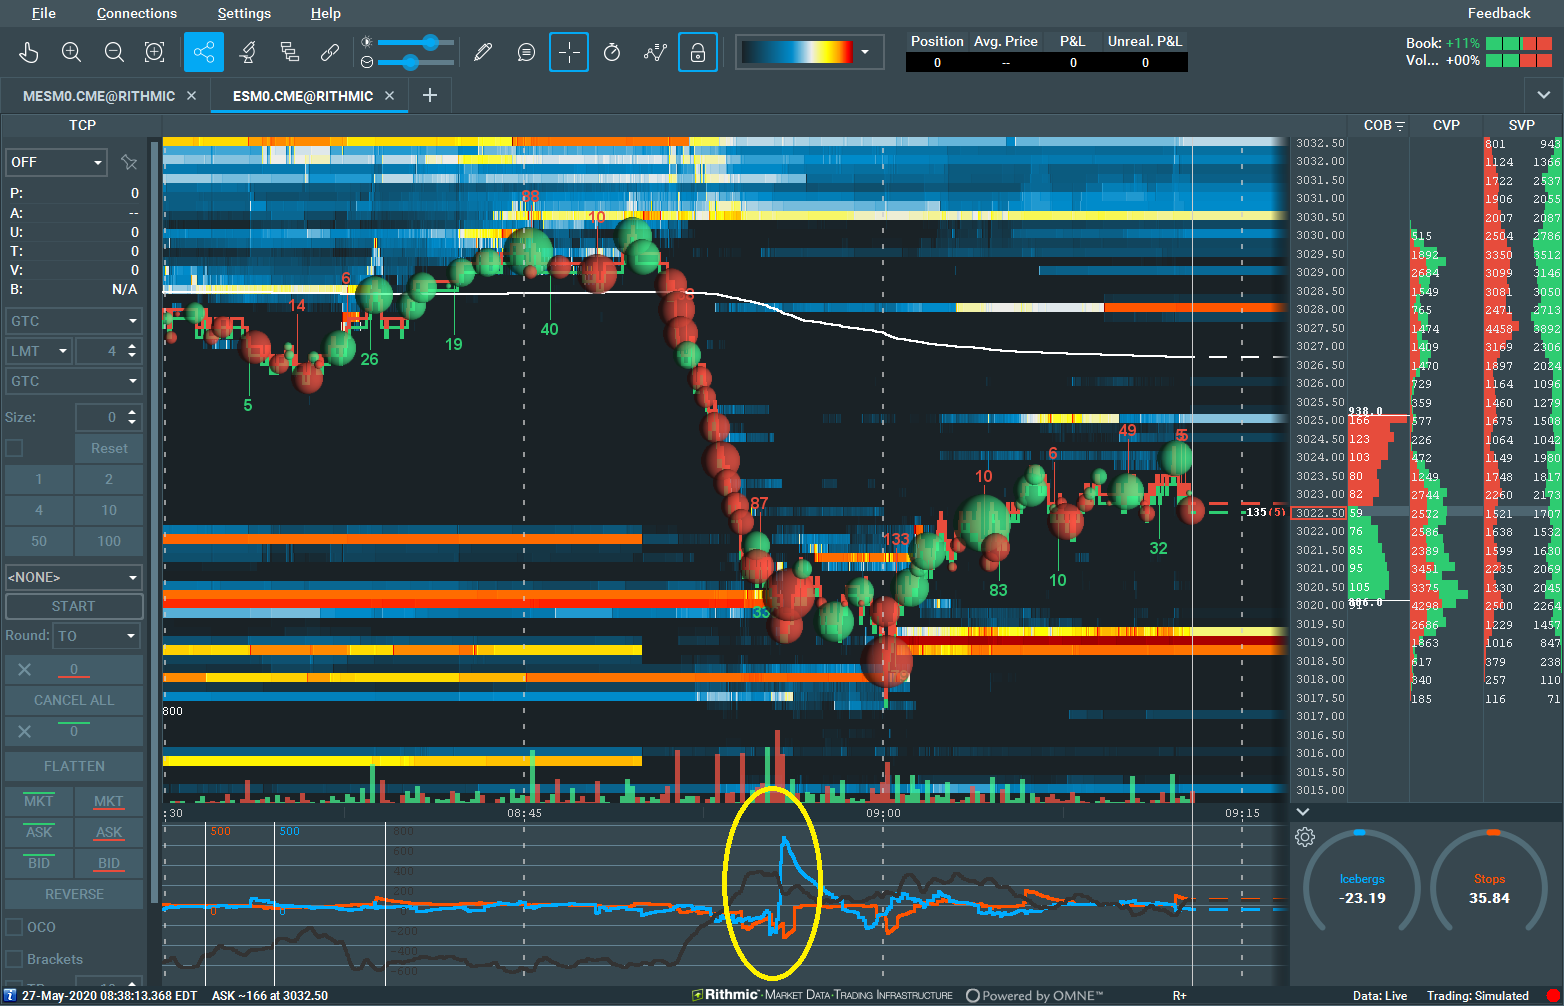
“Beautiful setup on ES this morning, thank you for introducing this to me. Your webinars are great Sir”
Another beautiful example in the ES with a strong and fast selloff into high liquidity on the bid as well as about 500 buy iceberg orders. Note the Liquidity Tracker (Blackline) also spikes upwards. The bid is strong, the selling has been absorbed, and strong aggressive buying begins to lift the offer, looking for healthy pullback to test high liquidity on the offer.
May 13, 2020 @scottpulcinitr1
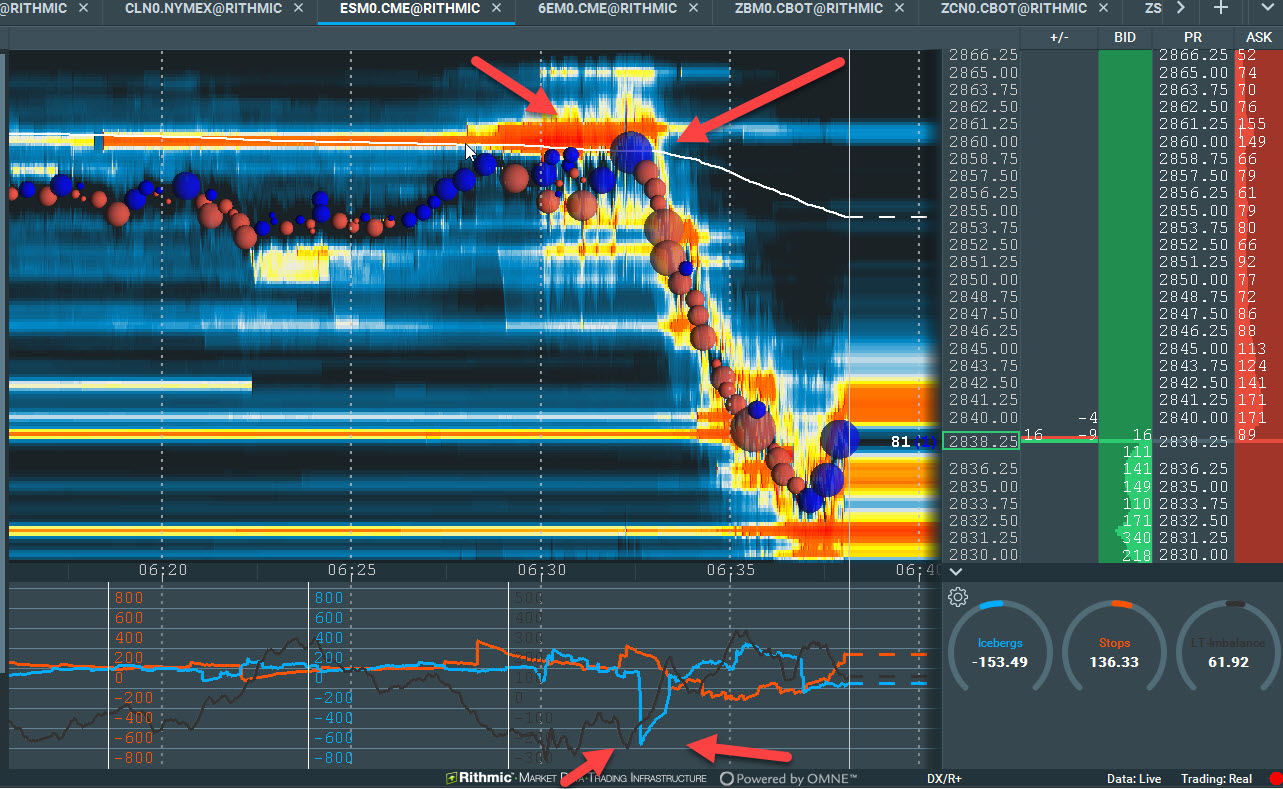
“Three of the big four @bookmap_pro indicators provided the opportunity for an incredible short that yielded almost a 30 pt trade at the ES open in minutes. Resting liquidity, Huge sell icebergs and an extreme negative liquidity tracker”
A beautiful read by Scott, who easily captured a 30 point ES trade in a handful of minutes. He had major multiple confluences as he mentions in his tweet. Note the downside area where price tested though; it’s high liquidity on the bid. It’s easy to see these levels in the Bookmap heatmap and rather challenging to read in the DOM. This allows higher time frame traders to integrate order flow within their trading.
Sign Up Now