See market activity more clearly in real time.
Compare plans to access deeper market visibility for market activity.
News & Announcements
March 28, 2024
SHARE
New Volume delta – more opportunities for volume analysis
Volume delta – is a new feature added to the traditional Volume Dots. It was requested by one of Bookmap users on the forum and now it is released and provides great contribution to volume analysis.
A short background about Volume Dots
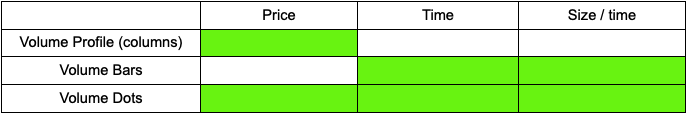
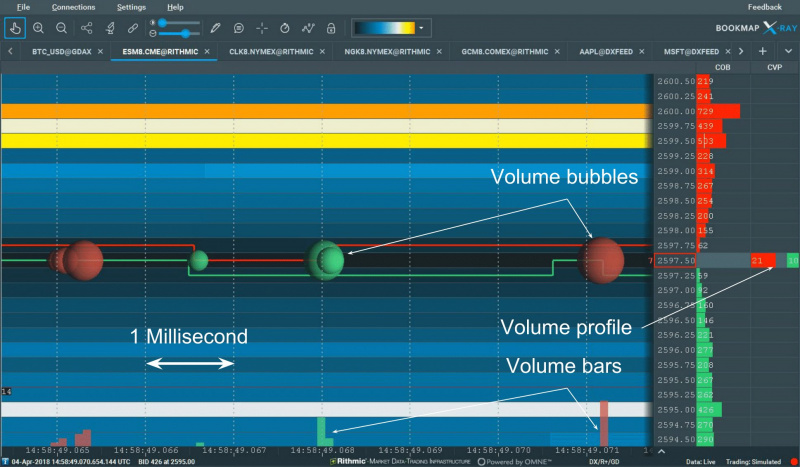
Bookmap displays transacted volume using the Volume Dots, or Bubbles. Each dot represents the aggregated volume that has been executed in time, price & size. Volume profile and Volume bars are the aggregated projection of Volume Dots onto price axis and time axis accordingly.
What is Volume delta?
It shows the delta (or difference) between aggressive buyers and aggressive sellers (buy minus sell).
Setup
You have to install the latest version 7.1 (beta). Activation is done via Volume Dots configuration window.
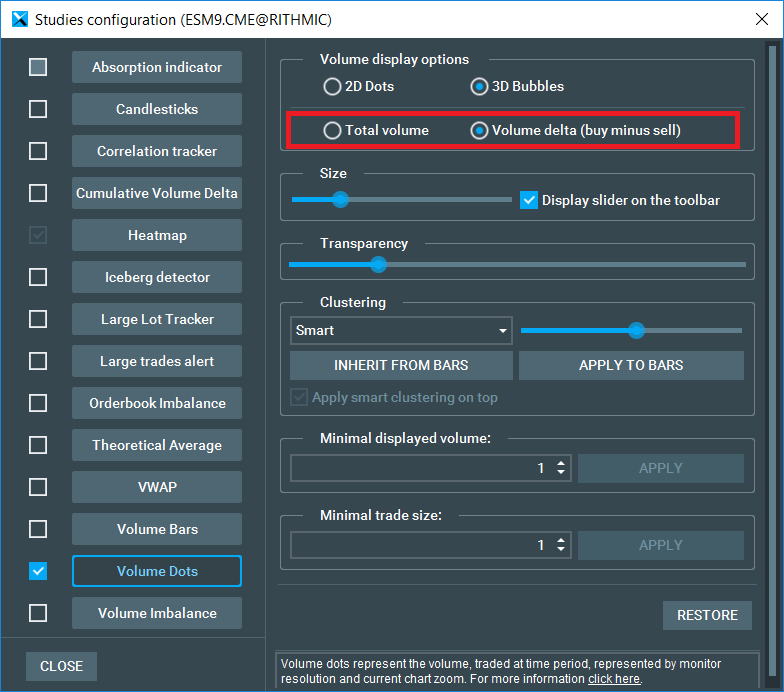
Same settings can be applied to Volume bars.
If you set the minimum traded volume to 20 it will show min delta of 20. It works with filter and also in combination with all other modes (e.g. clustering).
If you wish to see the volume delta in parallel to the total volume, you can use total volume traded via the volume bars (at the bottom of the chart) or via the columns (CVP / SVP).
The value of volume delta
The volume traded contain valuable information and many traders are using different charts and different tools such as footprint to analyze the movement on a short, intermediate or long-term basis.
One of the problems of current volume analysis tools is that they mostly are using an aggregated view, they are lagged and also hard to analyze in real time as you have to wait for the bar to build.
By using the new volume delta feature you can see more clearly the correlation between the aggressors’ activity and the price movement (e.g. how aggressor buyers cause the price to go up). Using this together with the good visualization of the liquidity provided by Bookmap, traders get a complete picture of both market status and its recent dynamics.
To see the difference, take a look at the following charts.
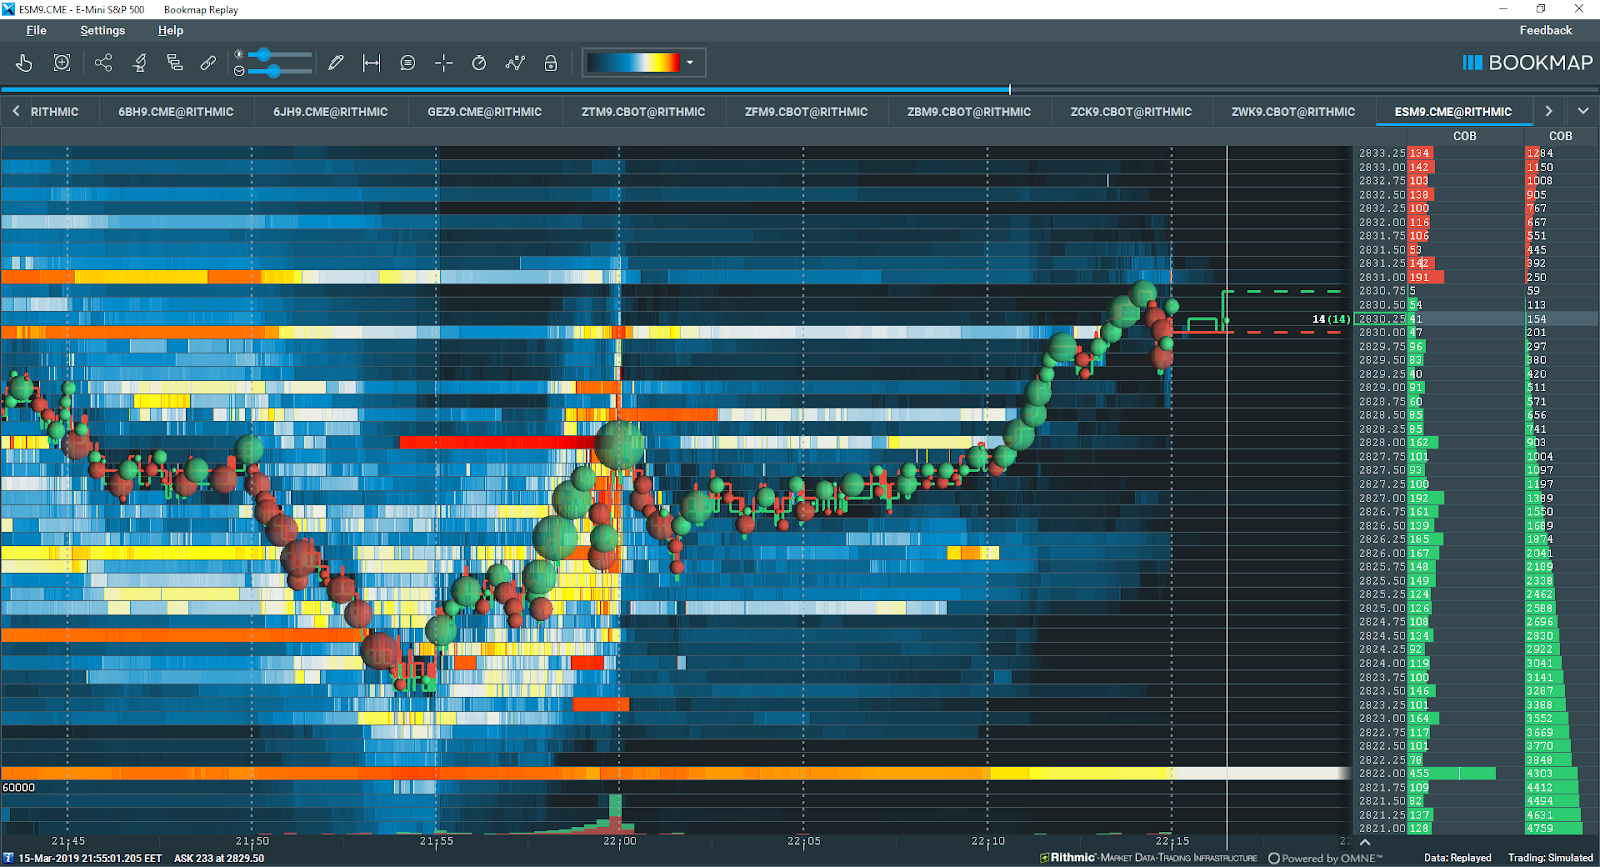
Example with regular volume dots

Same image with volume delta selected.
Pricing
Provided for free as part of all Bookmap packages (also included in the free version).
To learn more about it, and share your experience, we suggest you look at Bookmap forum
Sign Up Now