See open interest more clearly in real time.
Compare plans to access deeper market visibility for open interest.
Stocks
July 19, 2024
SHARE
Open Interest & Stocks: Understanding Market Dynamics

In financial markets, success belongs to those who can play the game of prediction. But the bigger question is how? The secret lies in using the combination of open interest and stock indicators. Both are proven market analysis techniques, and several successful traders use them to improve their trading strategies.
Have you learned the art of prediction yet?
Through this article, we will explain to you what open interest is, why it’s important, and how it differs from trading volume. Next, we will see how changes in open interest can signal future price movements in both futures and stock markets.
Also, we will explain how to combine open interest with stock volume and price trends to get a clearer picture of market dynamics. You’ll learn some practical strategies for entering and exiting trades based on these insights. Let’s get started and boost your chances of success!
A Brief Overview of Open Interest
Open interest represents the total number of outstanding futures contracts or options that have not been settled or closed. This metric is crucial in derivatives markets as it indicates the level of:
- Activity
and
- Liquidity
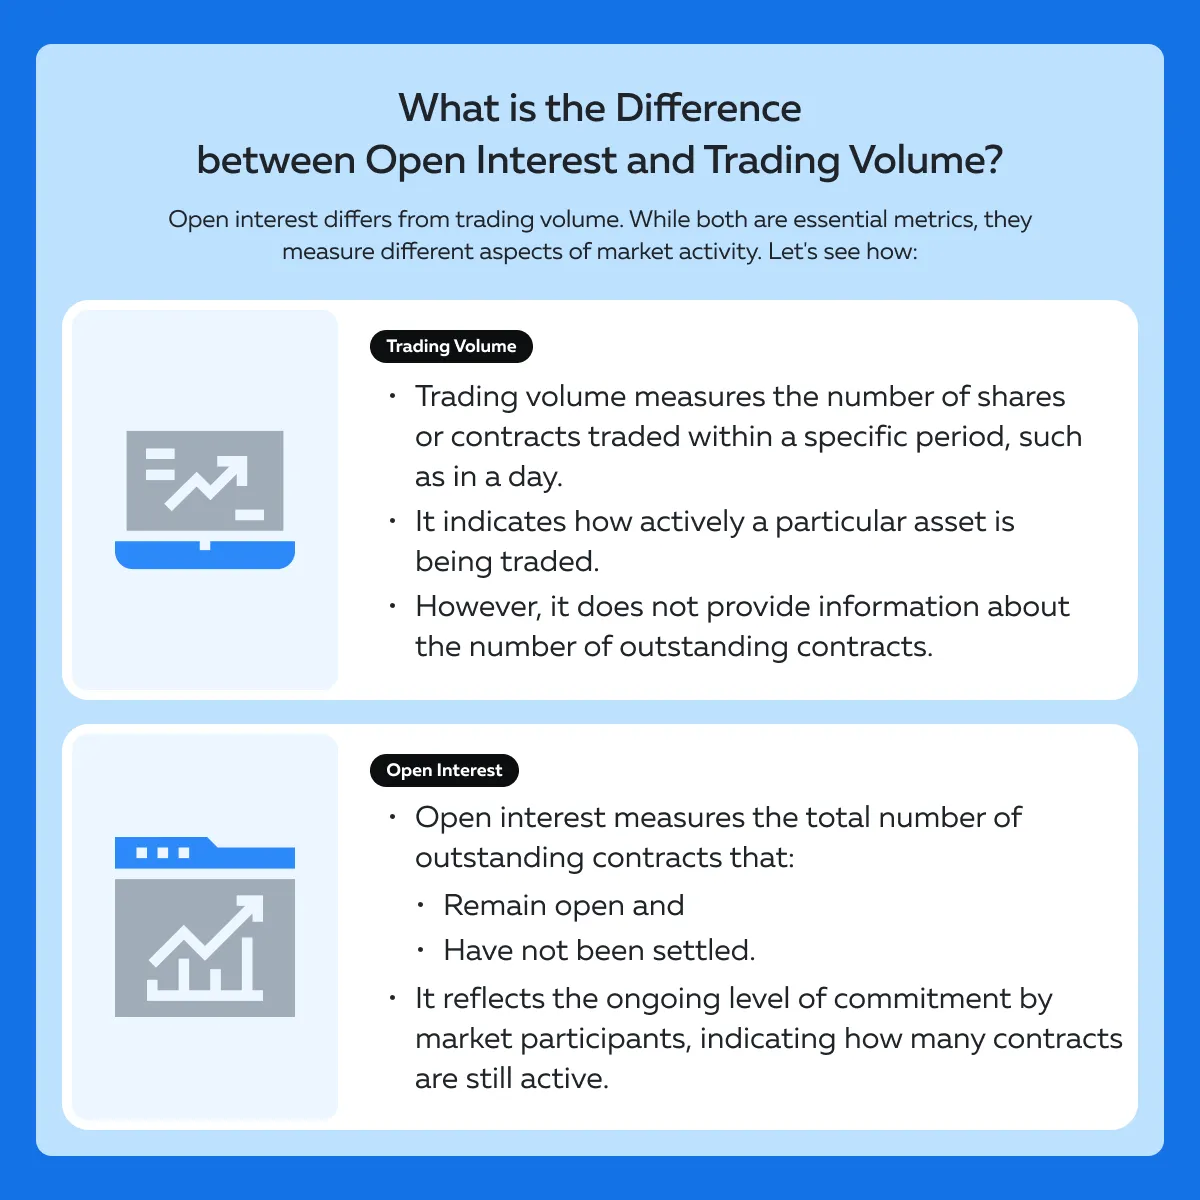
It is essential to note that a higher open interest suggests greater market interest and signals potential price movements. Also, open interest differs significantly from volume, although both are essential indicators. See the graphic below for better understanding:
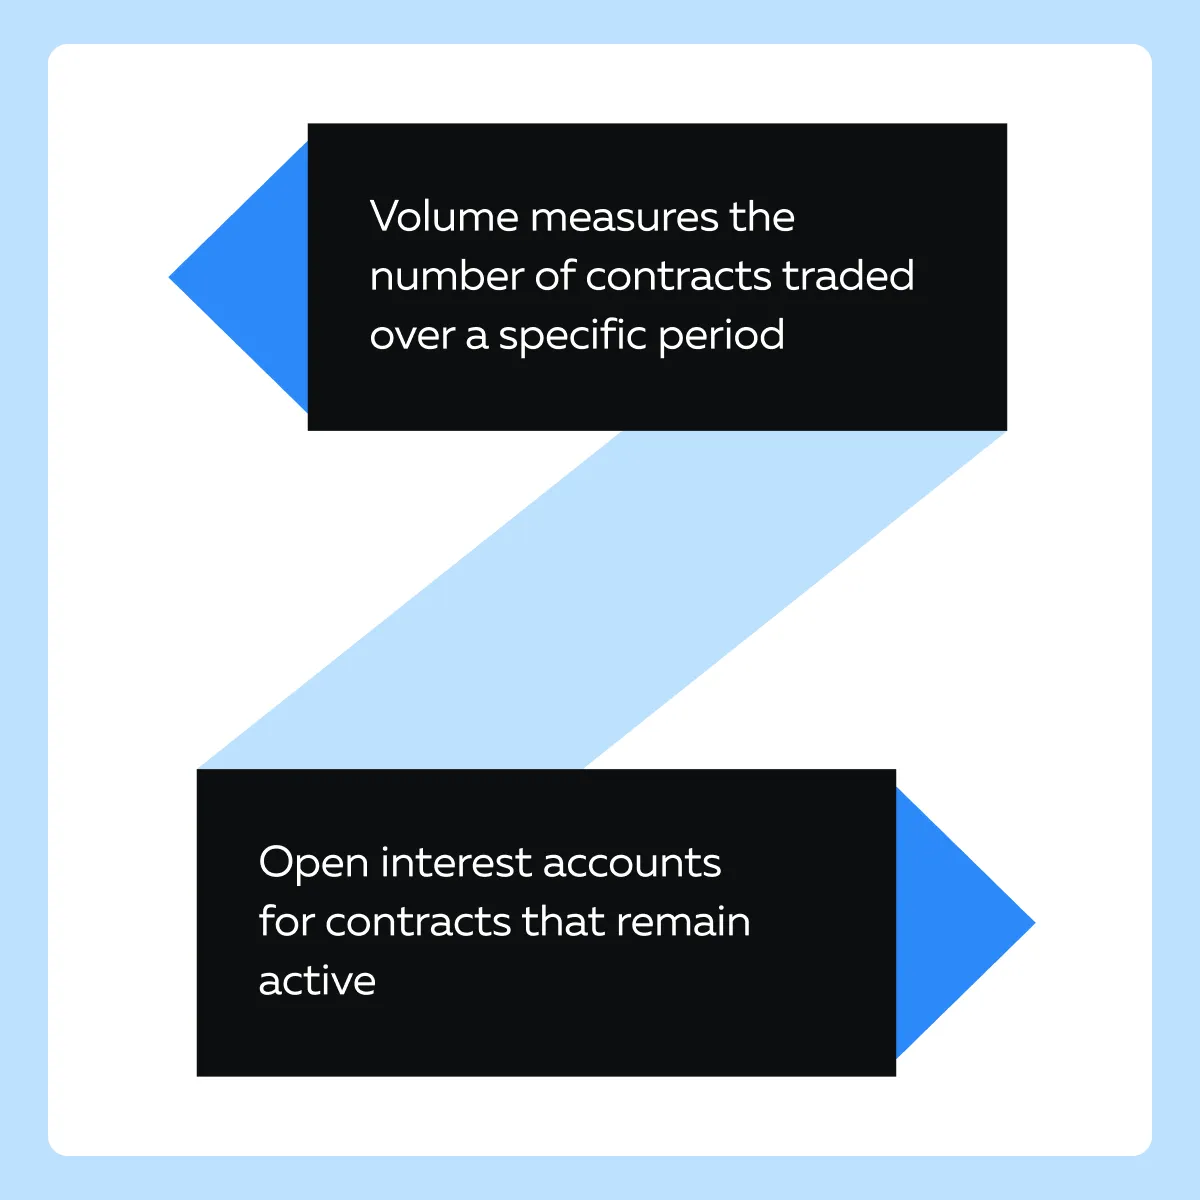
Importantly, the derivatives market operates as a zero-sum game. For every buyer of a futures contract, there is a seller, meaning gains for one party result in equivalent losses for another.
Now, to better understand open interest, let’s study the difference between stocks and futures/options.
| Stocks | Futures/options |
|
|
How to Interpret Open Interest?
A spike in open interest indicates increased activity and interest in a particular futures or options market. Such a spike suggests that:
- More participants are entering positions
and
- They are expecting significant price movements.
Most traders and analysts closely monitor open interest to gauge market sentiment and potential volatility.
How Open Interest is Used as a Measure of Flow and Commitment?
Open interest is a measure of market flow and commitment. When traders open new positions, open interest increases. Conversely, when traders close their positions, open interest decreases. This information provides insight into the strengthening or weakening of a market trend. Read the table below:
| Increasing Open Interest | Decreasing Open Interest |
a) Traders are committing more capital. b) They are expecting the trend to persist. |
and
|
What is the Role of Open Interest in Market Analysis?
It is noteworthy to state that open interest is a crucial indicator for traders. Let’s see how it is such a great help:
- Market Sentiment
- It helps gauge market sentiment by showing the:
- Level of participation
- It helps gauge market sentiment by showing the:
and
- Interest in a particular contract.
- A high open interest usually signals strong interest and activity.
- Whereas low open interest indicates lackluster engagement.
- Trend Confirmation
- Increasing open interest during a price move confirms the strength of the trend.
- For example,
- Say the market is rising.
- Now, if both price and open interest are increasing, it suggests that the uptrend is robust.
- Conversely, if open interest declines as prices rise, it suggests a weakening trend.
- Liquidity Indicator
- High open interest means more liquidity.
- This makes it easier for traders to enter and exit positions without significantly impacting the price.
- This is particularly important for large traders and institutions.
Understanding Stock Movements
It is pertinent to note that stock trading involves several key components. Each component reflects different aspects of market dynamics. Among these, volume and price action are paramount in:
- Understanding market sentiment
and
- Predicting future movements.
How is Volume a Primary Indicator of Market Activity?
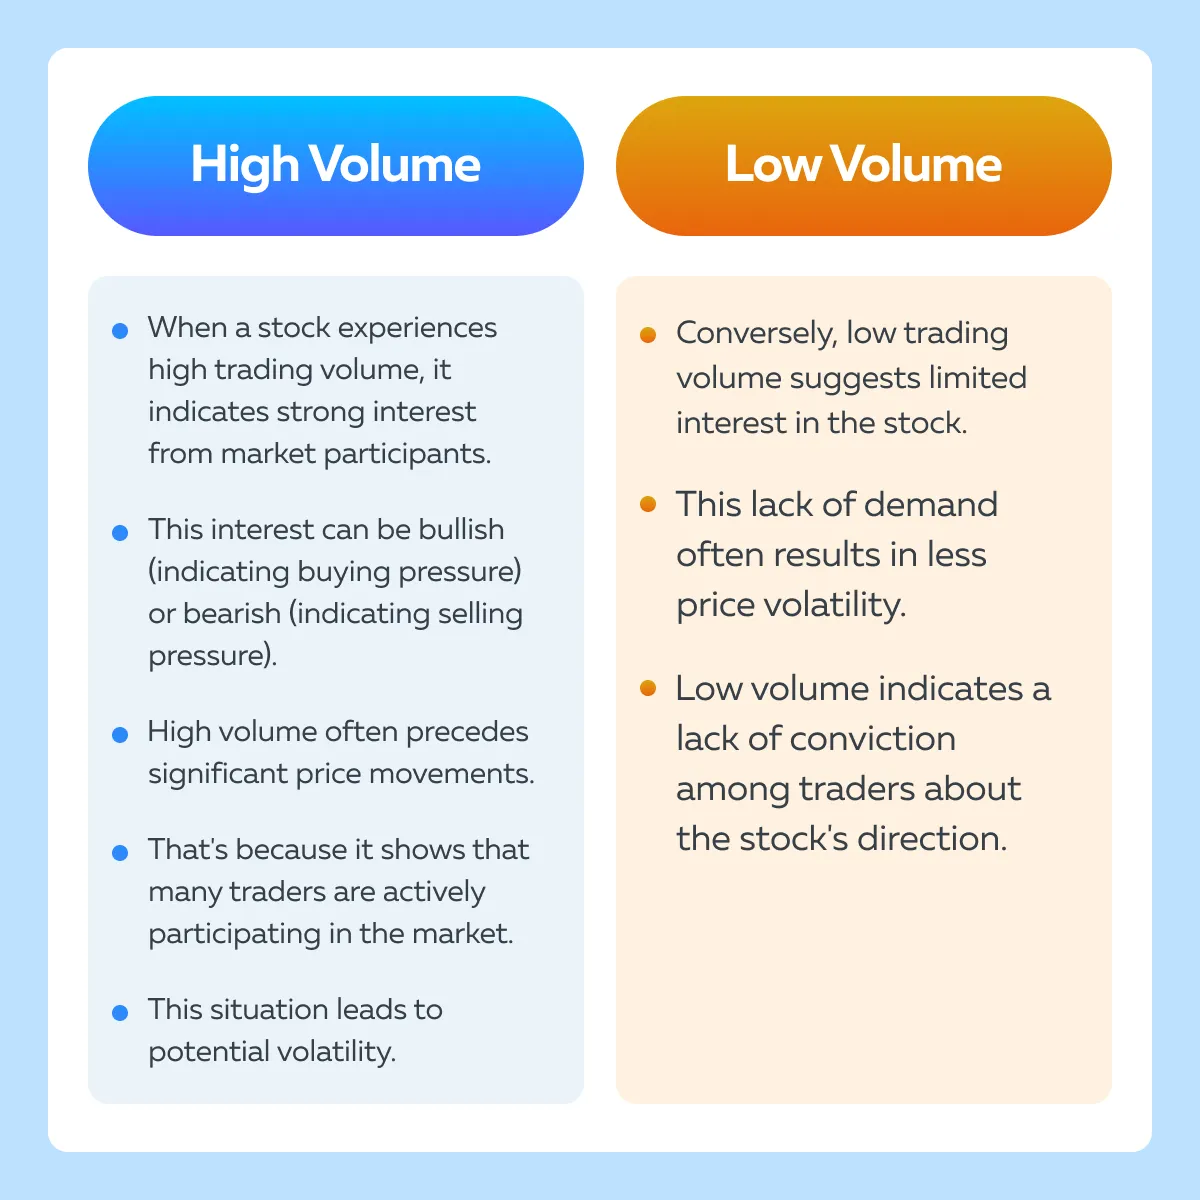
For the unaware, volume measures the number of shares traded during a specific period, typically in a day.
It is a critical indicator of market activity and interest in a particular stock. Let’s see how traders interpret it:
How to Use Price Action to Interpret Market Behavior?
Price action refers to the fluctuations in the price of a stock over time. Traders analyze price action to:
- Understand market sentiment
and
- Make predictions about future price movements.
Numerous studies have shown that analyzing various patterns and formations provides insights into the market’s psychology. Let’s see how:
| Head and Shoulders | Flags and Pennants | Gaps |
|
|
|
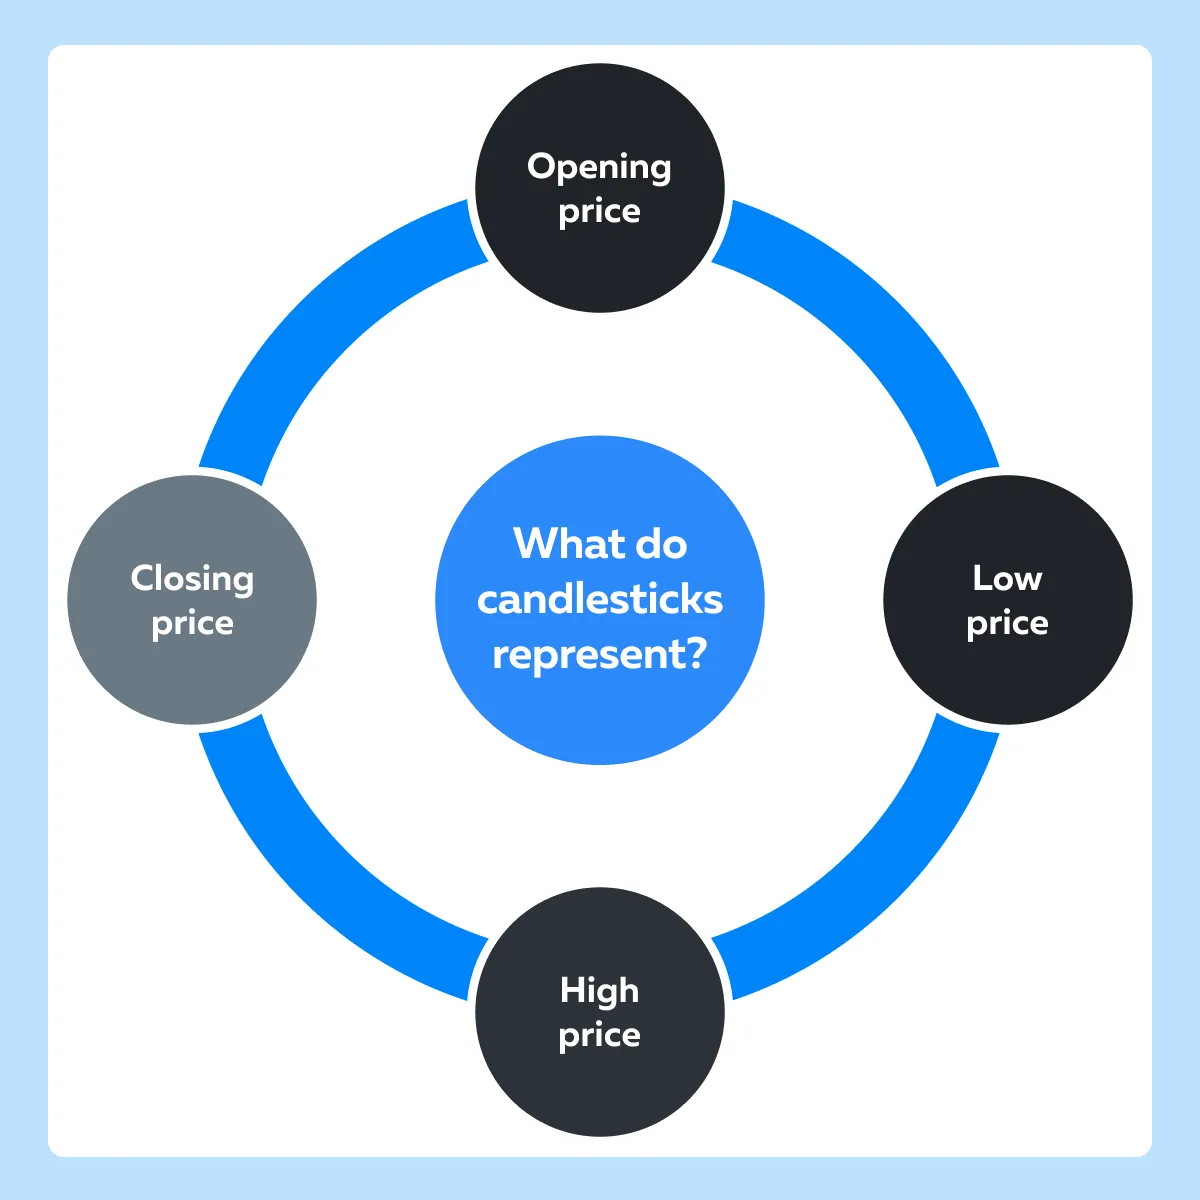
How Do Candlestick Formations Reveal Market Sentiment?
Candlestick charts are a popular tool among traders. They provide visual insights into market sentiment. Each candlestick represents a specific period’s price action. See the graphic below to understand what it represents:
Now, let’s have a look at some key formations and their indications:
- Doji
- A doji candlestick has nearly the same opening and closing prices.
- It indicates market indecision.
- Depending on its position on the chart, it signals a potential reversal or continuation.
- Hammer and Hanging Man
- Both have small bodies and long lower shadows.
- A hammer, appearing after a downtrend, suggests a potential bullish reversal.
- Whereas a hanging man, appearing after an uptrend, signals a potential bearish reversal.
- Engulfing Patterns
- Bullish engulfing patterns occur when a small bearish candle is followed by a large bullish candle that completely engulfs the previous one.
- It indicates a potential reversal to the upside.
- Bearish engulfing patterns work in the opposite way.
- They suggest a potential downside reversal.
- Bullish engulfing patterns occur when a small bearish candle is followed by a large bullish candle that completely engulfs the previous one.
How to Predict Using Moving Averages?
Moving averages (MAs) are used to:
- Smooth out price data
and
- Identify trends.
MAs average the prices over a specific period. By doing so, they filter out the “noise” from random price fluctuations and focus on the underlying trend. Let’s study two of its major types:
- Simple Moving Average (SMA)
- It represents the average price over a specified period of time.
- For example, a 50-day SMA averages the closing prices of the last 50 days.
- Exponential Moving Average (EMA)
- It represents the weighted average that gives more importance to recent prices.
- Thus, it is more responsive to new information.
What are Moving Average Crossovers?
Moving average crossovers are crucial signals for potential market entries and exits. This is how they help traders:
- Golden Cross
- It occurs when a short-term moving average (e.g., 50-day SMA) crosses over a long-term moving average (e.g., 200-day SMA).
- This crossover is mostly seen as a bullish signal.
- It indicates a potential upward trend.
- Death Cross
- It occurs when a short-term moving average crosses below a long-term moving average.
- This crossover is usually interpreted as a bearish signal.
- It suggests a potential downward trend.
Analyzing Market Dynamics Through Open Interest and Stocks
By using correlations between open interest and stock price movements, traders can predict market sentiment. Open interest is a powerful indicator in derivatives markets. That’s because changes in open interest often precede or confirm moves in related stock markets. Let’s understand this correlation in detail.
General Observations Related to Open Interest and Price Trends
There are several general observations about the correlation between open interest and stock price movements. Let’s check them out:
| Increasing Open Interest and Rising Prices | Increasing Open Interest and Falling Prices |
|
|
How to Use Open Interest Trends to Identify Stock Market Movements?
Stock traders can gain valuable insights by analyzing open interest trends in related futures markets, particularly for sectors closely aligned with commodities or financial indices:
- Sector Alignment
- Sectors like mining, agriculture, and energy are closely tied to commodity futures.
- For example:
- Say there are significant changes in open interest in gold futures.
- Now, this situation provides early signals for movements in mining stocks.
- Financial Indices
- Futures on financial indices like the S&P 500 offer a broader view of market sentiment.
- Rising open interest in S&P 500 futures, combined with bullish price action, is an early indicator of a positive outlook for the broader stock market.
How to Forecast Stock Price Movements?
Most traders use changes in open interest to forecast stock price movements. They do so by examining the dynamics between futures markets and related stocks. Let’s see how:
- Monitoring Futures Markets
- Traders keep a close eye on open interest trends in futures markets relevant to their stocks of interest.
- For example, a trader focusing on energy stocks will monitor open interest in crude oil futures.
- Correlating Trends
- They correlate these trends with stock price movements.
- Increasing open interest in futures combined with rising stock prices suggests a strong bullish sentiment.
- On the other hand, increasing open interest with falling stock prices indicates bearish sentiment.
- Trading Decisions
- Based on these correlations, traders make decisions about entering or exiting positions.
- For example,
- Say traders observe rising open interest in S&P 500 futures.
- They take long positions in a broad range of stocks.
- That’s because they are anticipating a bullish market.
Case Study: Gold Futures and Mining Stocks
To better understand how traders use open interest to forecast stock price movements, consider the following example:
Rising Open Interest in Gold Futures
- Suppose there is a significant rise in open interest in gold futures.
- This rise is accompanied by increasing prices.
- This situation suggests that traders are confident in a continued bullish trend for gold.
Impact on Mining Stocks
- Traders who monitor this trend are anticipating a rally in mining stocks, which are closely tied to the price of gold.
- As a result, they take long positions in mining stocks.
Confirmation
- Following the increase in open interest and price in gold futures, mining stocks begin to rally.
- This movement is validated by:
- Increased trading volumes
and
- Bullish price action in those stocks.
Case Studies
Let’s have a look at two hypothetical scenarios:
Example 1: Rising Open Interest in Oil Futures and Energy Sector Stocks
Background
In early 2022, traders observed a notable increase in open interest in oil futures contracts. This rise in open interest coincided with geopolitical tensions and supply constraints that were driving up oil prices.
Analysis:
- Rising Open Interest and Oil Prices
- The increase in open interest, along with rising oil prices, indicated that more traders were entering long positions.
- They expected the bullish trend to continue.
- Impact on Energy Stocks
- Energy sector stocks, particularly those of companies involved in oil exploration and production, started to gain traction.
- Investors interpreted the increased open interest as a sign that oil prices would remain high.
- This event boosted the profitability of these companies.
Market Reaction:
- Stock Price Movements
- Companies like ExxonMobil, Chevron, and Schlumberger saw significant price increases.
- For example,
- ExxonMobil’s stock price rose by 15% over a two-month period.
- That’s because oil prices surged and open interest in oil futures continued to climb.
- Volume Confirmation
- Trading volumes in these energy stocks also increased.
- This confirmed the bullish sentiment driven by the rising open interest in oil futures.
Lessons Learned
The rise in open interest in oil futures acted as a precursor to significant movements in energy sector stocks. This case shows the predictive nature of open interest, as it helped traders anticipate a sustained bullish trend in the energy market.
Example 2: Declining Open Interest in Treasury Futures and Financial Sector Stocks
Background
In mid-2023, a noticeable decline in open interest in U.S. Treasury futures was observed. This period coincided with rising interest rates and concerns about economic slowdown.
Analysis
- Declining Open Interest and Treasury Prices
- The decrease in open interest suggested that traders were closing out their positions in anticipation of further declines in Treasury prices, which are inversely related to interest rates.
- Impact on Financial Stocks
- Financial sector stocks, particularly those of banks and investment firms, started to show weakness.
- Higher interest rates reduced the demand for loans.
- They also impacted the profitability of financial institutions.
Market Reaction
- Stock Price Movements
- Major financial institutions like JPMorgan Chase, Bank of America, and Goldman Sachs saw their stock prices decline.
- For example,
- JPMorgan Chase’s stock fell by 10% over three months.
- That’s due to declining open interest in Treasury futures.
- This fall pointed to a bearish outlook for the financial sector.
- Volume Confirmation
- Trading volumes in these financial stocks increased during the sell-off.
- This surge indicated a strong bearish sentiment.
- It confirmed the signals from the futures market.
Practical Trading Strategies Using Open Interest and Stock Indicators
Several successful traders follow strategies for using open interest data to inform stock trading decisions. These commonly include specific setups for entering and exiting trades based on open interest trends. Let’s study these strategies in detail:
Strategy 1: Entering Long Positions with Rising Open Interest and Prices
- Identify Trend Alignment:
- Rising Open Interest:
- Look for a consistent increase in open interest.
- This event indicates that:
- New money is flowing into the market
- Rising Open Interest:
and
- Traders are taking new positions.
- Rising Prices:
- Ensure that the stock price is also increasing.
- This situation confirms a bullish trend.
- Volume Confirmation:
- High trading volume, alongside rising open interest and prices, strengthens the bullish signal.
- It suggests strong market participation and conviction.
- Entry Setup:
- Entry Point
- Enter a long position when open interest and prices have been rising for several days, and volume remains high.
- Stop-Loss
- Set an initial stop-loss below a recent support level to manage risk.
- Entry Point
- Exit Strategy:
- Take Profits
- Exit the position if open interest starts to decline while prices are still rising.
- Do this because this situation indicates weakening bullish sentiment.
- Take Profits
- Reversal Signal
- Consider taking a short position if both open interest and prices start falling along with decreasing volume.
Strategy 2: Combining Open Interest with Stock Volume and Price Indicators
- Integrated Analysis:
- Open Interest Trends: Monitor open interest for signals of increasing or decreasing market participation.
- Volume Trends: High volume confirms the strength of the trend indicated by open interest.
- Price Action: Analyze price movements and patterns (e.g., breakouts, support, and resistance levels).
- Avoiding False Signals:
- Cross-reference open interest trends with volume and price action to avoid acting on false signals.
- For example, rising open interest with low volume might not be as strong a signal as rising open interest with high volume.
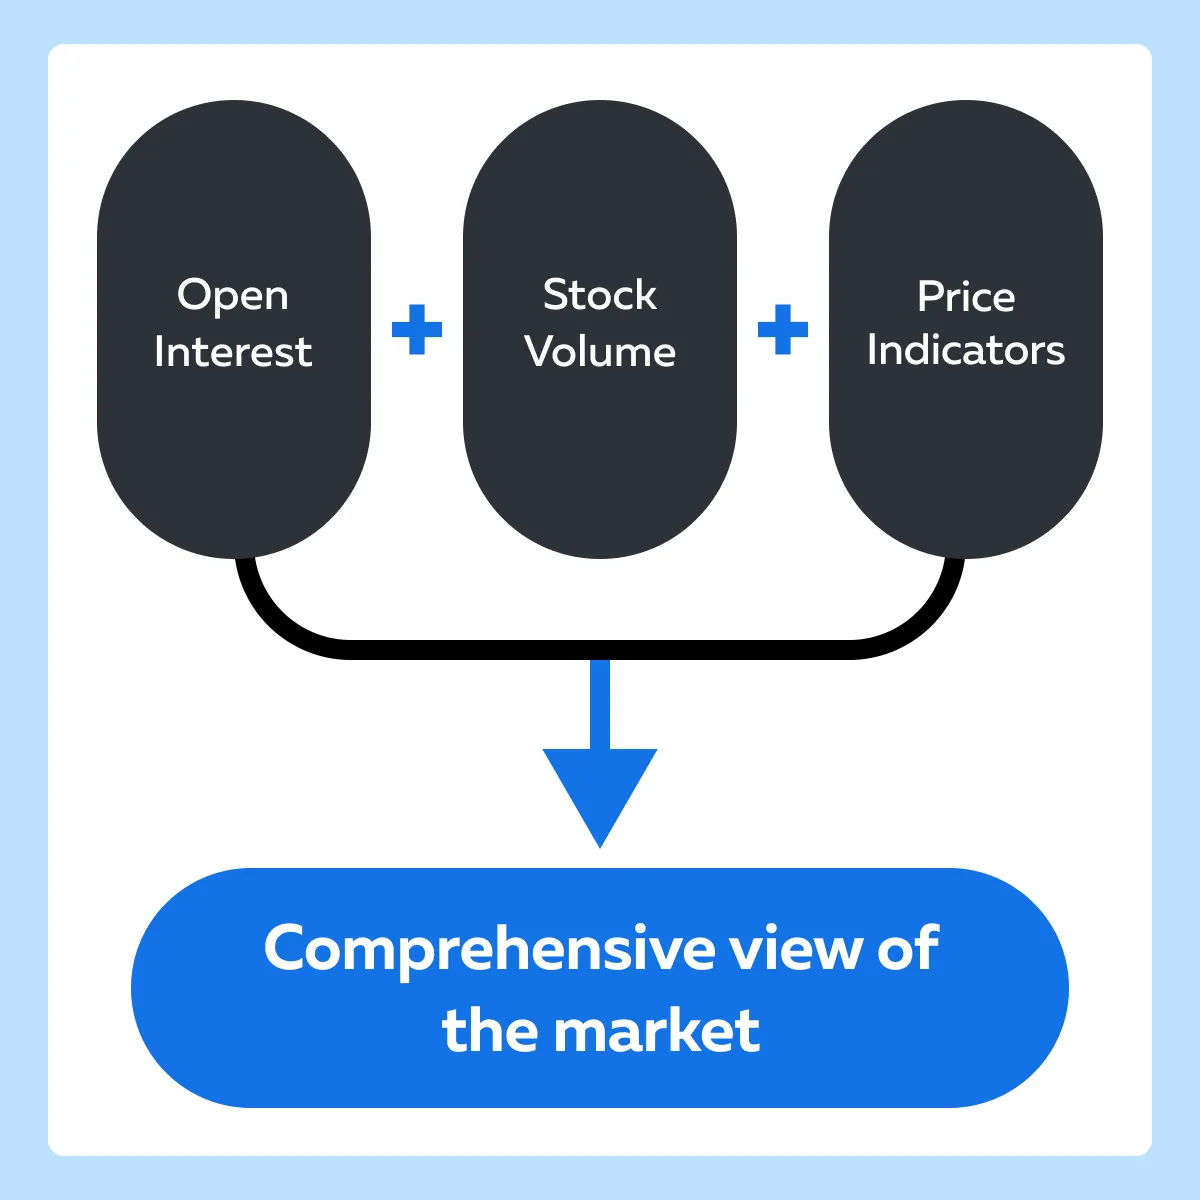
How Can Traders Gain a Comprehensive View of Market Dynamics?
It is significant to mention that by combining open interest with stock volume and price indicators, traders can gain a more holistic view of market dynamics. This view substantially enhances prediction accuracy and trading success.
Let’s learn how this holistic view helps traders:
- Enhanced Predictive Power
- Integrated analysis helps traders understand the underlying forces driving price movements.
- For example,
- Say both open interest and volume are rising.
- This situation suggests a strong conviction.
- It reduces the likelihood of false breakouts.
- Better Trend Confirmation
- Confirm trends by ensuring that all three indicators (open interest, volume, and price) align.
- This multi-faceted approach improves the reliability of trading signals.
Learn Practical Usage Through a Scenario
Let’s study a hypothetical example in which a trader initiated a long position on a tech stock.
Background: A trader is monitoring a tech stock showing signs of a bullish breakout. The following conditions are observed:
- Open Interest: Significant increase over the past week
- Price Action: Stock breaks out above a key resistance level
- Volume: Surge in trading volume during the breakout
Trading Strategy:
- Entry Point
- The trader enters a long position as the stock price breaks above the resistance level with:
- High volume
- The trader enters a long position as the stock price breaks above the resistance level with:
and
- Increasing open interest.
- This situation confirms the bullish trend.
- Trailing Stop-Loss
- The trader sets an initial stop-loss just below the breakout level to manage risk.
- They implement a trailing stop-loss to lock in gains as the stock price moves higher.
- For example,
- The trader set the trailing stop at 5% below the current price.
- This placement will help them protect against sudden reversals while allowing for upward movement.
-
- Monitoring the Trade
- The trader continuously monitors
- Open interest,
- Volume, and
- Price action.
- The trader continuously monitors
- Monitoring the Trade
- If open interest and volume continue to rise, they maintain the position.
-
- Also, they adjust the trailing stop-loss upward as the stock price increases.
- This will help them maximize gains and protect profits.
- Exit Strategy:
- The trader exits the position upon observing a sharp decline in open interest.
- This situation signaled a potential weakening of the bullish trend.
- Now, the trader uses the trailing stop-loss to exit automatically if the stock price falls by the set percentage.
- This helps in protecting against sudden reversals.
Conclusion
Understanding open interest and stock movements significantly enhances trading strategies. By analyzing open interest trends alongside volume and price action, traders gain a comprehensive view of market sentiment. Traders must note that rising open interest with increasing prices and high volume suggests a strong bullish trend while rising open interest with falling prices indicates a bearish trend.
Combining these insights helps confirm trends and avoid false signals. For example, a trader might enter a long position when open interest, volume, and price all point to a bullish breakout, using a trailing stop-loss to manage risk and protect gains.
Integrating open interest with stock indicators provides a robust framework for making informed trading decisions. Also, it leads to improved accuracy and success in the market. To gain more information on open interest, please read our exclusive article, Understanding Open Interest in Trading.
Sign Up Now