See stop runs more clearly in real time.
Compare plans to access deeper market visibility for stop runs.
Education
September 24, 2025
SHARE
Stop Runs & Liquidity Traps: How the Market Flushes Out Weak Hands
Do you know the market has one favorite hobby? It grabs your stops before going exactly where you thought it would. It’s frustrating, yes—but is it random? Not at all.
That’s simply how the auction works! Big players need counterparties, and stop runs or liquidity traps are ways to provide them with those counterparties. These processes flush weak hands and allow the price to move without any pressure/bottlenecks.
Want to start seeing stops and traps as opportunities and not shakeouts? In this article, you will learn what stop runs are, why liquidity traps trick even seasoned traders, and how you can spot and trade them confidently.
What Are Stop Runs?
A stop run happens when the market suddenly pushes into a price zone where many traders have placed stop-loss orders. These stops automatically turn into market orders! The effect? Due to such conversion, they provide an instant burst of liquidity.
Big players (like institutions, hedge funds) often know where these clusters of stops are. So, they push prices into these zones to get their large trades filled without suffering any slippage.
Do you think it’s random or malicious? Nope! It’s simply how the auction market finds liquidity.
Why Do Stop Runs Reverse?
Be aware that when a stop run happens, all those stop-loss orders get triggered at once. As mentioned above, these stops instantly provide liquidity because they turn into market orders (buyers or sellers rushing in).
But here’s something worth noting! Once that liquidity is consumed, the market has to decide:
Does it have enough fresh interest to keep moving in the same direction, or not?
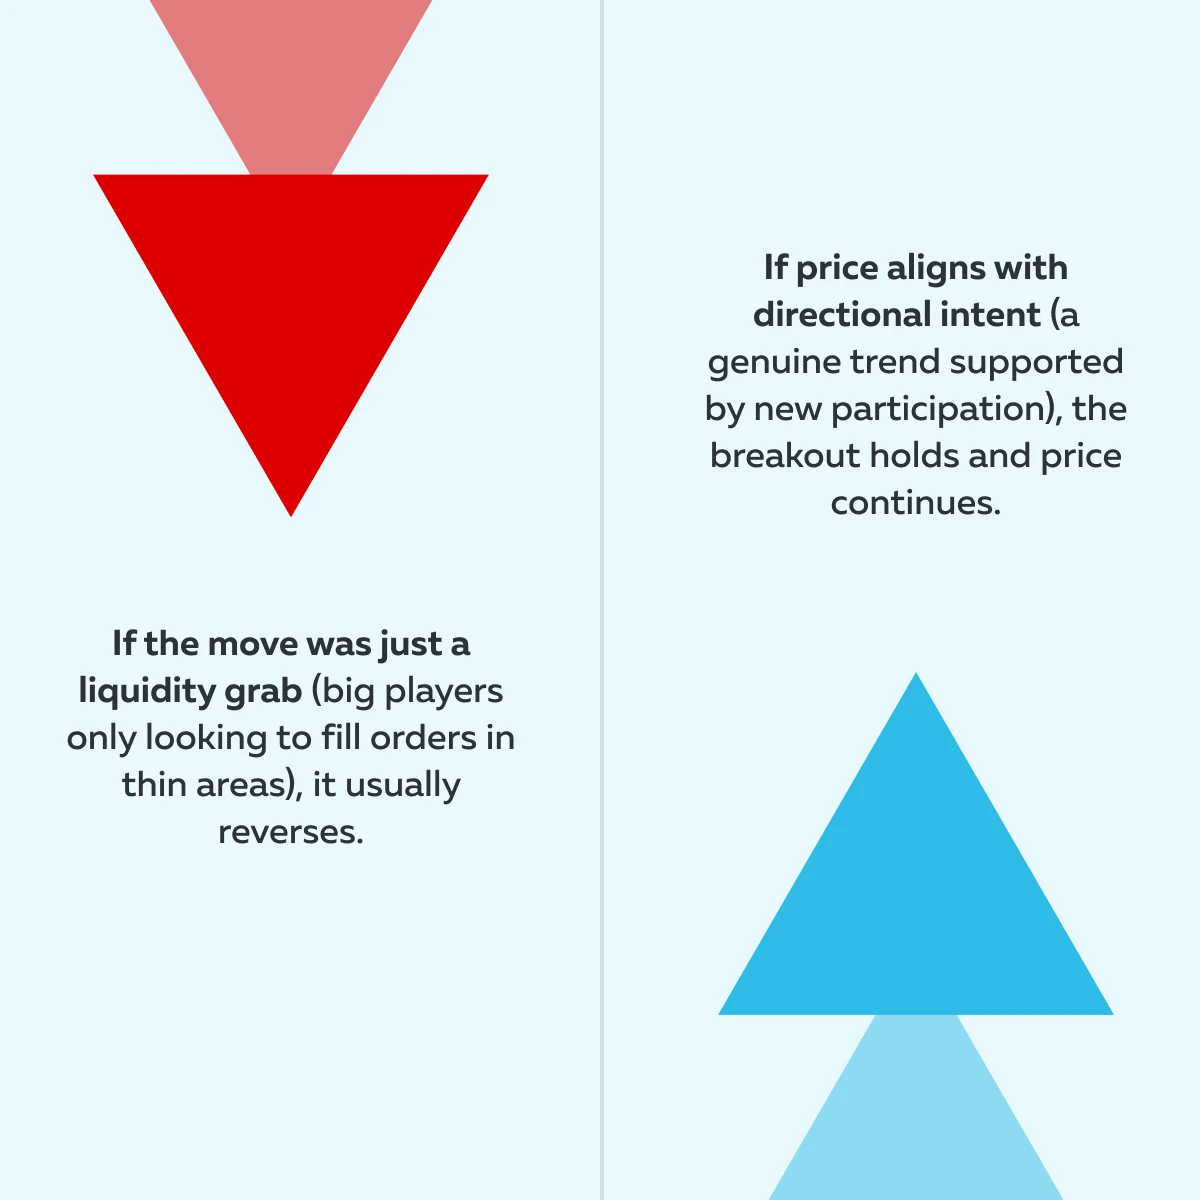
Now, based on this decision, there could be two prominent cases:
| Case 1: Snap Back (Reversal) | Case 2: Continuation (Acceptance of New Level) |
|
|
So, the difference lies in intent! Check out how trading intent (of stop-runs) influences price:
For more clarity, let’s study an example:
- In ES futures, the previous day’s high often has a lot of stop orders sitting above it.
- As a result, initially, the price shoots up to trigger those stops.
- However, the orders only get reversed and drop back into the range.
Learn which tools are included in each Bookmap package.
Liquidity Traps and False Breakouts
To most traders, a liquidity trap looks like a “breakout.” Based on this interpretation, many traders jump in and participate. Now, traders who placed stop-loss orders near that level get forced out of their positions. The impact? A sudden burst of orders is created, giving bigger players the needed liquidity.
Need more clarity? Check out the real psychology and process behind it:
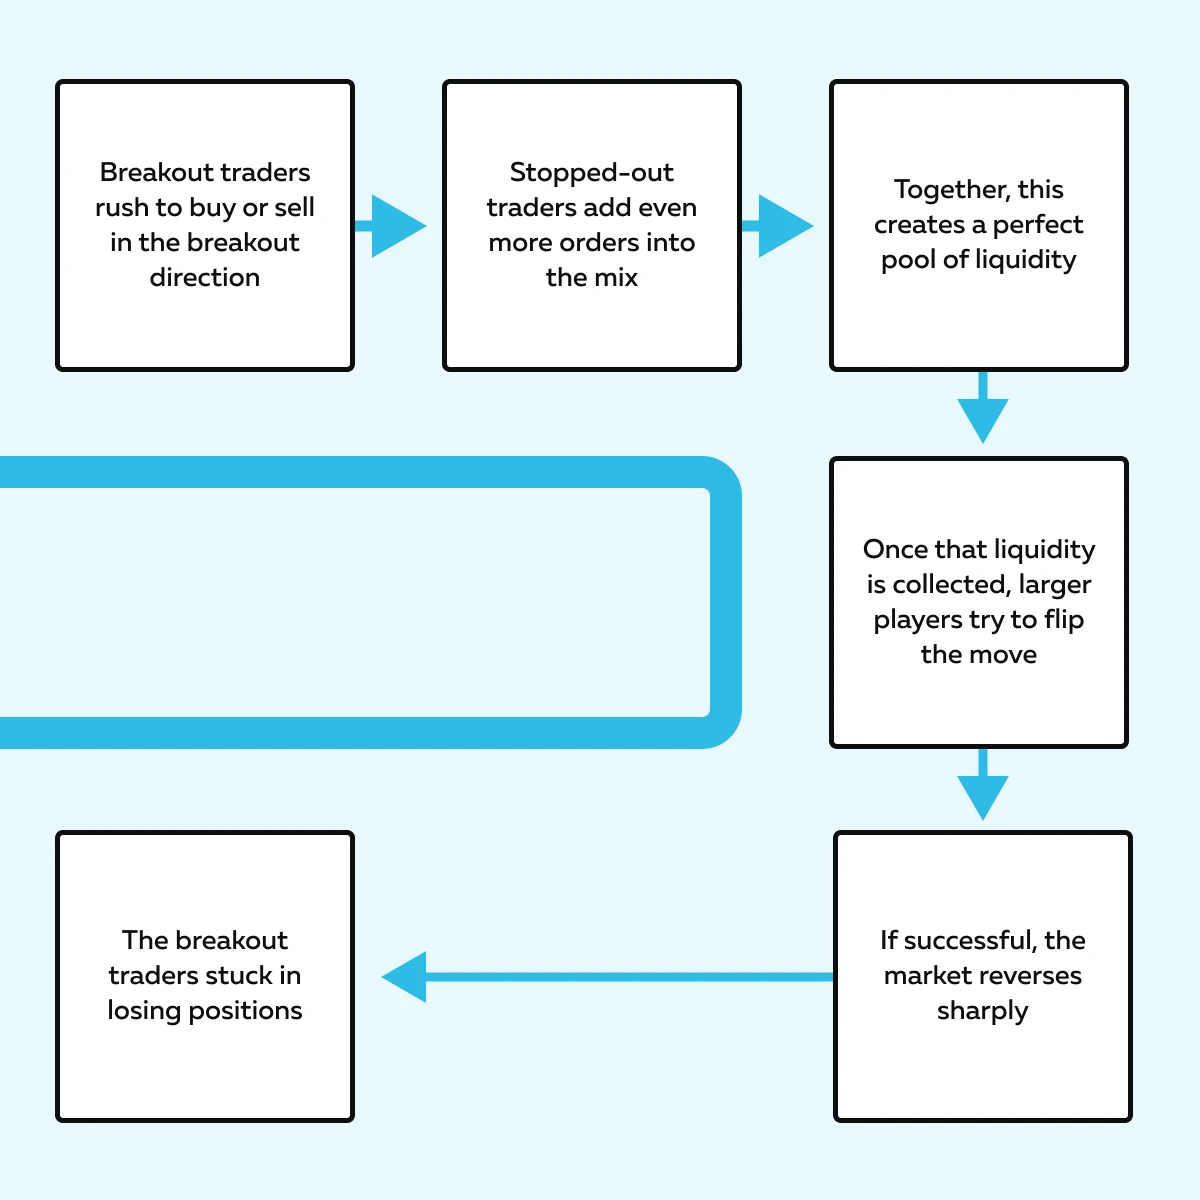
That’s why it’s called a trap! Traders thought they were catching a breakout, but instead, they got caught on the wrong side.
For more clarity, let’s study an example:
-
- Suppose there is low volume in pre-market trading.
- NQ futures break above a resistance level.
- This event entices buyers to go long.
- Later, the regular session opens with much higher liquidity.
- As a result, the price drops back below resistance.
- Those breakout buyers are now trapped in losses.
- Their selling adds fuel to the reversal.
See how Bookmap’s heatmap reveals liquidity traps before they happen.
Structural Clues of a Liquidity Trap
A liquidity trap often exhibits certain signs in price action and order flow. These aren’t guaranteed! But they can give you hints that a false breakout may be forming. Let’s check out some main clues:
#Clue I: Low Liquidity Above the Breakout Level
If the area just above resistance (or below support) doesn’t have much trading activity, the breakout can’t be sustained.
That’s because thin liquidity makes it easy for big players to push prices through the level. But it becomes hard for the price to keep moving afterward.
#Clue II: Sudden Aggressive Market Orders
You may notice a burst of buying (above resistance) or selling (below support) that forces the breakout. But if those aggressive orders aren’t followed by continued interest, the move lacks fuel. This is often the “grab” part of the trap.
#Clue III: Quick Return to Prior Range
After the breakout, there could be two possible price movements:
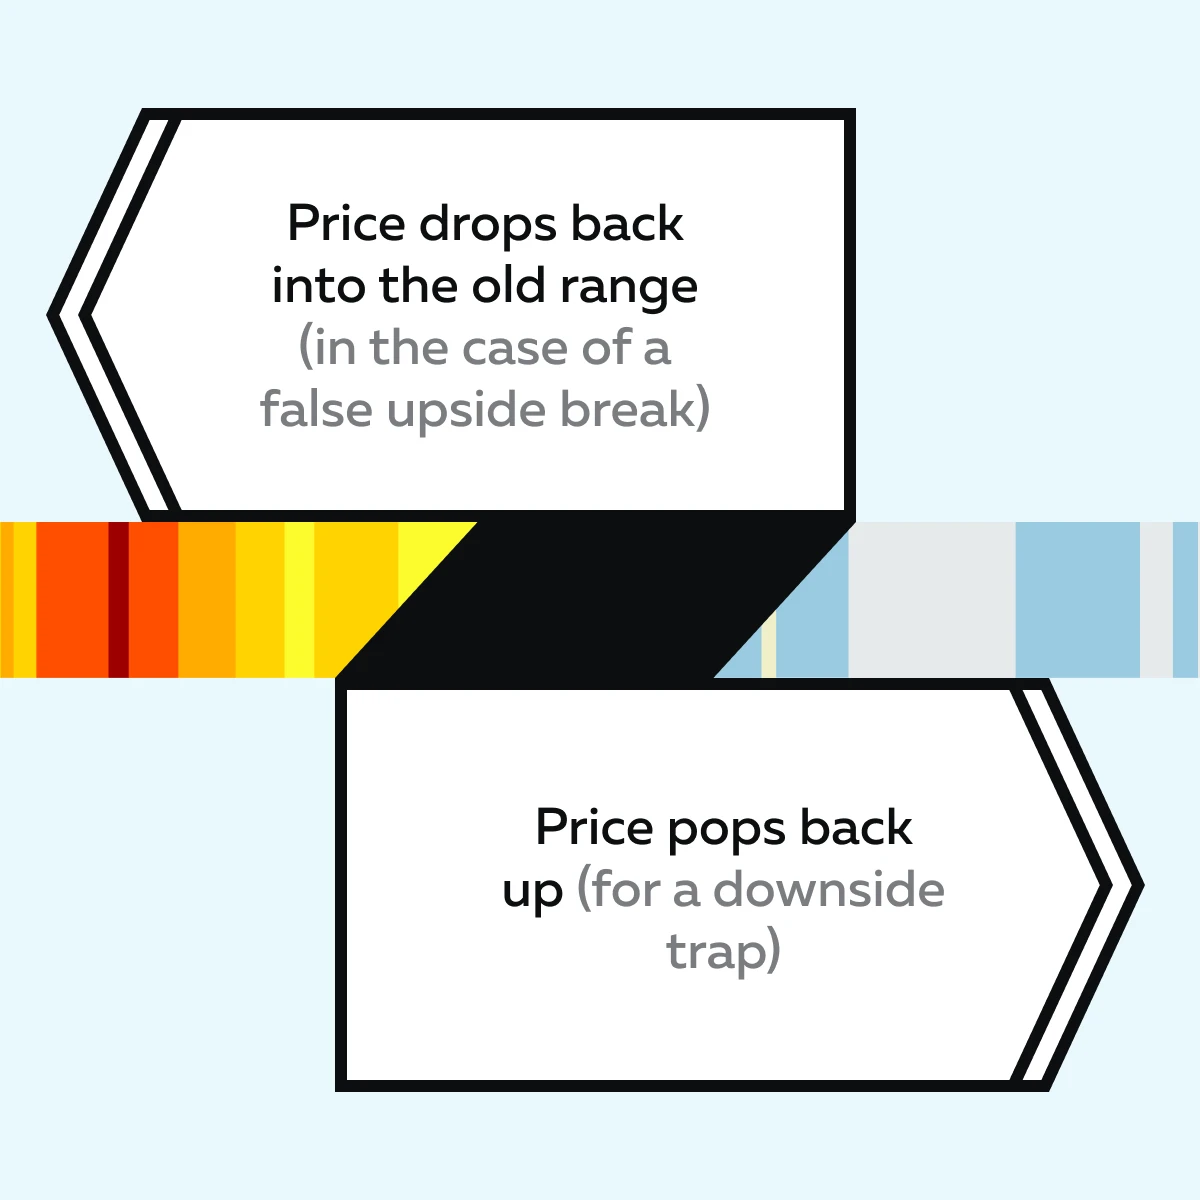
Now, you must realize that this is the big giveaway! The breakout didn’t hold, and traders who jumped in are now stuck.
Kindly Exercise Caution
These signs are not certainties! They’re just behaviors that can appear when a trap is developing. Do you know what truly matters? It is the broader market context, like:
- Overall trend, and
- Volume conditions.
How does the order flow behave after the break? That decides whether the breakout will fail as a liquidity trap or hold as a genuine move.
Why the Market “Cleans” Itself This Way
The market works like an auction! Yes, buyers and sellers are constantly competing. Due to this fight, the price naturally moves to liquidity zones with enough orders to match both sides.
Now, this is why we see stop runs and liquidity traps! They are just ways the market finds counterparties so that large players can execute trades. Let’s gain more clarity and understand some core concepts:
Auction Theory Context
The market is always searching for balance! When price spikes into zones full of stop orders, it’s not a random event. Instead, it’s the auction moving toward liquidity. These stop runs and traps give institutional participants the orders needed to enter or exit positions (without causing chaos).
Large Player Needs
Let’s assume a large fund that wants to sell a massive position. Now, if they just dumped their shares at the market (hit the bid), they’d cause massive slippage and push the price against themselves.
Instead, they push prices into areas where many buy stops are waiting. This approach gives them access to several eager buyers. They can now easily sell to them.
The End Result
Weak hands are flushed out! Yes, traders who placed stops too close get taken out. Let’s study the two major impacts this has:
| Effect I: Liquidity is cleared | Effect II: The path is cleaner |
| Once those stop orders are consumed, the price no longer has that “overhead supply” (which was blocking movement). | Now, the market can move more smoothly in its intended direction. There is no drag from all those clustered orders. |
Spotting Stop Runs & Traps in Real Time
Catching a stop run or a liquidity trap in real-time isn’t easy. However, if you know some useful signs, the observations become easier. Below are some ways you can spot stop-runs and traps in real-time:
1. Order Flow Clues
| Liquidity clusters near highs/lows | Observe how the price approaches |
|
|
2. Heatmap and Volume Signature
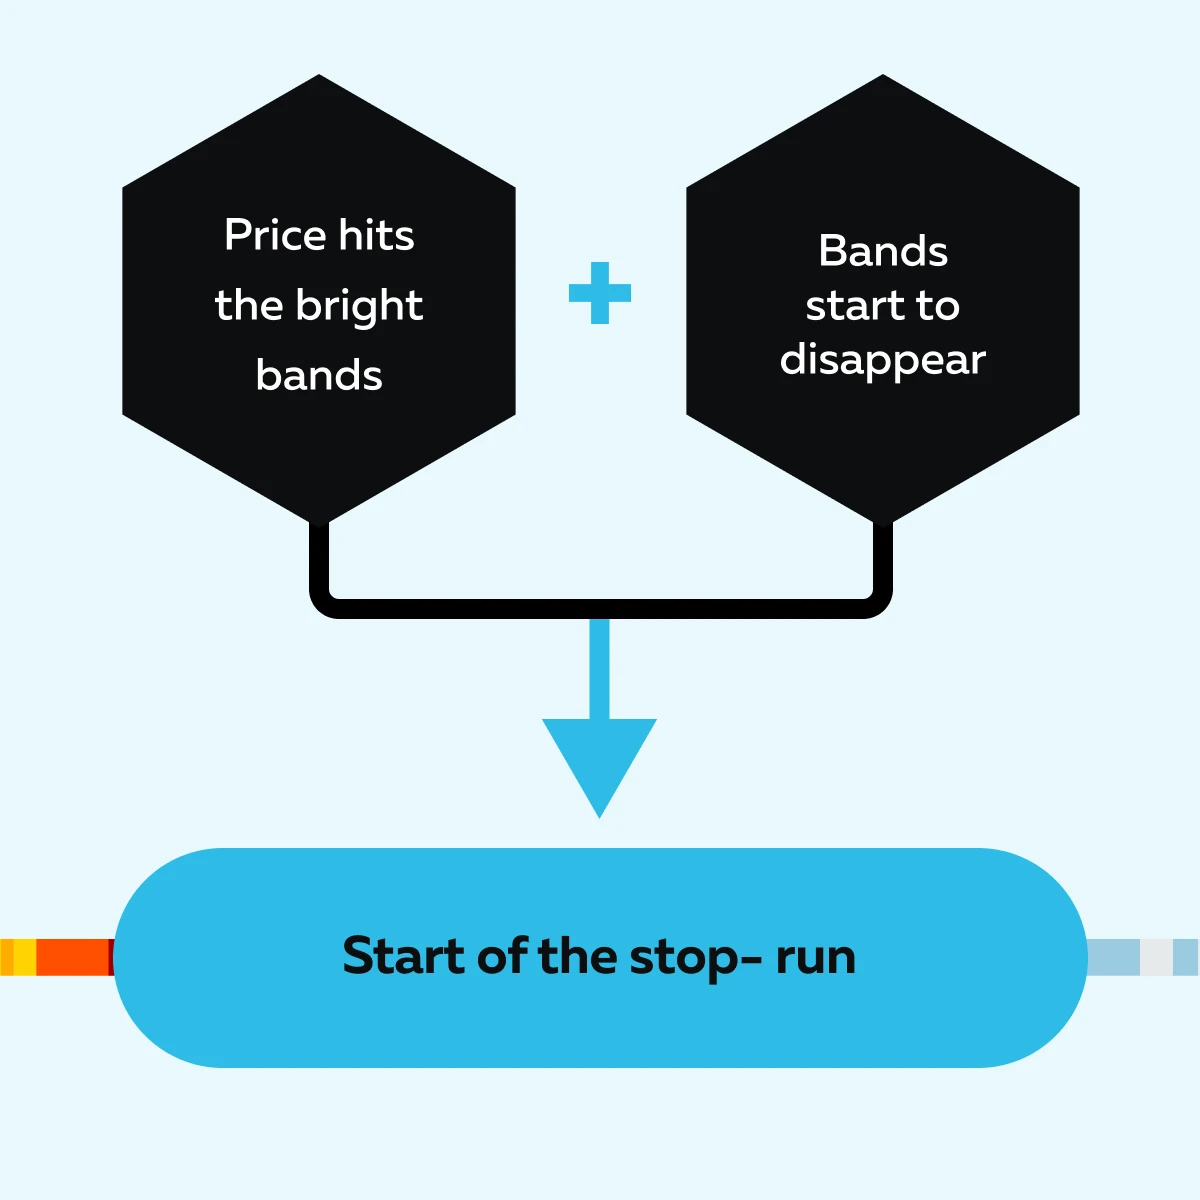
On our real-time market analysis tool, Bookmap, you can see big pockets of liquidity show up as “bright bands.” These bands represent areas where many orders (stops or limit orders) are deployed.
Now, you can determine the start of the stop run as follows:
Spotting Liquidity Trap on Bookmap

Furthermore, on Bookmap, let’s assume you notice:
-
- Large volume dots (showing aggressive trades) exactly at that liquidity level (bright bands), and
- Subsequently, you notice that these dots are followed by a sharp reversal.
Now, that’s a strong sign of a liquidity trap. It shows that the breakout failed, and the traders got caught on the wrong side.
3. Contextual Filters
| Time of Day | News Events |
|
|
Compare Bookmap packages to see how you can visualize stop runs in real time.
Trading Tactics Around Stop Runs & Traps
As a trader, you need smart tactics to avoid getting caught on the wrong side. Also, they let you take advantage of available market opportunities when setups are clear. Let’s check out some trading tactics you can follow around stop runs and traps:
1) Always Wait for Confirmation
Don’t jump in on the very first spike! A breakout could be real or just a false breakout (liquidity trap). Wait a little to see if the price holds at the new level or snaps back.
2) Fade the Trap
Let’s assume you spot traders being trapped. Now, you can consider trading against them. For example,
- The price breaks above resistance.
- However, it fails within two minutes.
- You then see heavy selling back below that level.
- That’s a trap.
- By going short there, you can trade against the trapped buyers.
3) Manage Risk Aggressively
Stop runs and traps can stretch farther than expected before turning. To avoid big losses, you should:
- Use tight stop-losses,
and
- Keep your position size small until the reversal is apparent.
4) Scale In Strategically
Instead of entering all at once, try scaling in! You can:
- Start with a partial entry.
- This entry can be made near the suspected reversal point.
- Now, add more as the market confirms the move in your favor.
This approach can create a perfect balance between risk and reward.
5) Use Tools for Clarity
Our Bookmap shows hidden order flow in real time. Our advanced “Stops and Icebergs Indicator” allows you to see:
- Where stops are being triggered,
and
- Where large hidden orders may sit.
This data gives you more confidence in spotting stop runs and liquidity traps. For more information, check out how the Bookmap Stops & Icebergs Indicator works.
Conclusion
After reading this article, you must have understood that stop runs and liquidity traps are not random tricks of the market! They are part of the market’s natural auction process.
Note that the market always needs enough buyers and sellers to make trades happen. Stop runs and liquidity traps are ways big traders create that balance. By triggering stop orders, they find people willing to take the other side of their trades.
Are you a trader who feels stop-runs are a frustrating shakeout? Nope! They are calculated profit-earning opportunities. All you must do is learn to recognize the patterns, which can be done by studying order flow and watching for structural clues.
To make this easier, you can use our real-time market analysis tool, Bookmap. See how Bookmap visualizes liquidity and stop runs across futures, stocks, and crypto in real time — compare packages here.
FAQs
1. Are stop runs illegal?
No! Stop runs are not manipulation. They are a part of standard market mechanics. As a trader, you must realize that the market naturally moves toward areas with lots of orders (liquidity).
Why? Because big players need these levels to enter or exit large trades. Thus, stop runs represent how the auction process works.
2. Can retail traders take advantage of stop runs?
Yes! To make the maximum advantage, retail traders should learn to:
- Recognize liquidity traps,
and
- Identify failed breakouts.
As a tip, they should not chase the first spike and wait for confirmation. Instead, when they see trapped traders, they can trade in the opposite direction with proper risk control. This approach can turn stop runs into opportunities!
3. How often do stop runs happen?
Stop runs occur frequently! You will mostly find them around:
- Obvious highs/lows,
or
- Support/resistance levels.
These are the areas where stop orders cluster. Additionally, they are common during low-liquidity times like:
- Pre-market,
- Lunch hours, and
- Thin sessions.
By recognizing these zones, you can better prepare instead of being caught by surprise.
4. How does Bookmap help spot them?
Bookmap is an advanced real-time market analysis tool. With it, you can see the order book in real time. It offers a special “heatmap,” which highlights where large liquidity levels sit.
Bookmap also has another unique feature called “volume dots.” These dots reveal when these levels are being attacked or consumed.
In this way, Bookmap lets you see potential stop runs or liquidity traps as they form (instead of after they happen).
Sign Up Now