


See swing trading more clearly in real time.
Compare plans to access deeper market visibility for swing trading.
Education
September 21, 2026
Updated
Swing Trading Explained: Strategies for Capturing Short-Term Price Swings
Swing trading, a dynamic approach to financial markets, allows traders to capture short-term price movements within financial markets. By merging elements from both day trading and longer-term investing, swing trading offers traders with a balanced blend of flexibility and versatility.
Through this article, we will explore the fundamentals of swing trading, discuss the key concepts, and delve into the powerful tool of Bookmap, which can enhance swing trading strategies.
Let’s dive in and uncover the essentials of swing trading and how to leverage the advantages it offers.
Table of Contents
- What Is Swing Trading?
- Key Differences: Swing Trading vs. Scalping vs. Day Trading
- Fundamentals of Swing Trading Strategies
- Identifying Trends for Swing Trading
- Best Indicators for Finding Swing Setups
- Understanding Support & Resistance in Swing Trading
- Entry and Exit Techniques in Swing Trading
- Moving Average Crossover Setups
- How to Manage Risk in Multi-Day Trades
- Day Trading vs. Swing Trading: Profitability Comparison
- Top Brokers for Active Retail Traders
- Options Strategies for Multi-Day Holds
- Crypto Breakout Patterns
- Penny Stock Volume Trading
- Common Mistakes and How to Avoid Them
- Leveraging Bookmap for Swing Trading Success
- Conclusion
- FAQ
What is Swing Trading?
At its essence, swing trading is the process of buying and selling financial instruments, such as stocks, currencies, or commodities, to profit from short to intermediate-term price movements. Unlike day trading’s frenetic pace, swing trading thrives on holding positions for a span spanning from a few days to several weeks, with the typical duration hovering around 2-3 days.
Most swing traders use technical analysis tools, such as chart patterns, moving averages, and momentum indicators, to identify potential entry and exit points for their trades.
Why is Swing Trading Attractive to Traders?
-
It allows for potentially quicker and more frequent trades compared to long-term investing or day trading.
-
Swing traders can make better trading decisions by taking advantage of:
-
Short-term news events
-
Market sentiment changes
-
Technical indicators
-
-
By focusing on shorter timeframes, swing traders avoid prolonged market exposure. This reduces the risk associated with holding positions for extended periods.
-
Capturing short-term price swings provides opportunities for earning profits in both bullish (upward trending) and bearish (downward trending) market conditions.
Key Differences: Swing Trading vs. Scalping vs. Day Trading
Swing trading, scalping, and day trading are three distinct trading styles. All of them differ in terms of:
-
Timeframes
-
Objectives, and
-
Risk profiles.
Here are the key differences among them:
|
Trading Style |
Timeframe |
Primary Objective |
Risk Profile |
|
Swing Trading |
The position is held for several days or weeks. This timeframe stands in stark contrast to the rapid-fire transactions of day trading or scalping. |
The aim is to capture short to intermediate-term price swings. |
|
|
Scalping |
Scalpers hold positions for very short periods, often seconds to minutes.
|
Scalping aims to profit from small price movements by executing a large number of trades in a single day. |
|
|
Day Trading |
Day traders open and close positions within the same trading day, with no overnight positions.
|
The goal of day trading is to capitalize on intraday price fluctuations. |
|
Risks Associated with Holding Trades Overnight
It’s crucial for traders to carefully evaluate the risks associated with holding overnight positions and consider these factors in their overall risk management plan.
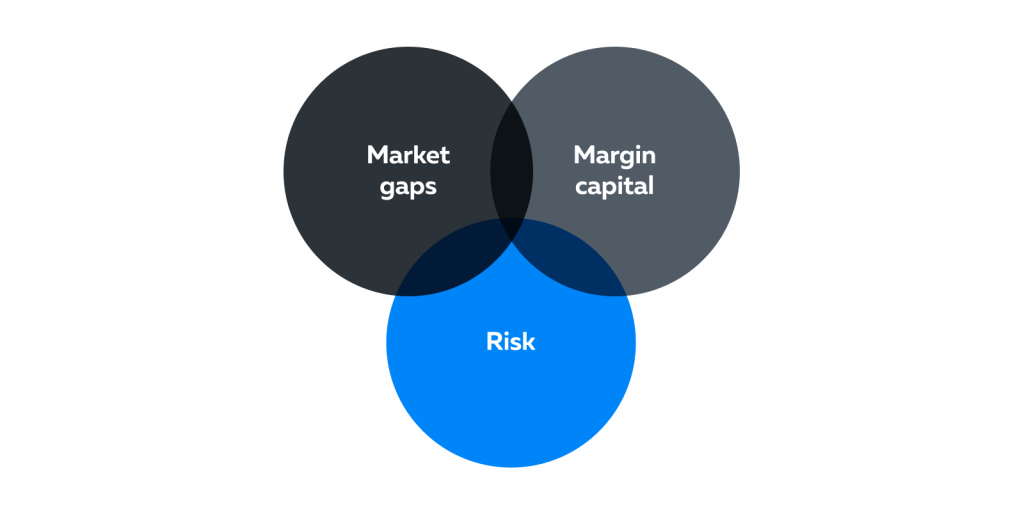
Holding trades overnight has several risks:
-
Market Gaps:
-
Outside of regular trading hours, news events or market developments can lead to significant price gaps or shifts when the market reopens.
-
These gaps can result in substantial losses for traders with overnight positions.
-
-
-
Margin Capital:
-
Overnight positions tie up margin capital.
-
This limits the trader’s ability to take other opportunities or manage risk effectively.
-
-
-
Increased Risk:
-
Traders must consider the potential for overnight risks in their risk management strategies.
-
This usually involves:
-
Setting stop-loss orders or
-
Adjusting position sizes to account for potential gaps.
-
-
Fundamentals of Swing Trading Strategies
Swing trading strategies provide a structured framework for making informed trading decisions and managing risk. These strategies help traders avoid impulsive decisions driven by emotions and instead rely on a predetermined set of rules and criteria.
Here are the fundamentals of swing trading strategies:
-
-
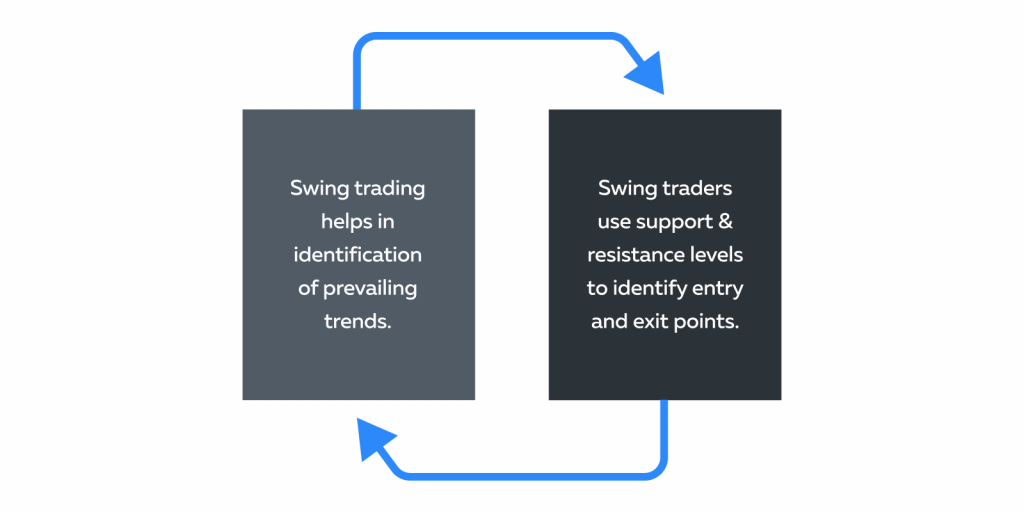
Trend Identification:
-
Swing trading helps in the identification of prevailing market trends.
-
Swing traders typically focus on trading in the direction of the trend, whether it’s bullish (upward) or bearish (downward).
-
Trend identification is mostly done through technical analysis, which involves analyzing:
-
Price charts
-
Moving averages, and
-
Trendlines.
-
-
-
-
Support and Resistance Levels:
-
|
Meaning |
Support levels represent prices at which an asset tends to find buying interest, preventing it from falling further. |
Resistance levels are price levels where selling interest tends to emerge, preventing the asset from rising further.
|
|
Relevance |
|
|
Identifying Trends for Swing Trading
Recognizing and acting on trends is pivotal for successful swing trading. The importance of identifying both uptrends and downtrends lies in the following aspects:
-
Identifying trends allows swing traders to spot potential trading opportunities.
-
In an uptrend, swing traders seek buying opportunities to profit from upward price swings.
-
In a downtrend, they look for selling opportunities to profit from downward price swings.
-
-
Trading in the direction of the prevailing trend increases the likelihood of profitable trades.
-
Recognizing trends is also crucial for risk management. Swing traders can set stop-loss orders and exit positions when the trend reverses.
Major Tools and Indicators for Identifying Trends
Swing traders use various tools and indicators to recognize and act on uptrends and downtrends. Here are some commonly used ones:
|
Tools & Indicators |
Explanation |
|||||||||
|
Moving Averages |
|
|||||||||
|
Trendlines |
|
|||||||||
|
Relative Strength Index (RSI): |
|
|||||||||
|
Moving Average Convergence Divergence (MACD): |
|
Best Indicators for Finding Swing Setups
Beyond the moving averages, trendlines, RSI, and MACD already covered above, two additional tools round out a practical swing-trading toolkit. Bollinger Bands — a moving average with bands set a standard deviation above and below it — help identify when price is stretched relative to its recent range, useful for spotting potential reversal zones within a swing. Volume, checked alongside any of the indicators above, confirms whether a setup has real participation behind it: a breakout or moving-average crossover on weak volume is a meaningfully less reliable signal than the same setup on strong volume.
No single indicator is reliable in isolation — the practical approach is using trend and momentum tools together with volume confirmation, rather than treating any one indicator as a standalone entry trigger.
Understanding Support & Resistance in Swing Trading
Support and resistance levels are not fixed price points, but rather areas or zones where the buying and selling interests tend to converge and balance each other. The price may fluctuate within these zones, but it is unlikely to break out of them unless there is a significant change in the supply and demand forces.
Here’s an explanation of support and resistance in swing trading and their significance in the trading process:
|
Aspects |
Support Level |
Resistance Level |
|
What does it mean? |
|
|
|
How It Helps Swing Traders |
|
|
|
Why do Support and Resistance Levels Matter? |
|
|
Moving Average Crossover Setups
A moving average crossover happens when a shorter-period moving average crosses a longer-period one — a bullish signal (“golden cross”) when the shorter average crosses above the longer one, and a bearish signal (“death cross”) when it crosses below. Common pairings include the 50-day and 200-day moving averages for longer swing setups, or the 9-day and 21-day for shorter multi-day swings.
Crossovers are lagging by nature — the crossover itself only confirms a trend shift after it’s already underway, which is the same tradeoff every trend-following tool makes. Pairing a crossover signal with the volume confirmation covered above, rather than acting on the crossover alone, reduces (though doesn’t eliminate) the risk of acting on a false signal in a choppy market.
Entry and Exit Techniques in Swing Trading
Timing is crucial in swing trading. Well-timed entry and exit decisions are essential for achieving success in this trading style. Swing traders aim to capture price swings within a broader trend, and their profitability often hinges on accurately identifying the optimal points to enter and exit trades.
Here’s an exploration of the importance of timing in swing trading:
-
Timing entry and exit points correctly can significantly impact a trader’s profitability. Entering near support levels and exiting near resistance levels can help maximize profits within the price swing.
-
Proper timing is essential for managing risk. Setting stop-loss orders and taking profits at the right time helps limit potential losses and protect gains.
-
Swing traders aim to hold positions for a relatively short period. Timely exits prevent extended exposure to market volatility. This reduces the risk of adverse price movements.
Techniques for Entry and Exit in Swing Trading
Various techniques aid swing traders in making informed decisions regarding trade entry and exit:
-
Identifying support and resistance levels
-
Drawing trendlines on price charts
-
Observing moving averages to identify the trend’s direction
-
Spotting candlestick patterns, such as engulfing patterns or doji formations
-
Applying oscillators like the Relative Strength Index (RSI) or Stochastic Oscillator to gauge overbought and oversold signals.
-
Using multiple moving averages and watching for crossovers as potential entry signals.
-
Examining trading volumes to confirm the validity of price movements.
How to Manage Risk in Multi-Day Trades
Multi-day positions carry a risk the existing “overnight gap” section above doesn’t fully cover: extended exposure means a single position’s risk needs to be sized for the full multi-day hold, not just the next few hours. A common starting approach is risking no more than 1–2% of total account equity on any single swing position, with the stop-loss distance (not conviction) determining position size.
Multi-day holds also compound differently when several open positions are correlated — three swing trades that are all effectively the same bet (three tech stocks moving together, for instance) carry more combined risk than the position sizes suggest individually. For a full walkthrough of sizing positions correctly for this kind of extended, correlated exposure, see Bookmap’s guide to position sizing for success.
Day Trading vs. Swing Trading: Profitability Comparison
| Day Trading | Swing Trading | |
| Time commitment | High — requires active monitoring during market hours | Lower — positions can be checked periodically |
| Trade frequency | Many trades per day | Fewer trades, held days to weeks |
| Cost per dollar of profit | Higher (spread/commission paid more often) | Lower (fewer round trips) |
| Overnight/gap risk | None (positions closed daily) | Real — a primary risk of the style |
| Capital requirements (US equities) | $25,000 minimum for frequent day trading (PDT rule) | No PDT restriction |
Neither style is inherently more profitable — day trading trades lower per-trade cost stack against constant screen time and gap-free exposure, while swing trading trades less frequent monitoring against real overnight and weekend risk. The PDT rule specifically (requiring $25,000 equity for frequent day trading in a margin account) is one of the more concrete practical reasons a smaller account gravitates toward swing trading, independent of which style otherwise suits a given trader better.
Top Brokers for Active Retail Traders
Rather than a specific ranking, the criteria worth evaluating for an active swing-trading account: commission structure (per-trade vs. per-share, and whether options/futures carry separate fee schedules), margin rates if leverage is used, charting and screening tools built into the platform, and — for anyone holding positions across market close — whether the broker offers extended-hours trading to manage a gap risk in real time rather than waiting for the next open. Broker lineups and fee structures change often enough that comparing current terms directly is more reliable than relying on a fixed list from any article.
Options Strategies for Multi-Day Holds
Swing-style options positions generally favor strategies with defined risk over a multi-day to multi-week window: a covered call (selling a call against owned shares to generate income while capping upside) suits a swing trader moderately bullish on a stock they already hold, while a vertical spread (buying one option and selling another at a different strike, same expiration) defines maximum risk and reward upfront, avoiding the full premium exposure of a naked long option over a multi-day hold.
The key mechanical difference from swing trading the underlying stock directly: options carry time decay (theta), which erodes value as expiration approaches regardless of whether the directional thesis is playing out — a real cost that a multi-day options swing needs to account for that a stock position doesn’t.
Crypto Breakout Patterns
Breakout patterns (price clearing a defined resistance or support level with strong volume) work the same way in crypto as in any other market, but two structural differences change how they should be read. Crypto trades 24/7, so a “breakout” can happen and partially resolve overnight while a trader is away from the screen, unlike equities with defined market hours. And crypto’s spot liquidity is more fragmented across exchanges than a typical listed stock, which means a breakout that looks decisive on one exchange’s chart may not reflect the same conviction across the broader market — worth checking volume and price action across more than a single venue before treating a crypto breakout as confirmed.
Penny Stock Volume Trading
Penny stocks (typically defined as trading under $5/share) attract swing traders looking for large percentage moves on relatively small dollar amounts, and unusual volume is a commonly watched signal for potential breakouts in this category. The risk profile is meaningfully different from swing trading a large-cap stock, though: thinner liquidity means wider effective spreads and more slippage on both entry and exit, and penny stocks are disproportionately targeted by pump-and-dump schemes, where coordinated promotion drives a volume and price spike specifically to sell into retail demand.
Unusual volume in a penny stock is not, on its own, a reliable bullish signal the way it might be in a more liquid, closely followed name — it’s worth treating with more skepticism by default given how much easier this category is to manipulate.
Common Mistakes and How to Avoid Them
Swing trading can be a profitable trading strategy, but it’s not without its challenges. Here are some frequent pitfalls swing traders encounter and strategies to evade them:
|
The Mistake |
The Meaning |
Potential Solution |
|
No Defined Trading Plan |
|
|
|
|
|
|
Ignoring Risk Management |
|
|
|
Failing to Adapt to Changing Market Conditions |
|
|
|
Overemphasizing Past Performance |
|
|
|
FOMO (Fear of Missing Out): |
|
|
|
Overleveraging |
|
|
Leveraging Bookmap for Swing Trading Success

Bookmap is a powerful market analysis tool. Most successful swing traders use it to identify:
-
Trends
-
Support and resistance levels, and
-
Potential entry and exit points.
Here’s how Bookmap’s features can benefit swing traders:
|
Features |
Explanation |
Practical Market Usage |
|
Heatmap |
|
|
|
Volume Dots |
|
|
|
Historical Depth Data |
|
|
|
Order Book Imbalance |
|
|
|
Iceberg Detector |
|
|
Conclusion
Successful swing trading comes down to a few repeatable fundamentals: identifying the prevailing trend, trading around support and resistance with confirmation from volume and momentum, and sizing positions for the real risk of holding through overnight and weekend gaps. None of that requires predicting the market perfectly — it requires a consistent process for entries, exits, and risk that holds up across different setups, whether trading large-cap stocks, options, crypto, or penny stocks.
Bookmap’s heatmap, volume dots, and iceberg detector give swing traders a more direct view of the liquidity and order flow behind those support and resistance levels than price charts alone can show. Try Bookmap for free to see it directly.
FAQ
Should I trade stocks, forex, or crypto for swing trading?
Each market suits swing trading differently. Stocks offer defined market hours and the widest range of broker tools; forex offers near-24-hour trading and high liquidity in major pairs; crypto trades 24/7 with generally higher volatility and more fragmented liquidity across exchanges. The right market depends more on available capital, time zone, and risk tolerance than any one being objectively better for swing trading.
Is swing trading better for beginners or experienced traders?
Swing trading’s slower pace (positions held days to weeks, rather than requiring constant intraday monitoring) makes it more accessible to beginners than day trading or scalping, which demand faster decision-making under more time pressure. That said, the overnight and weekend gap risk covered above still requires real risk management discipline regardless of experience level.
Should I use technical analysis or fundamental analysis for swing trading?
Most swing traders lean heavily on technical analysis (trend, support/resistance, indicators, volume) for timing entries and exits, since swing trades are typically too short in duration for a company’s underlying fundamentals to change meaningfully during the hold. That said, a fundamental catalyst (an earnings report, a sector-wide trend) is often what starts the price swing a technical setup is used to time — the two aren’t mutually exclusive.
Sign Up Now
Latest Articles