See market activity more clearly in real time.
Compare plans to access deeper market visibility for market activity.
Education
July 21, 2024
SHARE
The 5 Most Common Candlestick Patterns
Steve Nison’s influential 1991 book Japanese Candlestick Charting Techniques introduced the Japanese method of pattern analysis in markets to the Western world. Thousands of these patterns have now been identified, with names such as bearish dark cloud cover, evening star, three black crows, etc. Many trading strategies have been developed based around these candlesticks patterns.
Let’s have a deeper look at candlesticks and what they represent by exploring 5 of the most common patterns.
What Are Candlesticks?
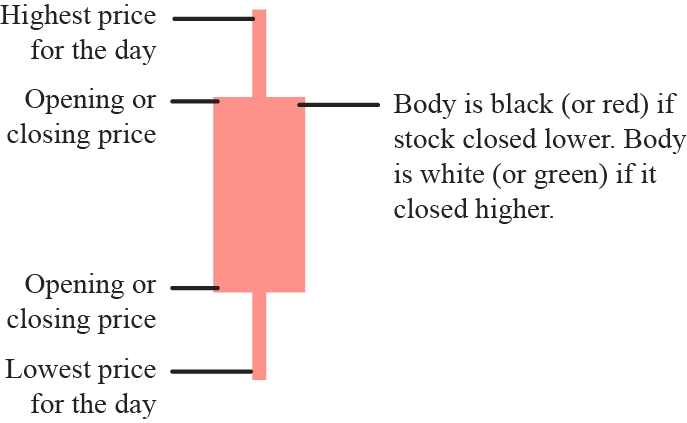
Candlestick charts are similar to bar charts in the fact they highlight the high and low as well as the opening and closing prices of that particular time frame (often 5m, 15m, 30m, 1h, 4h, daily, or weekly).
Visualizing the Collective Emotions of Traders
Candlesticks showcase market sentiment by the color coding of the candlestick body (usually red and green, but this is of course generally modifiable on most platforms).
The size of the body, as well as the distance between the high, low, open and close of the candlestick can all signal vital information. For example, if you are looking at a daily candlestick chart and the last day shows a very high price on the day (called the wick) yet the candle closes near the opening price, this shows that the market rejected those higher prices.
Combine these subtle insights with recurring patterns, and candlesticks promise technical analysts an inside look into the market.
Why Use Candlesticks
Candlesticks are a simple technique for understanding price movement. Studying candlesticks will have you on the right path to understanding price movement, but naturally here at Bookmap we prefer order flow. That being said, candlesticks can be enabled on the Bookmap heatmap.
Advantages Over Line Charts
Candlesticks have several advantages over line charts. While a line chart only provides one data point for the price of an asset, candlestick charts provide five: open, close, low, high, and direction of movement. This extra information gives an absolute advantage for traders that purely base their decisions on price action.
The Five Most Common Candlestick Patterns
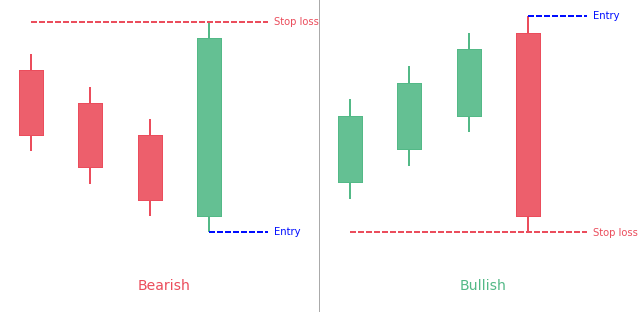
Three Line Strike
Three green candles from the bullish three-line strike reversal pattern within a downtrend.
Img 1: Source
Bars close to the intrabar low have a lower low. The price declines substantially in the fourth bar but reverses in a wide-range outer bar that closes higher than the series’ opening candle.
Based on Bulkowski’s forecast, this reversal predicts rising prices accurately 83 percent of the time.
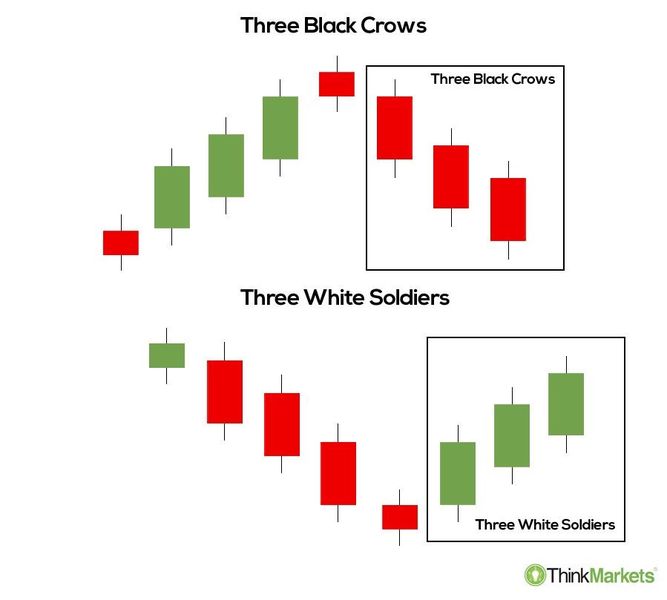
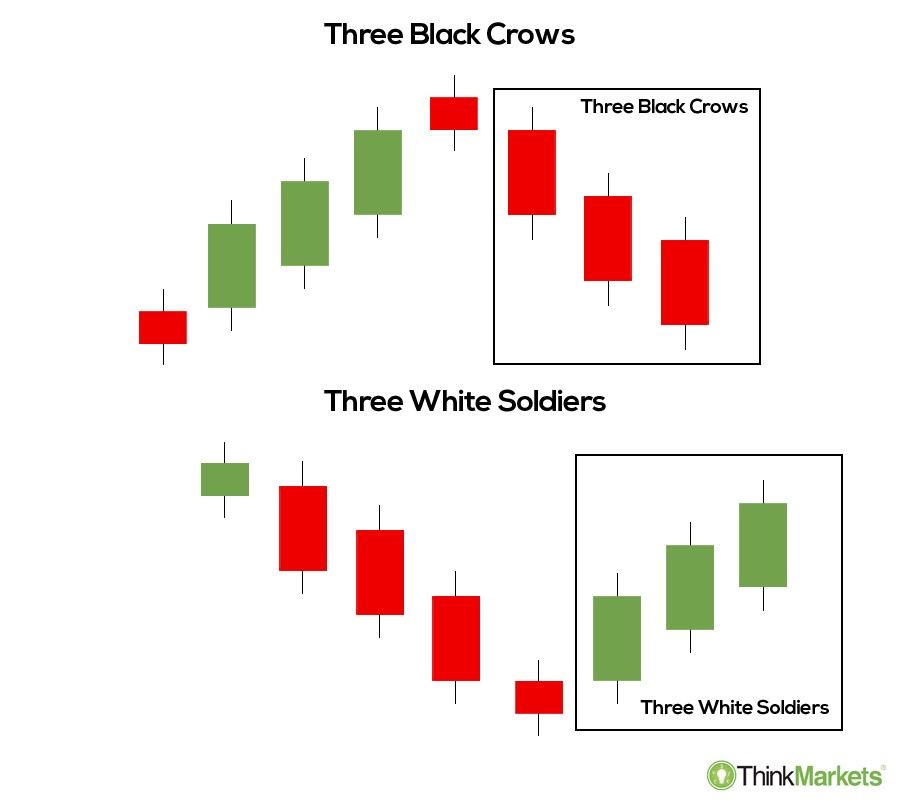
Three Black Crows
This pattern begins at or around the crest of an uptrend, with three black (or red) bars recording lower lows that close near intrabar lows.
Img 2: Source
This pattern implies that the drop will continue to lower lows, possibly sparking a broader-scale slump. The most bearish variant begins with a new high because it traps buyers in momentum plays.
The opposite of the Three Black Crows pattern is called the Three White Soldiers.
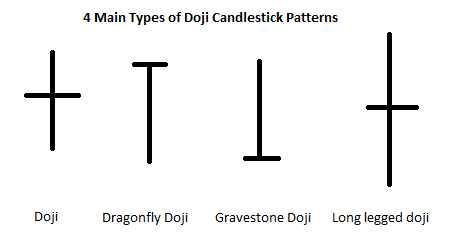
Doji

Img 3: Source
One of the most intuitive candlestick patterns for most traders, dojis form near the top and bottom of upswings and downswings respectively.
In the case of a doji signalling a potential top, the aggressive buyers drive prices higher than when the buyers exhibit signs of fatigue, which appens when the candle opens higher than the preceding candle. But if the buyers cannot keep the prices high for long, selling pressure drives the price back down to the candle’s opening, forming a lengthy upper shadow with little to no candle body.
While dojis and long legged dojis can form at tops or bottoms, dragonflies usually form at bottoms and gravestones at tops.
Hammer
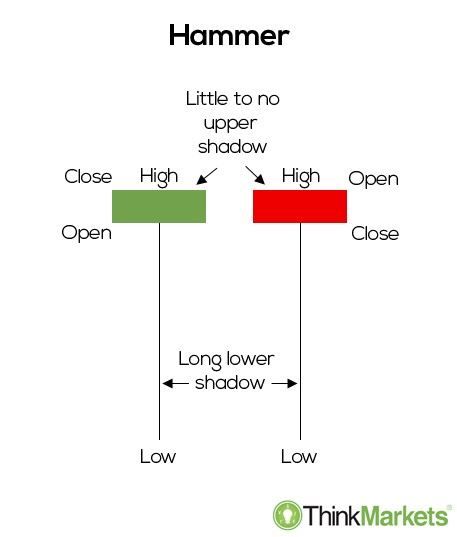
Img 4: Source
A hammer is a price pattern that occurs when an asset trades much lower than its initial price but rises before the viewed time frame’s close, to settle around the opening price.
This shapes the hammer candlestick pattern with a bottom shadow at least twice the size of the actual body. The candlestick’s body reflects the difference between the open and closing prices, while the shadow symbolizes the period’s high and low values.
Evening & Morning Star
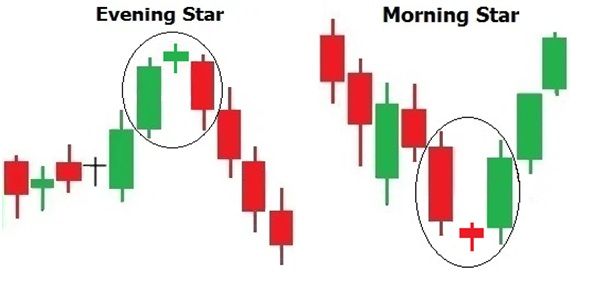
Img 5: Source
These star designs are made up of three candles, with the first and third candles being extended and the center candle being a doji or just generally short in comparison to the rest.
Usually, there is no space before and after the center candle, but it is extremely little if there is.
Bearish reversals are called Morning Stars, while bullish reversals are known as Evening Stars.
Conclusion
Candlesticks are a great place to start when analyzing financial markets, but they can give plenty of false signals. This is why we recommend at least combining them with the principles of order flow for better trading results.
You can overlay candlesticks on the heatmap in Bookmap. Try it for free today. Click here to get started.
Sign Up Now