See market activity more clearly in real time.
Compare plans to access deeper market visibility for market activity.
Trading Basics
April 24, 2024
Updated
SHARE
Liquidity: How Understanding Order Flow Determines Trading Success
Most trading books and courses refer to liquidity as being vital in your trading. You’ll hear gurus remark that you should only trade in liquid assets, but they hardly ever explain themselves beyond some boilerplate reference to average daily volume. So, what exactly is liquidity?
In a nutshell, liquidity refers to the ability to buy and sell shares of an asset without significantly impacting its price (traders call this market impact), thus minimizing the risk of each trade. For example, it’s quite easy to buy or sell $5M worth of SPY compared to $5M in shares of a microcap stock with a market cap of just $200M. This is because traders are willing to buy millions of shares of SPY at market prices at any given time. To access that quantity of shares in a smaller cap stock, you have to buy at a premium or sell at a discount.
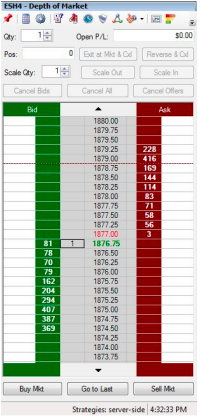
The diagram above shows a limited amount of contracts at each price.
If you have 2,000 contracts to sell, you won’t be able to immediately sell them at the current market price. If you need to get rid of the contracts immediately, you’re going to have to sell at a discount. As you can see, the buyers at the prices displayed are willing to buy about 2,000 contracts within a relatively wide range of prices, with much of the liquidity concentrated towards the lower prices.
What about a real life example? It’s the 28th of the month. Rent is due on the first and you’re short $800. Desperate, you resort to selling a prized possession: your American-made Fender Stratocaster. Worth $800 on the used market, surely this is your ticket to making rent, right?
The problem is that you have just two days to sell it exclusively in your local market. How many buyers of an expensive electric guitar are there in your small suburban area on two days notice? Among those few, will any be willing to pay the full market price? In this situation, you have to resort to discounting because you don’t have the luxury of patiently waiting for someone to buy at full market value.
Understanding liquidity is vital to trading success, so how can we harness it for profits?
Liquidity on a Heatmap
Now that we’ve explored liquidity in a macro sense, we must dive deeper into the micro details to see how we can exploit it to our advantage. Understanding and utilizing liquidity doesn’t stop at choosing liquid assets; as a matter of fact, that’s where it begins.
Liquidity-based trades take advantage of the order flow that is moving the stock price. Because we can clearly see the orders routed to the market, it would follow that we can reasonably see where supply and demand are. In an ideal world, any imbalance in the supply and demand of shares would be a foolproof predictor of price movement. However, not all of these orders are as they seem: many of them aren’t even intended to trade.
In this high-frequency trading climate, there are many orders that don’t really have the intent to trade, used by HFTs and algorithmic traders for a myriad of reasons. For our purposes, we will call these “fake” orders.
Until now, there hasn’t been a reliable method of distinguishing these “fake” orders from orders placed by real traders with the intent to actually buy and sell shares. Bookmap software provides a unique, effective solution to this problem.
Bookmap logs and plots each order from the DOM on a heatmap, allowing us to keep track of the orders that cancel once the market tries to trade with them, and the orders that actually have the intent to trade.
How Heatmap Reveals Real Liquidity
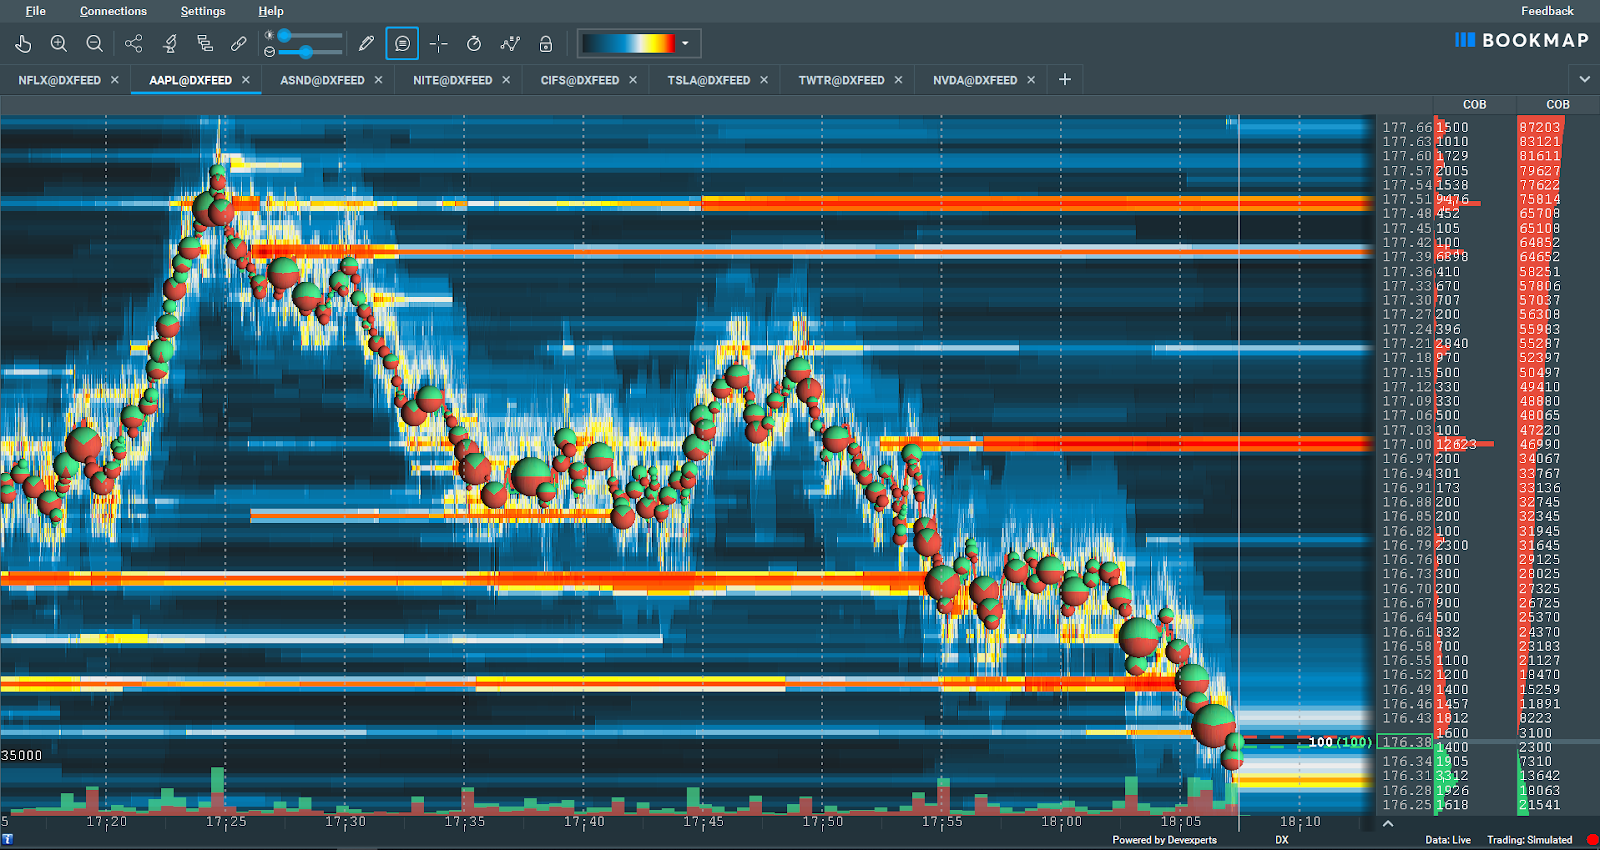
Observe the chart above. Bookmap uses a color-scaled heatmap to display the amount of liquidity at a given price level. The redder the bar, the more shares/contracts were sitting on the order book at that level, waiting to be traded. Heatmap coloring displays liquidity through a general color range, or temperature, from dark blue to saturated red. By following this heatmap, we can observe some important trends, like the price levels where the real traders are.
Real vs. Fake Liquidity
In the current short-term trading landscape, most traders use the DOM (depth of market) to place their trades. However, many have written off the liquidity display in the DOM, assuming that most of the listed orders don’t have an intent to trade.
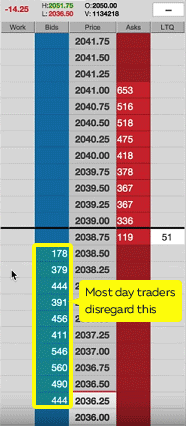
While we’re all aware of these offers that try to ‘paint the tape,’ there are plenty of real orders that offer valuable insight into where the market may trade next. Those orders remain in the book, waiting to be filled at a specific level. However, they often get lost amid the massive volume of orders placed by HFTs, which make it difficult–if not impossible–for us humans to consistently keep track.
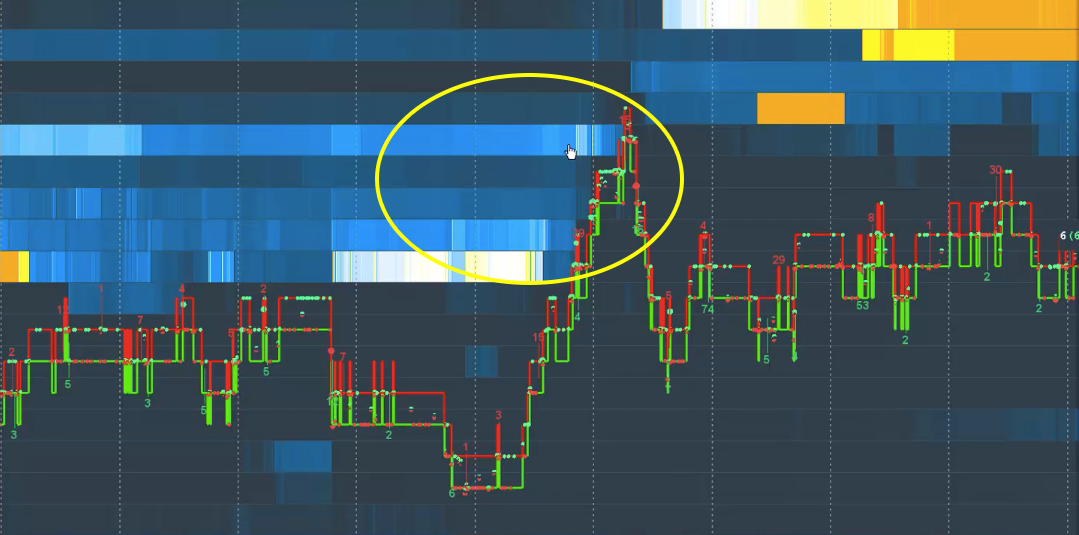
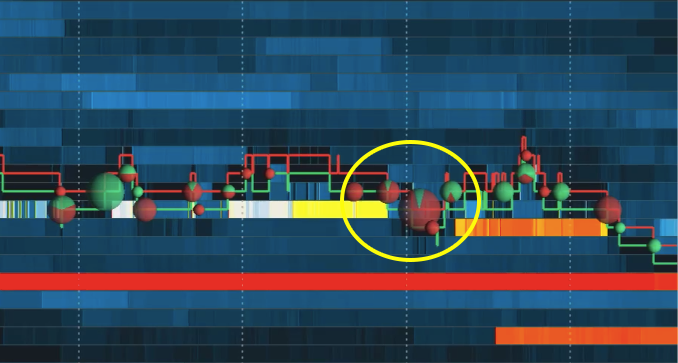
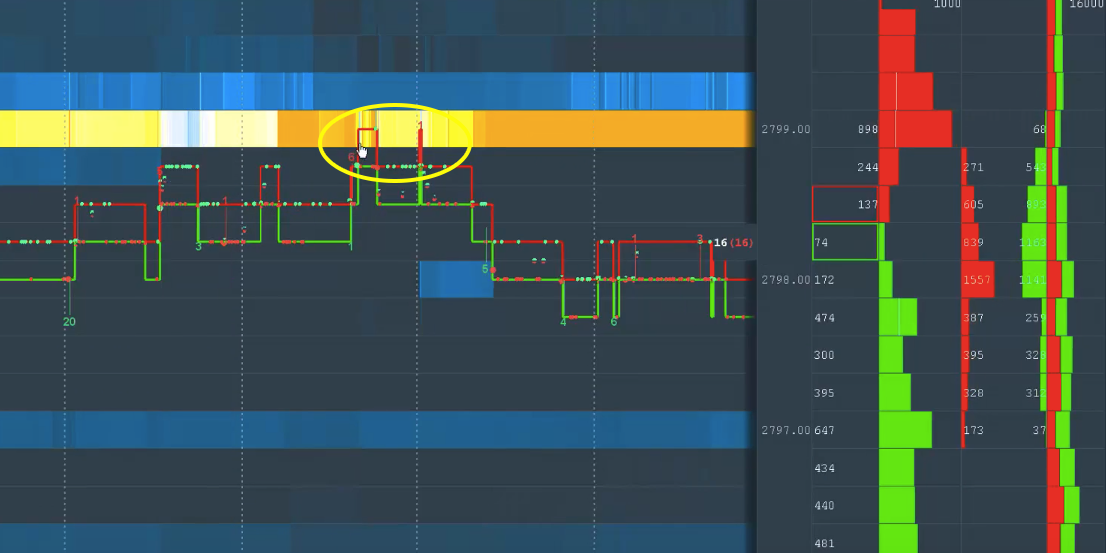
The charts above display a great example of liquidity without real intent to trade. We see a level of high liquidity, as indicated by a bright white/yellow bar. As price rises to the level of high liquidity, we see the offers quickly disappear. Those orders, whether placed by an algorithm or human trader, had no real intention to trade at that price. Only a fraction of the orders displayed actually executed, so the price had difficulty traveling through that level, which many viewing the DOM may have mistakenly identified as a major resistance level.
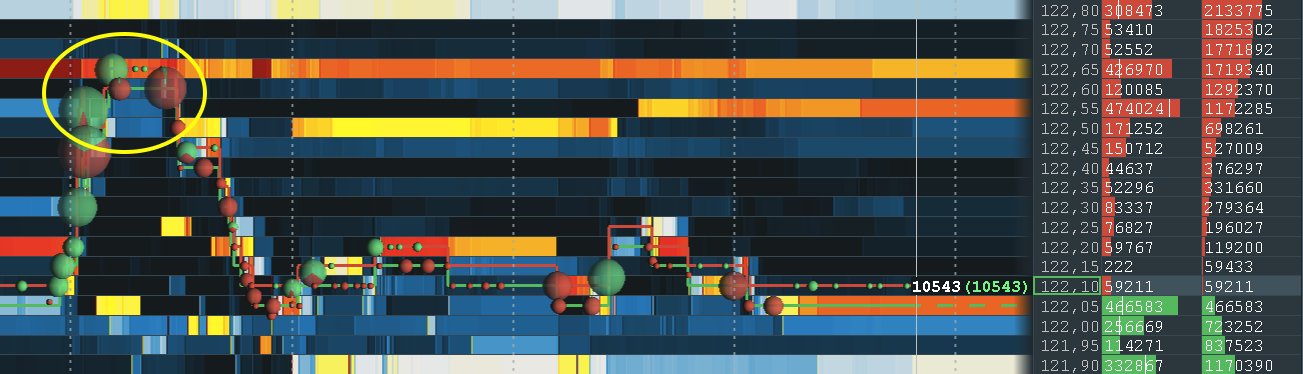
The above are examples of real liquidity. As we can see, the $122.65 has a high level of liquidity, marked by the bright orange bar. As price begins to trade up to that level, few (if any) of the orders are lifted from the book. This is the key difference between a true resistance level and an apparent resistance level caused by a mass of orders without intent to trade. The $122,65 level was rejected, as there wasn’t enough demand at that price to meet the corresponding supply. On the other hand, in the example of “false” liquidity without an intent to trade above, the price had little difficulty blazing through the apparent ‘resistance’ level, which didn’t actually exist.
Prefer video? Here’s a visual explanation of real vs. fake liquidity:
Volume and Liquidity in the Context of Trends
Those trained in classical technical analysis know the basics of a trend: a series of higher highs and lower lows on the upside, and vice versa on the downside. We also want to see the rising volume on the highs as the offer is lifted aggressively, and lower volume on the lows as the bid is held.
A basic candlestick chart can show you highs and lows, but you can’t really see what is going on in the market microstructure. Bookmap allows us to see if the most volume is being done on the bid or the offer, allowing us to gauge whether bulls or bears are in control of the price.
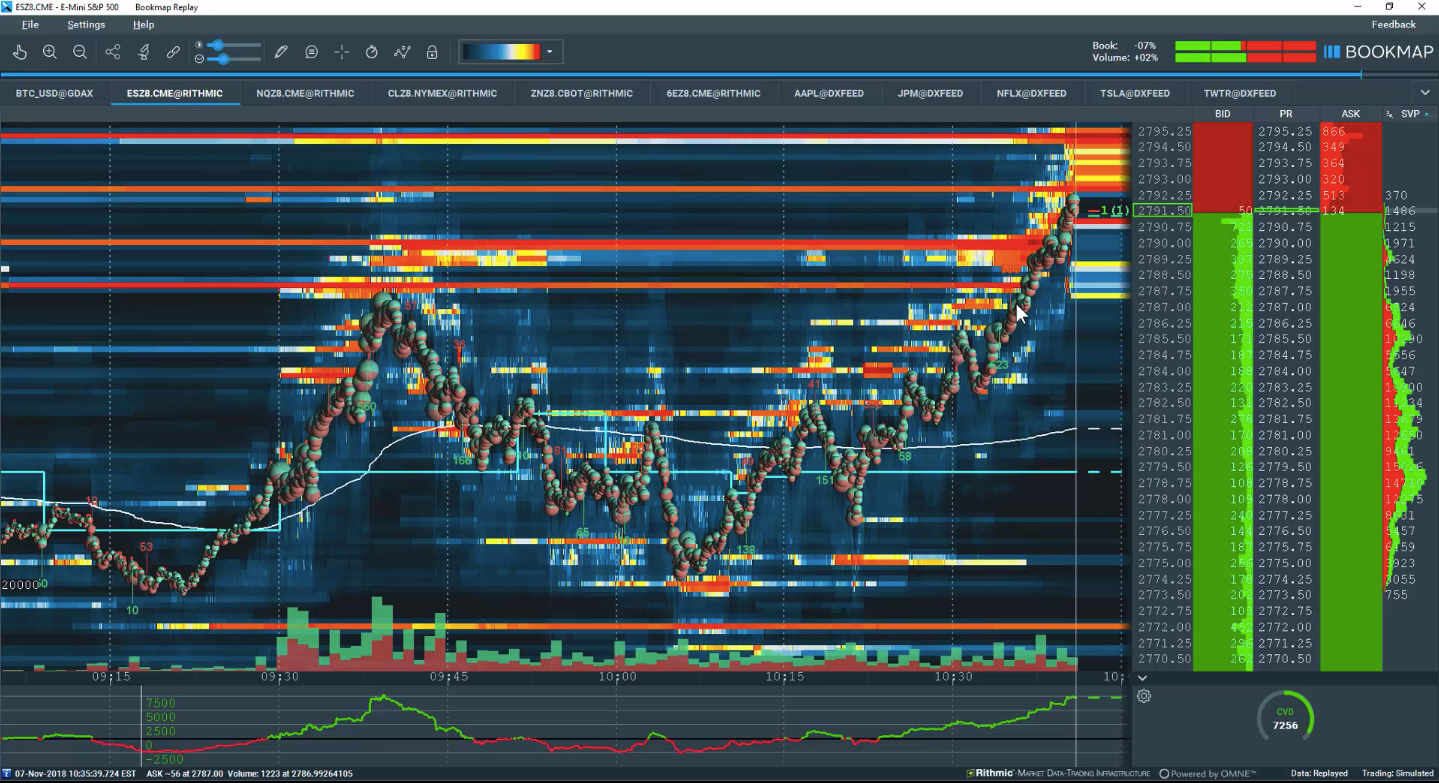
The dots in the chart above depict the distribution between orders done on the bid vs. the offer.
Orders executed on the bid are red; green orders took place on the offer. From this, we can see if buying or selling is slowing down within a given trend. If we see a lot of red clustered near the highs, the trend may be ending for reasons impossible to determine on a candlestick chart.
Using the context that Bookmap allows us to apply to the volume, we can make certain observations and predictions about the price going forward.
Summary
Bookmap helps us grasp the mechanics of liquidity on the micro and macro levels. Most traders’ only understand liquidity on the macro level; with the option to apply DOM to longer timeframes, heatmap allows for a more comprehensive understanding. But what practical use does that high-level information have? Can we make a short-term day trade based on any of this information? Unlikely.
While DOM is a basic instrument for determining market liquidity, the heatmap footprint provides more data upon which successful trading strategies can be built. By leveraging the most advanced technology, high-frequency traders and institutions are able to manipulate the market by placing orders without intent to trade. What may look like a support or resistance level on a DOM can get taken out in a swift move because the liquidity was never real.
Ultimately, the main objectives of every trader are to see real liquidity, predict price movement, and take profit from successful trades. This can only be consistently achieved with the right tools and a clear understanding of the data that moves the market.
Sign Up Now