Our 4th of July Sale is Live
Offer Valid July 4 – July 11
Get 50% off Global+ AND data for 3 months—or save 30% on Global+ for the full year
Claim Your DealReady to see the market clearly?
Sign up now and make smarter trades today
Trading Basics
September 5, 2024
SHARE
What is Tape Reading Today?
We’ve all heard about tape reading for years. What exactly is it? Tape reading emanated from the popularity of the Ticker Tape machine which became a prevalent technology for quoting stocks back in the late 19th century. It allowed traders to read updated stock quotes via morse code over telegraph lines. The term Tape Reading originated from those times where traders read these paper tapes and made decisions by interpreting the information on them.
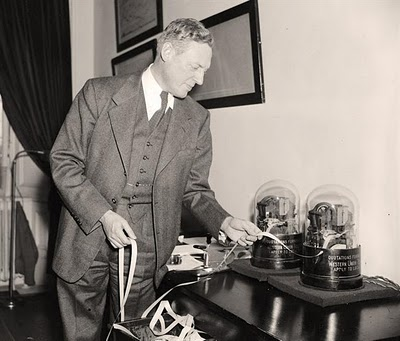
Ticker tape machine
Time and Sales
Obviously things have changed, yet traders still use the term, “tape reading” even though the days of the ticker tape machine are long gone. So what are traders referring to now? They are talking about reading the Time & Sales or transactions. Today’s Time & Sales displays scrolling real-time numerical values of a trading instrument’s latest transaction timestamp, price level, and volume. It also displays the transaction location on either the best bid or offer.
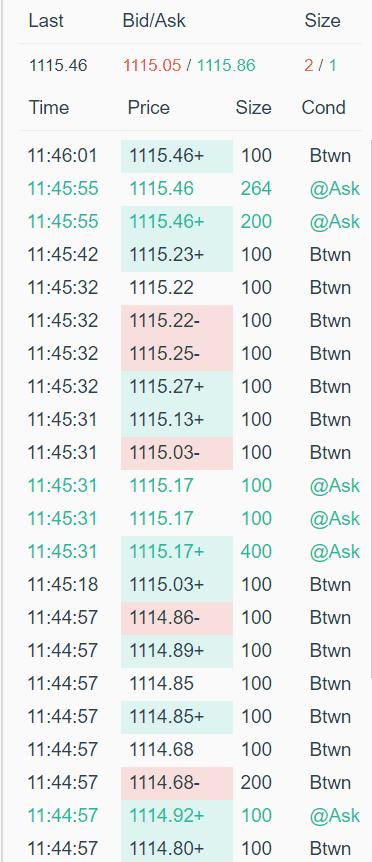
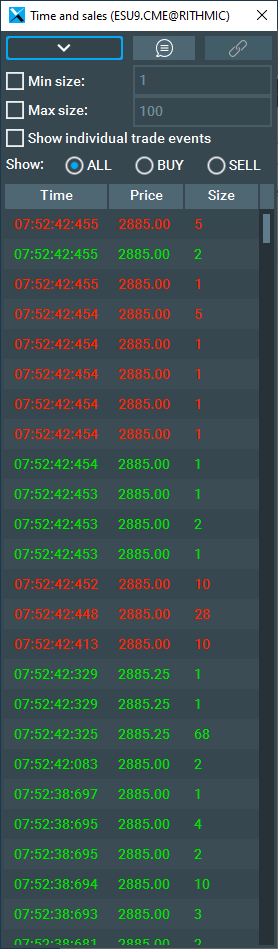
While this is good information and allows traders to begin reading the order flow of the transactions, it is an incomplete picture of what’s really going on in the marketplace. It’s just displaying the transactions. What about supply and demand? Where is the display of the traders in the auction process? What about the market structure of the price action?
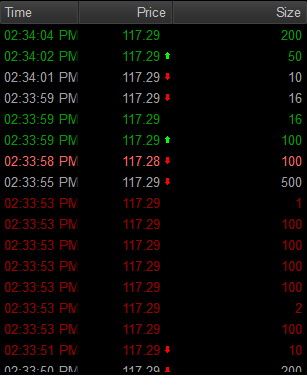
The DOM
The display in the DOM (depth of market) makes up for the shortcomings of Time and Sales. By displaying the auction process of the limit orders depth on the bid and offer. This is the supply and demand in the market. It also displays the last transaction, the current bid or offer, depth on the Bid, and depth on the offer.
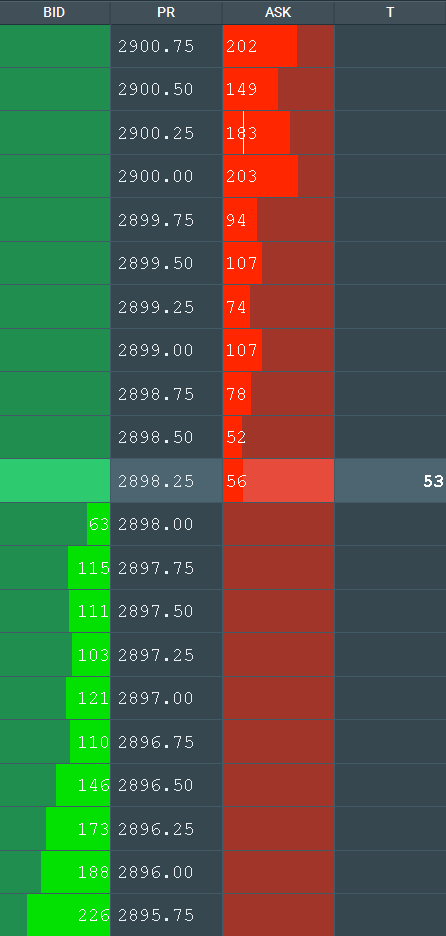
Traditional DOM
This data allows traders to see where other players want to deal in the auction. In traditional tape reading this data was not available. DOM technology became prevalent in the late 1990’s. Although it allows for more market transparency, there are some critical issues with the DOM: historical auction activity is not accessible, transactional history is not included, market structure is not displayed, and algorithmic activity is difficult to spot. These issues make the DOM a rather challenging tool to use effectively.
Problems with these Tape Reading Tools
Both Time & Sales and the DOM have several critical problems.
- The Time & Sales and the DOM are completely separated tools. Traders need to follow both numerical displays in order to understand the order flow. This can be very tedious mentally.
- Time & Sales and the DOM have no reference to the market structure or what has historically occurred in the market. This is true for both high and low time frames. Traders need to look at their price charts to gain insight. Thus 3 separated charts are required in order to get a comprehensive view of the market order flow.
- In this algorithmically dominated marketplace, price action unfolds quickly. It is extremely difficult to read the aglos behavior. Order flow phenomena such as spoofing, book flips, and ignition are rather impossible to read with these antiquated tools because price updates occur so quickly.
These tools are antiquated, so why are we using them? There must be a better solution.
Integrated View of All Order Flow Data
Let’s take a quick look at the image below. Note the completely integrated view of all the crucial market elements of price structure, transactions, and depth of the market. Note how the price structure is accurately depicted with the streaming Best Bid and Offer (BBO) over time.

Bookmap chart with the composite display of all market data
Let’s take another look at the same image and see how an integrated view of all the market data can easily help us in a glance. First, note how we can see the market structure due to the streaming BBO. We can also see all the transactions with the green and red volume dots. Plus we can see both the current and historical market depth visualized by the heatmap. In fact, the streaming BBO with the transactions is very much like a horizontal streaming Time & Sales except that the price structure and auction depth are displayed as well.
Now let’s take an even closer look at the same image below. It’s possible to gain a lot of insight due to the integrated display of market data.
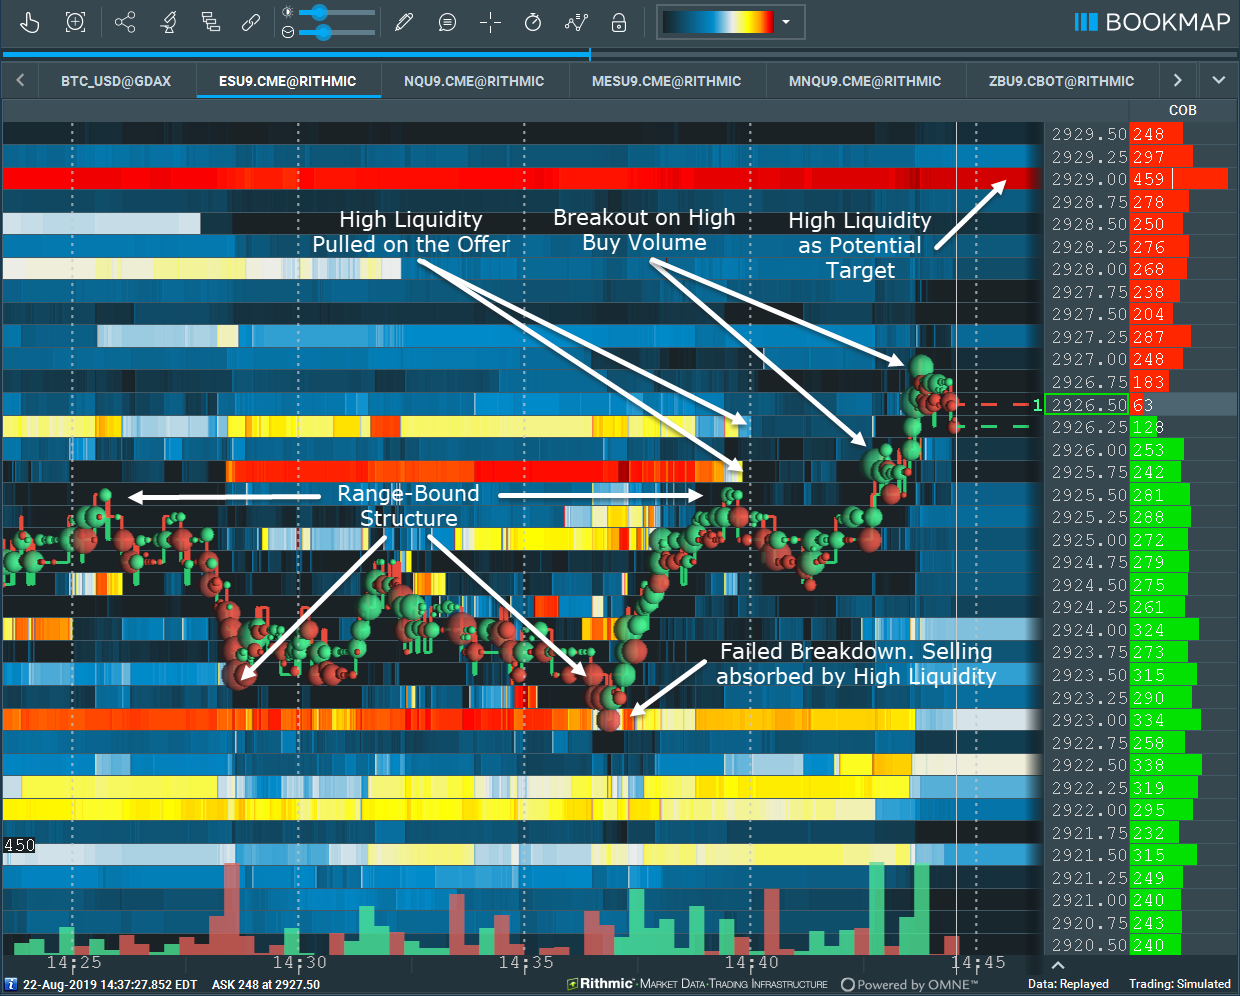
Details derived from integrated market display
Note the range-bound market structure between two areas of high liquidity defined by the streaming BBO. The range is broken as aggressive sellers (market sell orders) hit into an area of high liquidity on the Bid. However, this breakdown fails because sellers cannot chew through all the liquidity on the Bid. Aggressive buyers begin entering the market and price goes back to test the liquidity at the top of the range. Yet the high liquidity on the offer is pulled and aggressive buyers trade above the range and price breaks out to the upside. Moreover, look at the areas of high liquidity above price; these areas are likely the next stop for the price to reach and can offer traders a possible target.
In an integrated composite view, we can easily read all of the market data within a single view. This gives us precise insight to order flow activity within the market price structure. Many trading strategies can easily be developed from this data. In this example, we can clearly see potential range-bound strategies and breakout strategies. Furthermore, we can also react to the data and quickly make trading decisions directly from the composite chart.
Order Flow on Higher Time Frames
In the images above, we’ve been looking at composite views on lower time frames, which is great for scalping and day trading strategies. However, these same elements can just as easily be displayed on much higher time frames. Take a look at the image below.
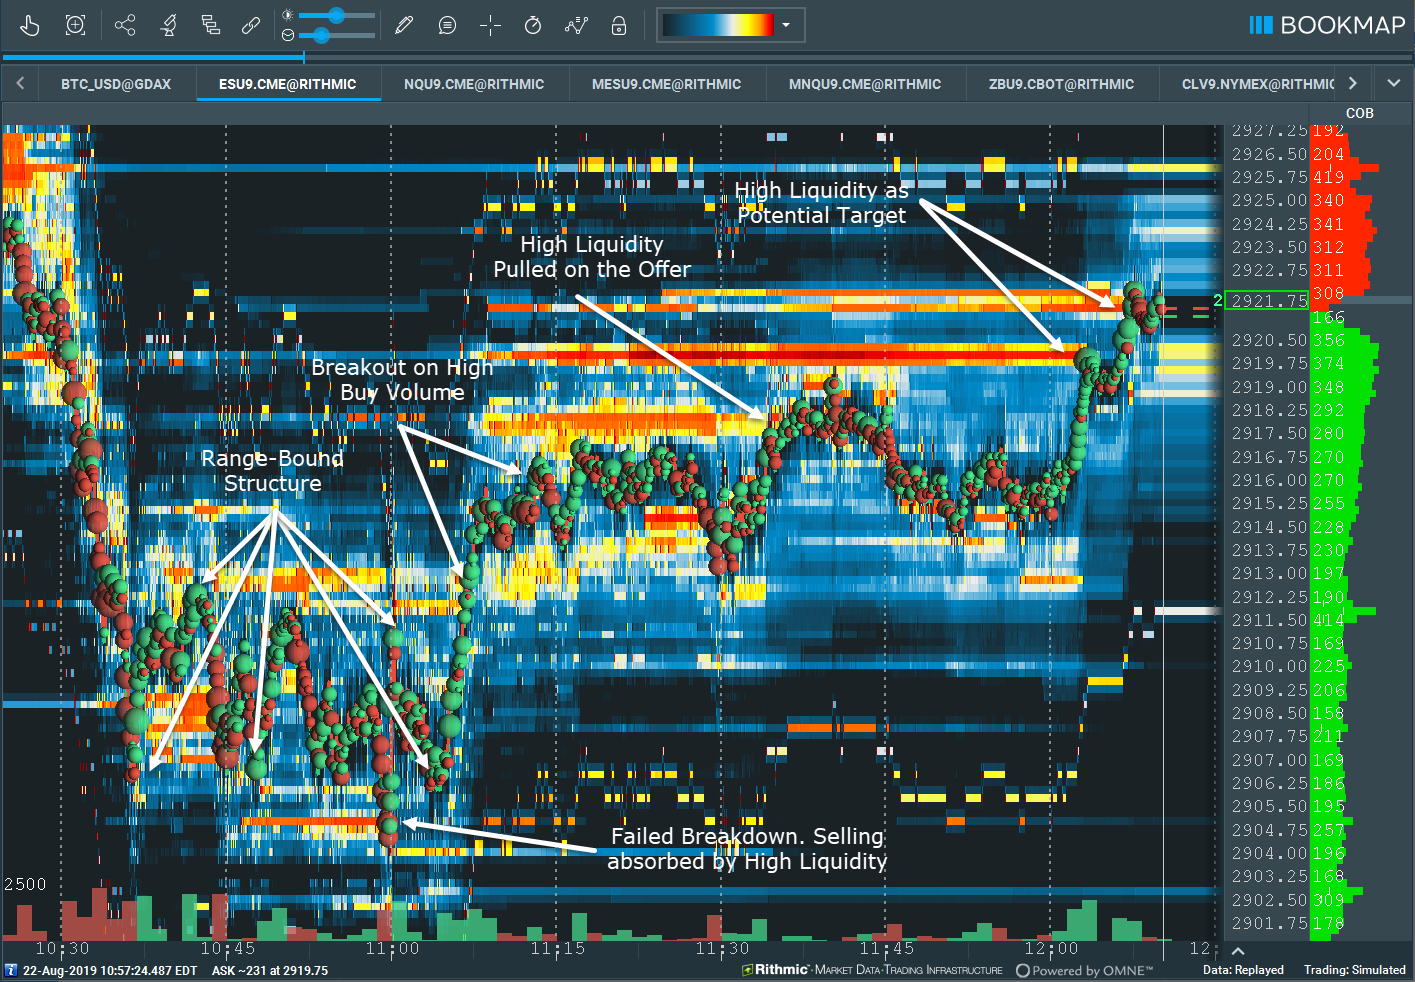
Higher Time Frame order flow visualization
A few hours of order flow data is visualized in the viewable chart. Notice it is almost the exact same market structure compared to the lower time frame example. Thus swing traders and position traders can utilize order flow data within an integrated view on the higher time frames simply by zooming out and reading the chart elements.
Identifying Algorithmic Activity such as Spoofing
In today’s markets, reading the order flow can be very difficult due to the intense flurry of algorithmic activity. The Time & Sales window is a blur as hundreds of small lots of transactions scroll by rapidly. In the DOM, the furiously changing liquidity values are quickly updated but not recorded; this makes it basically impossible to understand how long the liquidity was there if it was pulled, or added to another area, etc.
Let’s take a look at an order flow phenomena called spoofing in an integrated composite chart view. Spoofing occurs when very high liquidity aggressively adds into the order book very close to the BBO. It creates a large skew in the auction. In the image below, note very high liquidity pops into the order book near the Best Bid. Since Bookmap records all of the order book activity, it is easy to see this is an individual algo pulling and adding the liquidity higher. This skew of high demand combined with aggressive buying creates a powerful impulsive move to the upside. Also, note how the high liquidity on the offer pulls from the order book as price rapidly approaches. Trying to read the combination of all this activity within the DOM and Time & Sales would be very challenging indeed.
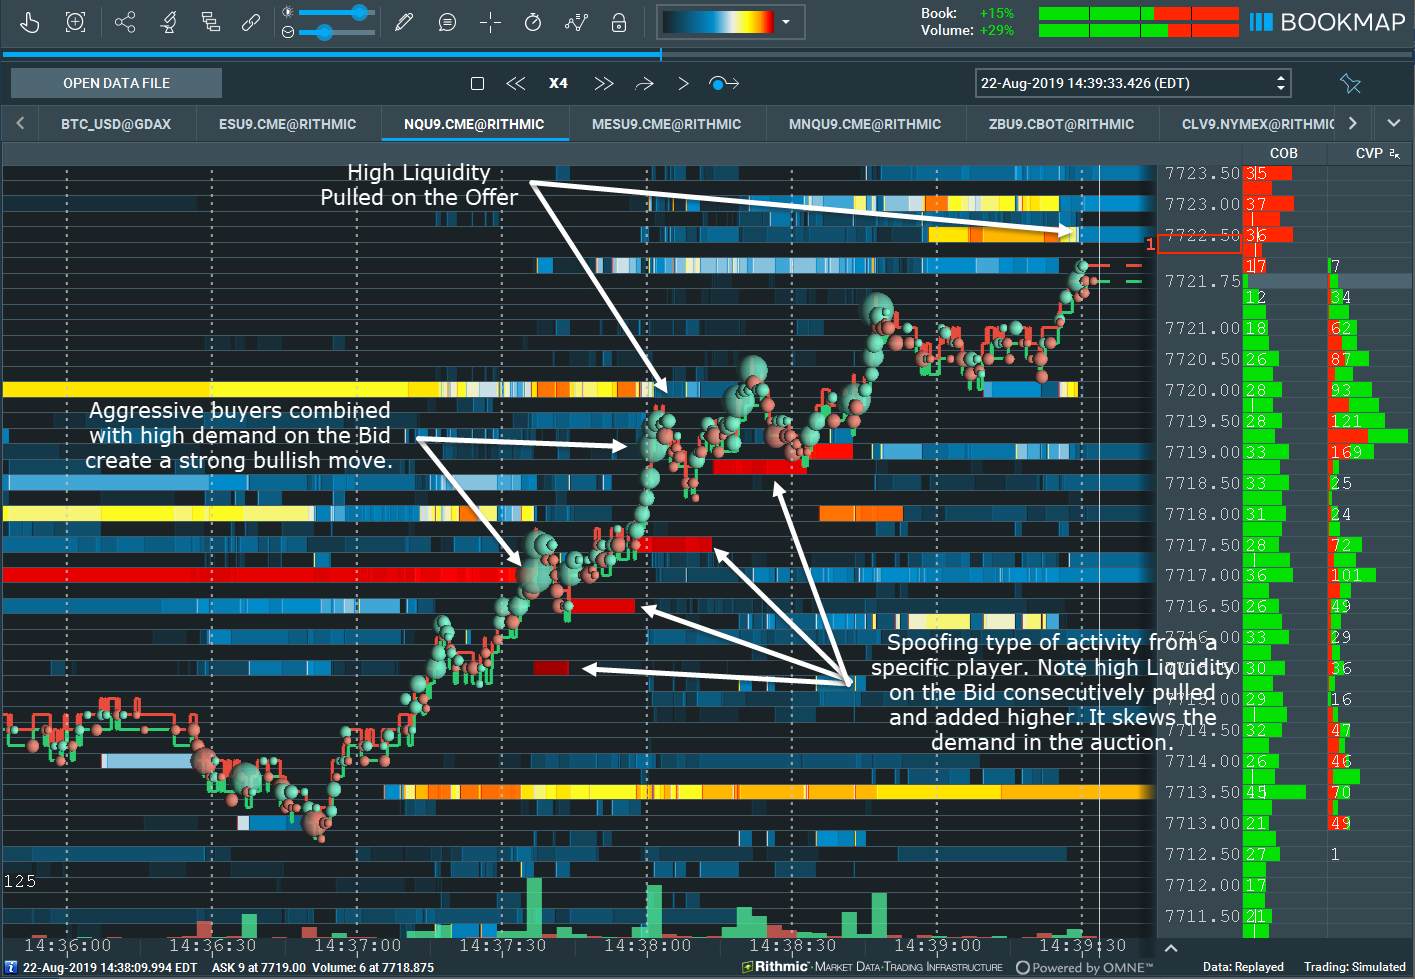
Spoofing type of activity on the Bid
Now let’s zoom out in this image to a higher time frame; we can witness the powerful effect this spoofing activity had on price; it initiated a much larger price move to the upside. Note how the algorithmic activity is still identifiable within a 15 minute viewable period of data. Being able to see all of this order flow activity on higher time frames is a unique advantage for traders.
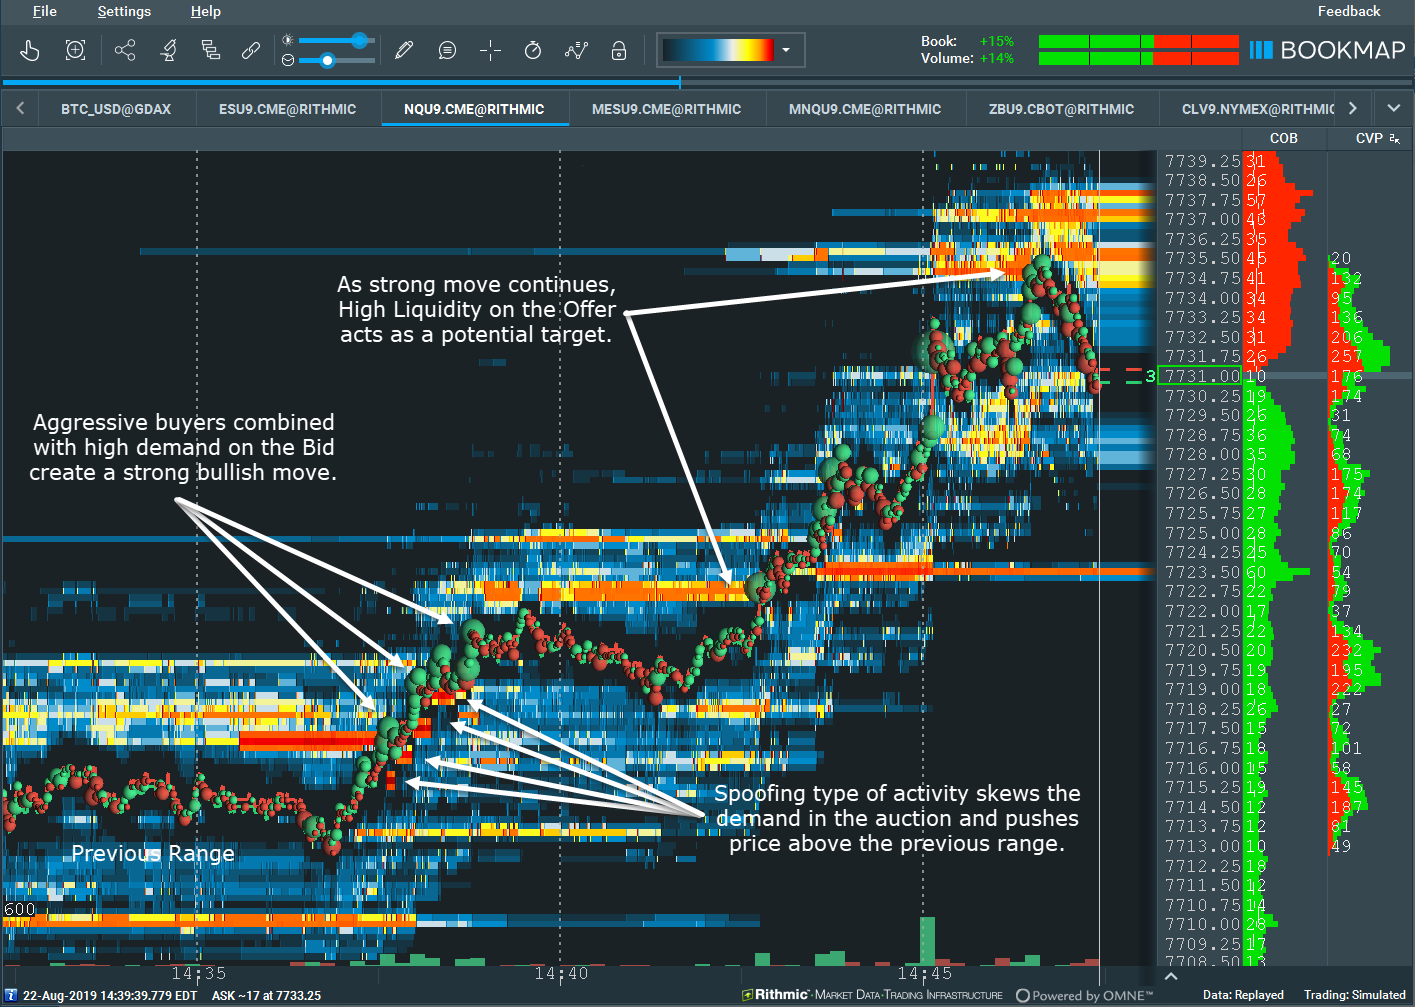
Higher Time Frame effect of algorithmic spoofing activity
It’s all about the Order Flow Integration, not just the Tape
As we can see, traditional tape reading does not give us a complete picture of what is truly happening in the market. To understand the complete order flow in the markets, we need access to the market structure, transactions, and depth of market liquidity. Indeed, this is a lot of information, but an integrated market view allows us to quickly and accurately read and react to the order flow in today’s algorithmic marketplace.