
Why Bookmap?
Bookmap Order Flow
- Raise Your Edge
It doesn’t matter if you’re a scalper, swing trader, or another type of day trader. As traders, we all have one thing in common - to find an edge in the market. Our pioneering order flow trading software has been designed to give you just that.
- Gain real-time order flow insight using the fully configurable limit order book (COB) and depth of market (DOM).
- Watch how the market evolves and reacts over time. “Tell the story” of recent price action with historic liquidity data.
- Identify incoming market volume, and watch absorption and exhaustion unfold to spot reversals before they happen.
Bookmap Heatmap
- Learn a Real Depth of the Market
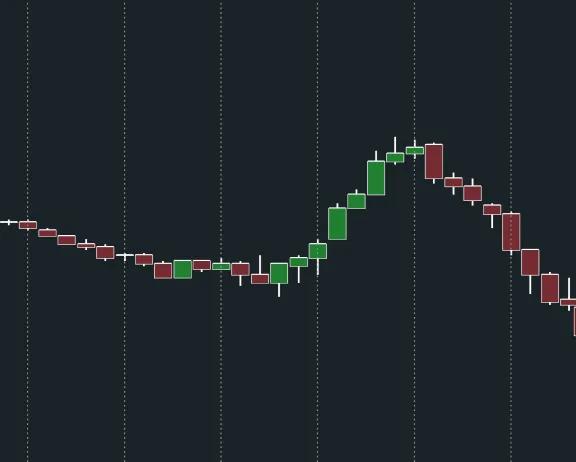
Despite being the most common chart type used among retail traders, a candlestick chart is also one of the most limited and restricted ways to represent market data. If you’re only using basic candlesticks in your day trading platform, you could be missing out on a staggering 90% of market data.
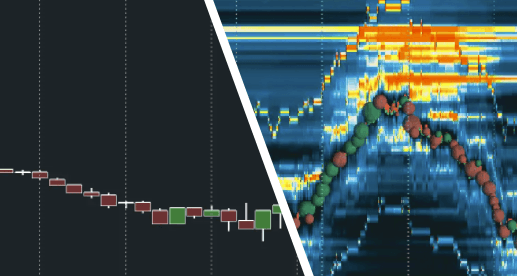
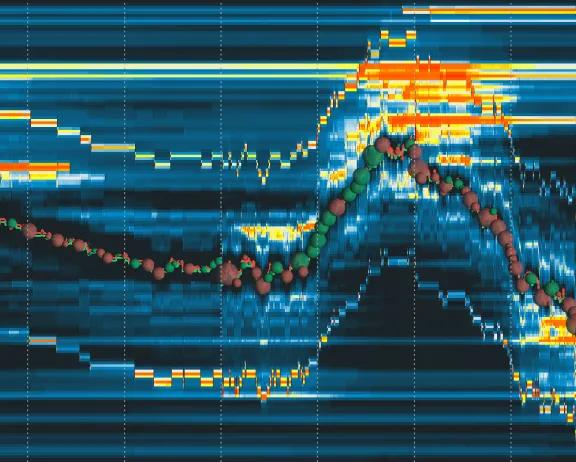
Candlestick Charts vs Heatmap
While a candlestick chart is great for organizing price action into specific time frames, it shows no information on the current spread (best bid and offer) or market liquidity (limit order book).
A heatmap on the other hand gives you all the insight of a footprint chart, volume profile, and DOM put together. Plus, it makes the information easy to digest and understand at a glance.
Visualization of the Historical Liquidity
By continually taking snapshots of the COB, our cutting-edge desktop trading software collects, stores, and plots historical order book data.
Adding a time dimension to the order book is extremely powerful and lets you visualize how incoming market orders react to established areas of intent.
Bookmap Value For Traders
If you’re a serious trader looking to maximize your profits, the Bookmap desktop trading platform provides a range of remarkable tools to help you increase your edge in the market and hit your trading goals:
Advanced Analytical Software for Tracking and Trading
Market analysis plays a huge role in every decision we make as traders. Bookmap is packed with advanced order flow indicators to detect, track, and understand market sentiment.
X-Ray LensInto the Order Flow
Gain insight that’s simply not possible using basic charting tools alone. Look under the hood to see actual order intent change over time.
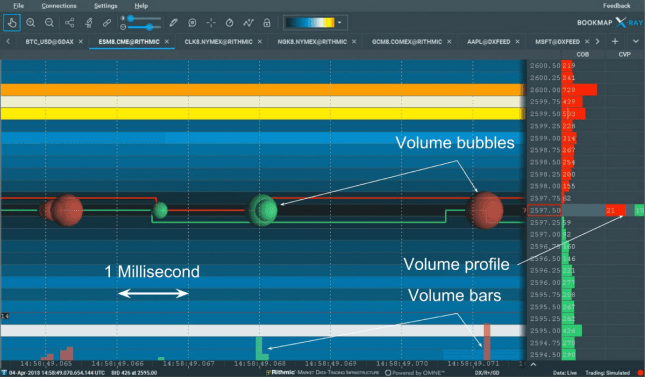
Millisecond Trading Data and Record & Replay Feature
Watch market dynamics unfold at 40 frames per second and react in real-time, or record live sessions to replay later. Execute simulated orders on full market depth data to test and optimize strategies.
Spot Spoofing, Large Lots and Algo Patterns
Watch how the heatmap evolves to uncover spoof orders that are added and pulled from the order book. Identify algorithmic activity or use the Large Lot Tracker to highlight dominant market participants.
Integration of Algorithmic Trading
Add additional layers of data to your own trading algorithm using the comprehensive Bookmap API. Combine order flow trading with existing strategies to increase your hit rate.
Essential Bookmap Features
Based on our expertise in HFT trading, Bookmap comes pre-packed with an extensive selection of day trading and scalping indicators that set it apart from other order flow trading platforms.
Imbalance Indicator
The order book imbalance indicator provides a snapshot of the current market sentiment. It allows you to quickly assess when trading activity is weighted in one direction to identify momentum or exhaustion points.
Strength Level Indicator
By comparing the available liquidity at a certain price with the actual number of orders that transacted at that price, the strength level indicator shows areas of hidden liquidity.
Iceberg Order Detection
Our cutting-edge add-on that is sold via the Bookmap marketplace detects stops and iceberg orders within the order book.
Large Lot Tracker
By seeing what percentage of the total liquidity is contained within a single large order, you can follow the behavior of dominant market participants.
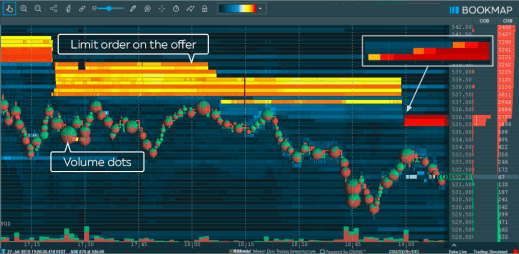
Volume Dots
Our fully configurable volume dots allow you to see the total volume traded or the volume delta (the buy aggressors minus the sell aggressors). You can even change the clustering mode and watch volume updates every nanosecond.
Bookmap is packed with many more advanced indicators and unique tools to help you find your edge in the market and trade with confidence.
You can even build your own customized indicators or browse 3rd-party add-ons available from our marketplace.
See the full list of
Bookmap features.
Still not sure or have questions?
Just visit our FAQ section
What Is Bookmap Trading?
Identify areas of intent from other market participants, watch incoming volume absorption or exhaustion in real-time, highlight areas of trapped or hidden liquidity, and discover many more order flow dynamics that are impossible to see on basic candlestick charts.
Why Is Bookmap Good Value for Traders?
Bookmap breaks down large complex data into an easily digestible form that you can understand and interpret quickly. This provides incredible value to traders that need to read the ebb and flow of the market and gauge the changing market sentiment.