
Absorption Indicator
Examples of Bookmap’s Absorption Indicator with Futures, Stocks, and Cryptocurrencies. To gain access to the Absorption Indicator, a subscription to the Bookmap Global+ version is required. Please access the Absorption Guide to understand more about the settings and installation.
Futures Absorption Examples
01. S&P e-mini
Classic front running buying absorption before the large level of liquidity transacts. This way, the front runners have a much higher probability of getting filled. Note the Stop&Iceberg Tracker captures a sell stop run into the high liquidity. Curious not to see Native Iceberg Transactions, however the Absorption Indicator might be displaying Synthetic Iceberg transactions. Note how the Absorption Indicator catches the bottom tick, and price moves upwards to fill the high liquidity on the offer.
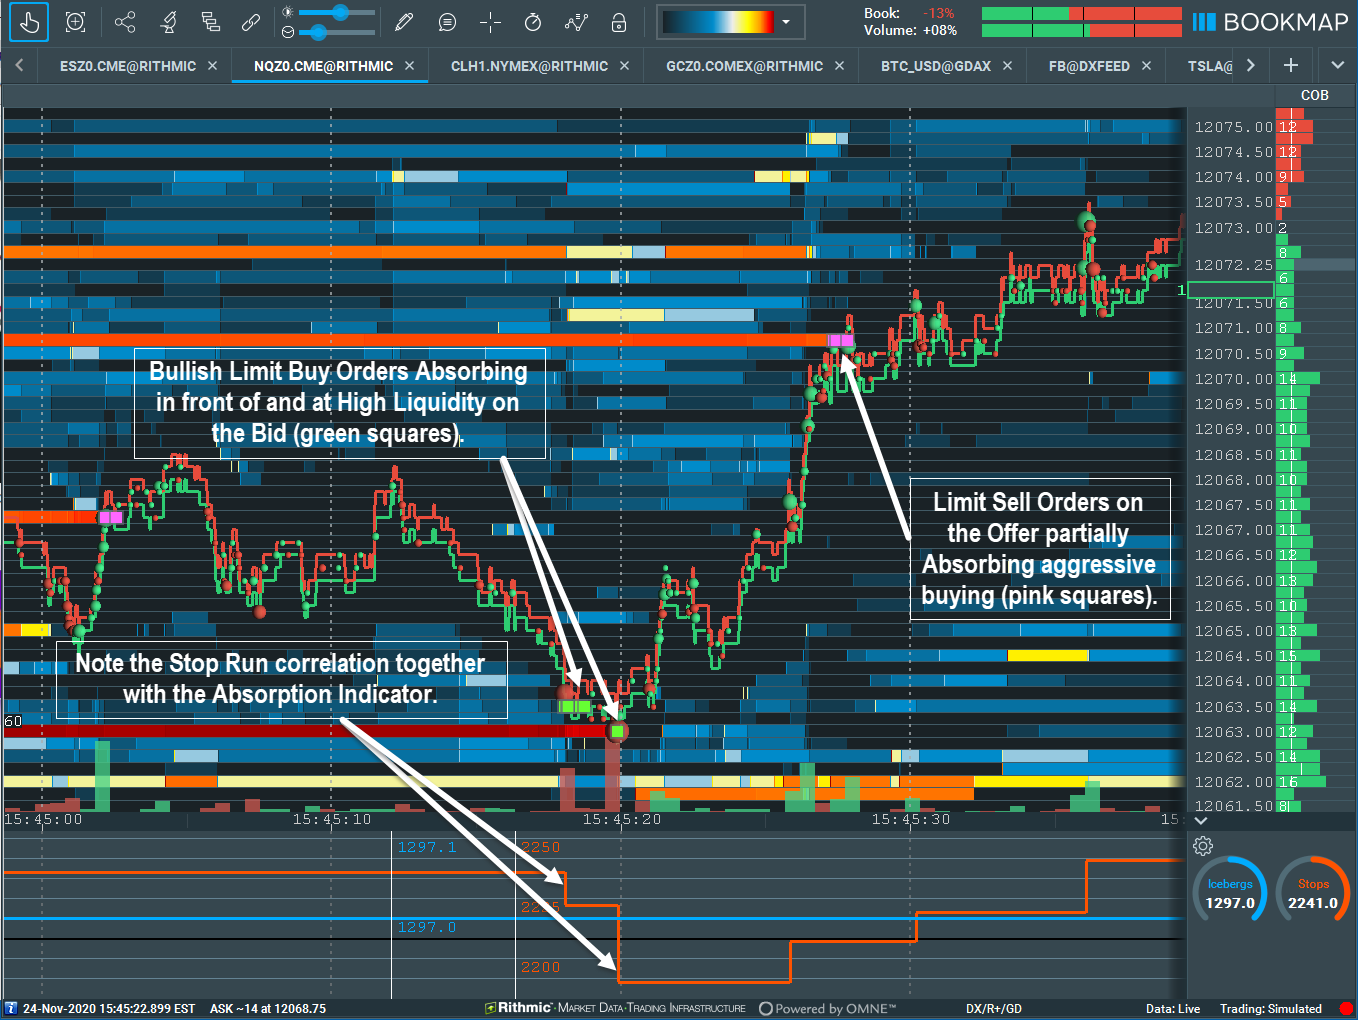
02. Nasdaq e-mini
A bullish price spike higher is followed up by beautiful buying absorbing on the bid on the pullback, just below the previous swing. Looking for the bullish trend to continue and trade towards high liquidity on the offer. Note the trapped selling absorption on the offer, just before the next price spike higher. The buyers are likely covering on the last price spike higher.
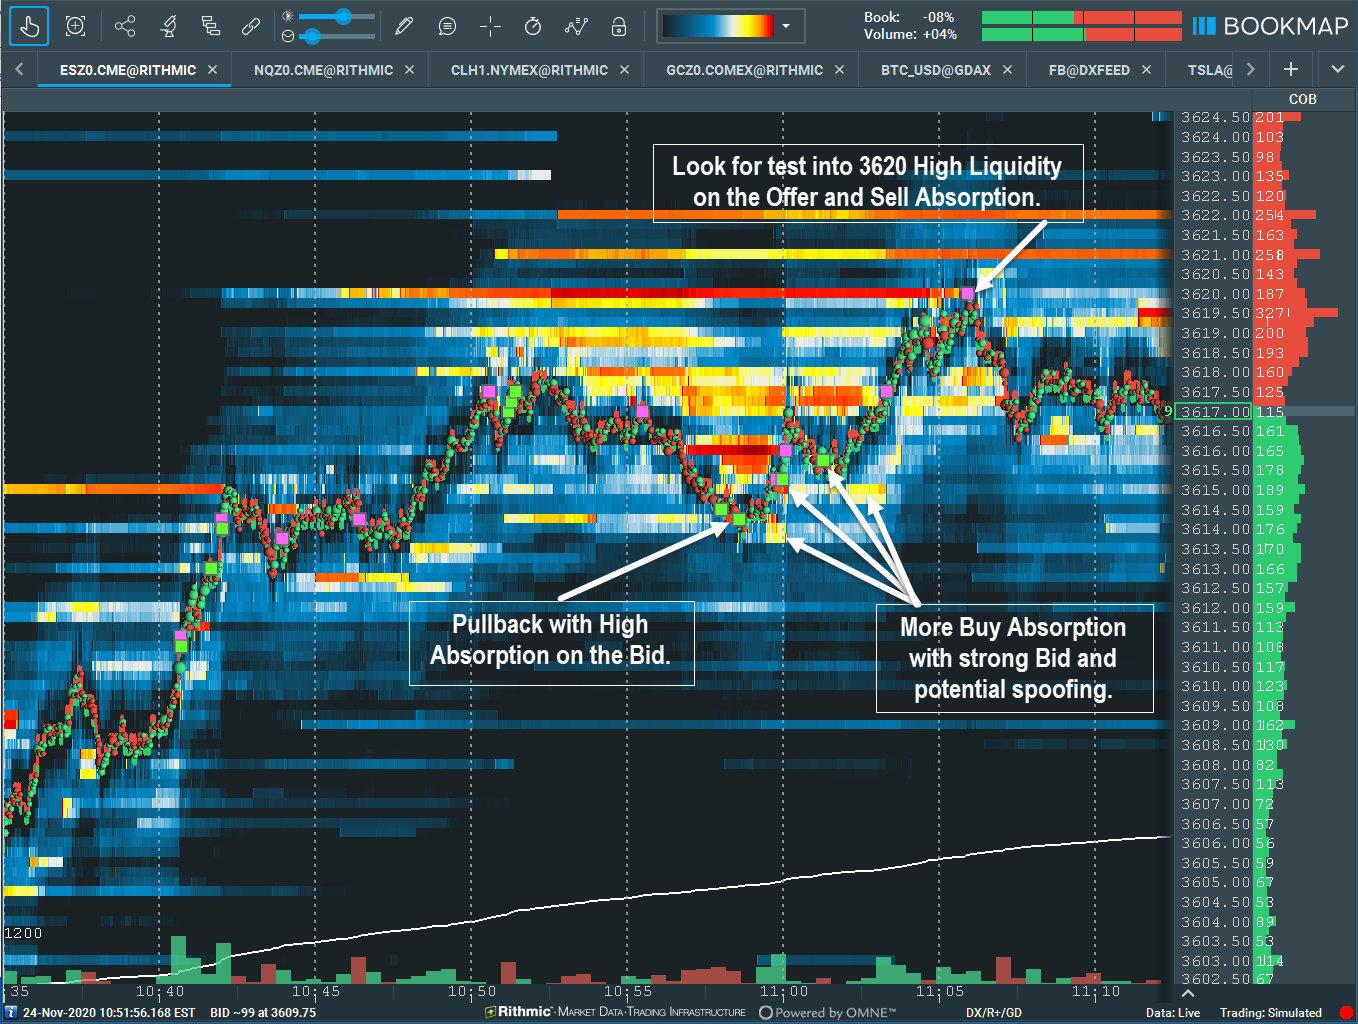
03. S&P e-mini
Another great example of buying absorption on a pullback within an uptrend structure — price is still making higher highs and higher lows. Note the heavy sell liquidity skew the auction and makes price dip into the first traunch of passive buying, then the liquidity flips to the bid and skews the auction to the upside and the second traunch of buying ensues. The high liquidity on the offer filled at 3620 verifies the potential target for the buyers.
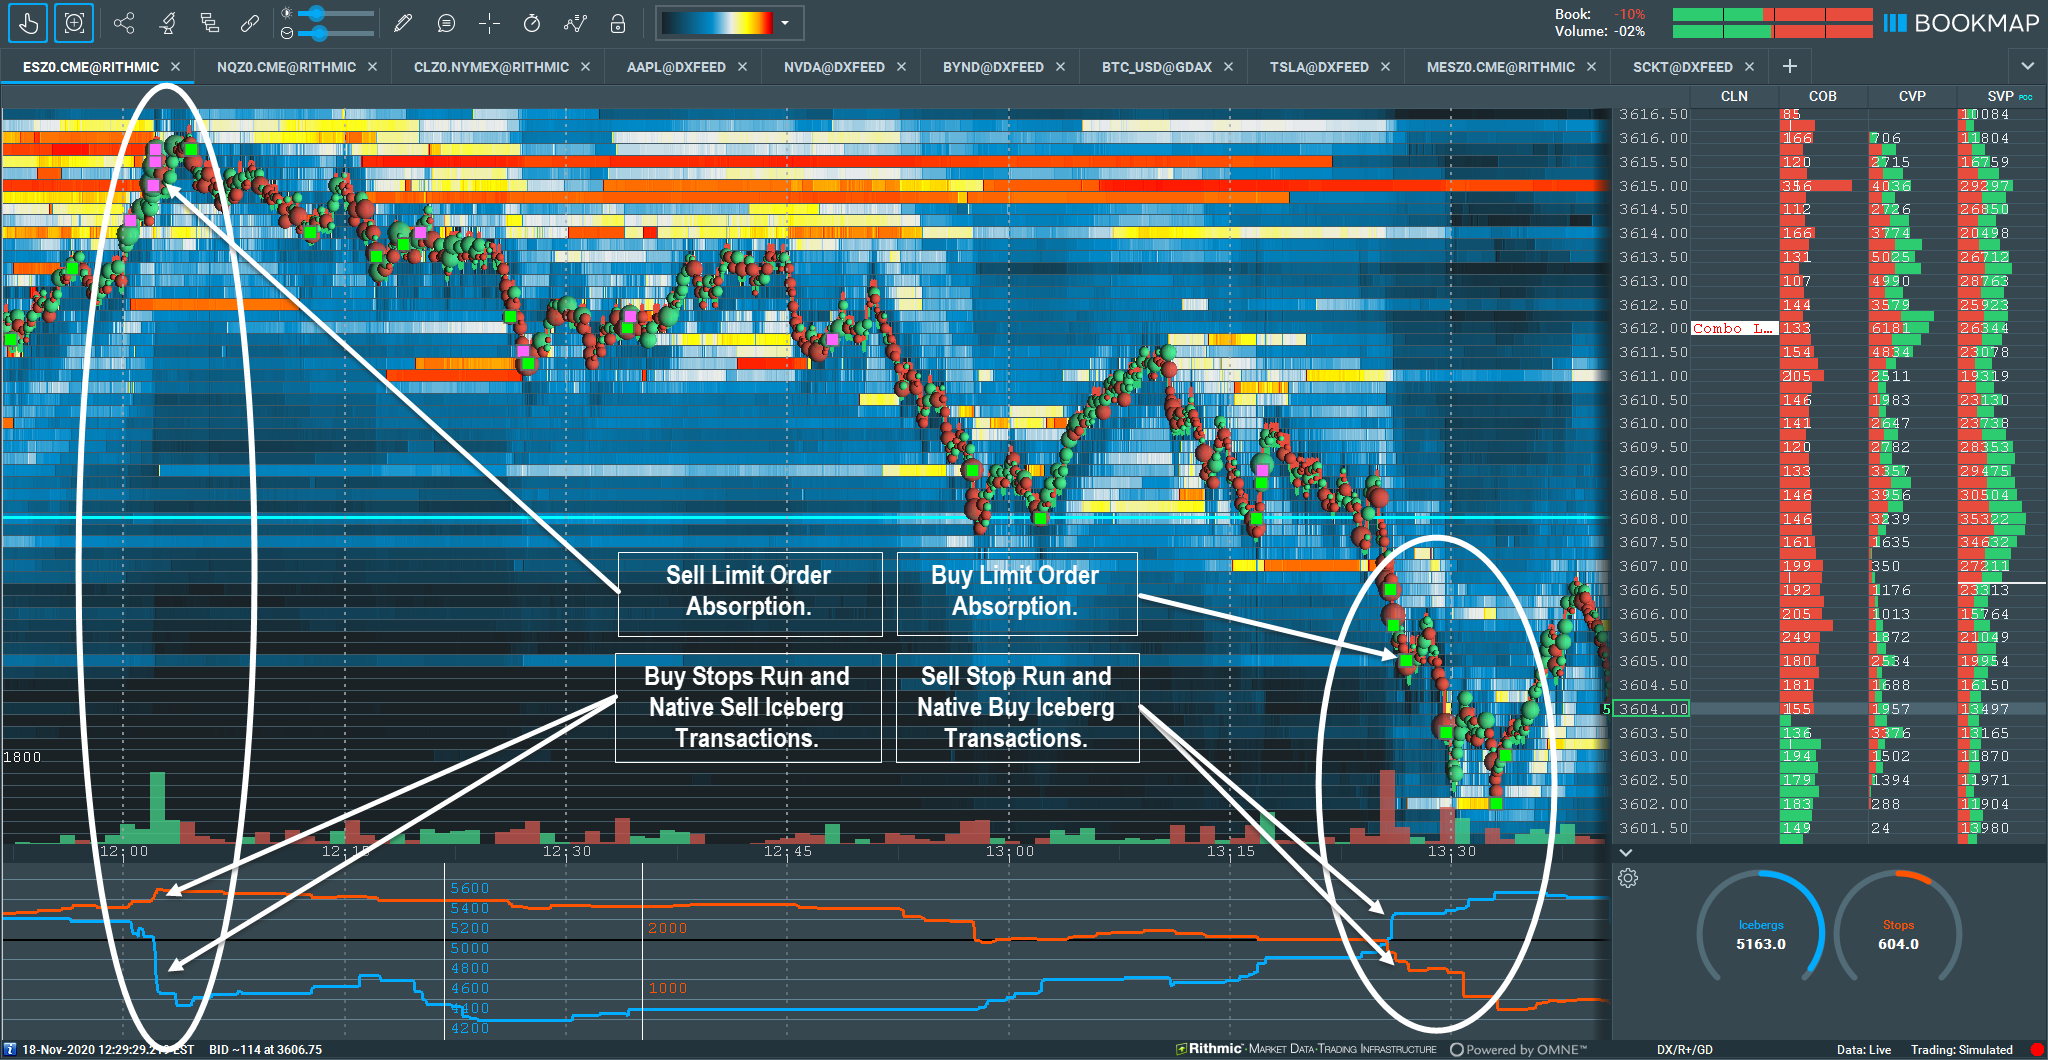
04. S&P e-mini
The Absorption Indicator will display any passive limit order transactions that meet the user inputted setting values. This means that extremely new aggressive high liquidity on the Best Bid/Offer (BBO) that flashed extremely quickly in the order book may not display in the heatmap, but the transactions of that high liquidity will be displayed by the Absorption Indicator. Moreover, both Native and Synthetic Iceberg hidden order liquidity will also be displayed by the Absorption Indicator. In the image above, note the incredible correlation between the Absorption Indicator Native Icebergs and Stops transactions in the Stop&Iceberg Tracker subchart. This is a frequent occurrence and offers enhanced insight within the order flow.
Stocks Absorption Examples
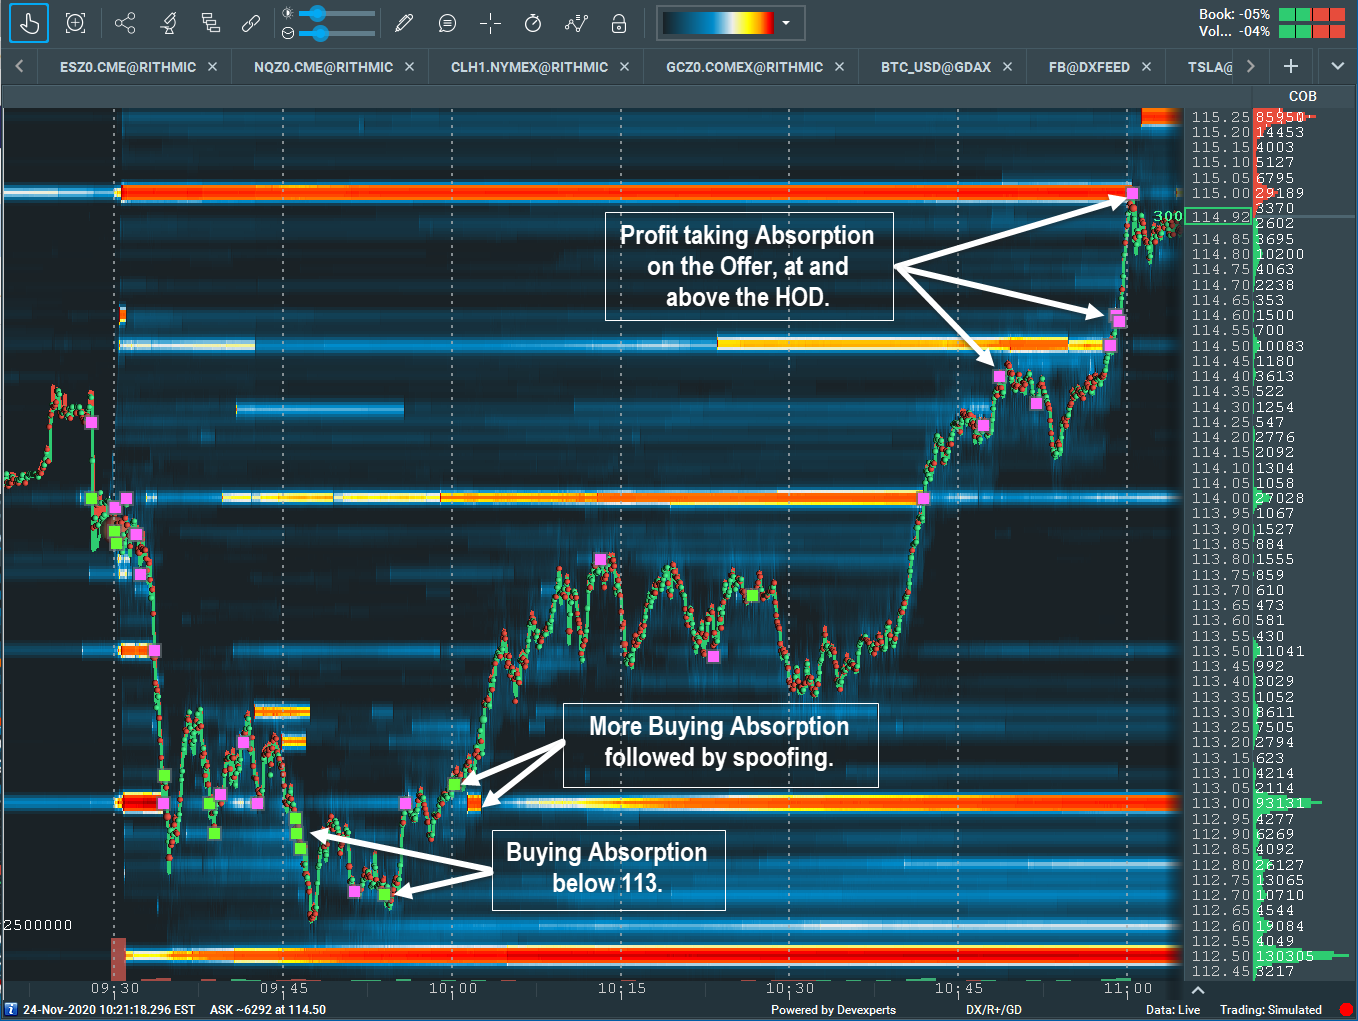
05. Apple (AAPL)
Price trades through high liquidity at 113, however the passive limit buying absorption occurs below 113. Look for this occurrence since this is likely the capitulation of sellers and absorption of savvy buyers scooping up discounted prices. Note the last bit of buying absorption just above the 133 price level, followed by a nice little spoof on the bid to push price higher. It appears buyers are taking their profits at the High of Day (HOD) of the Regular Trading Hours (RTH).
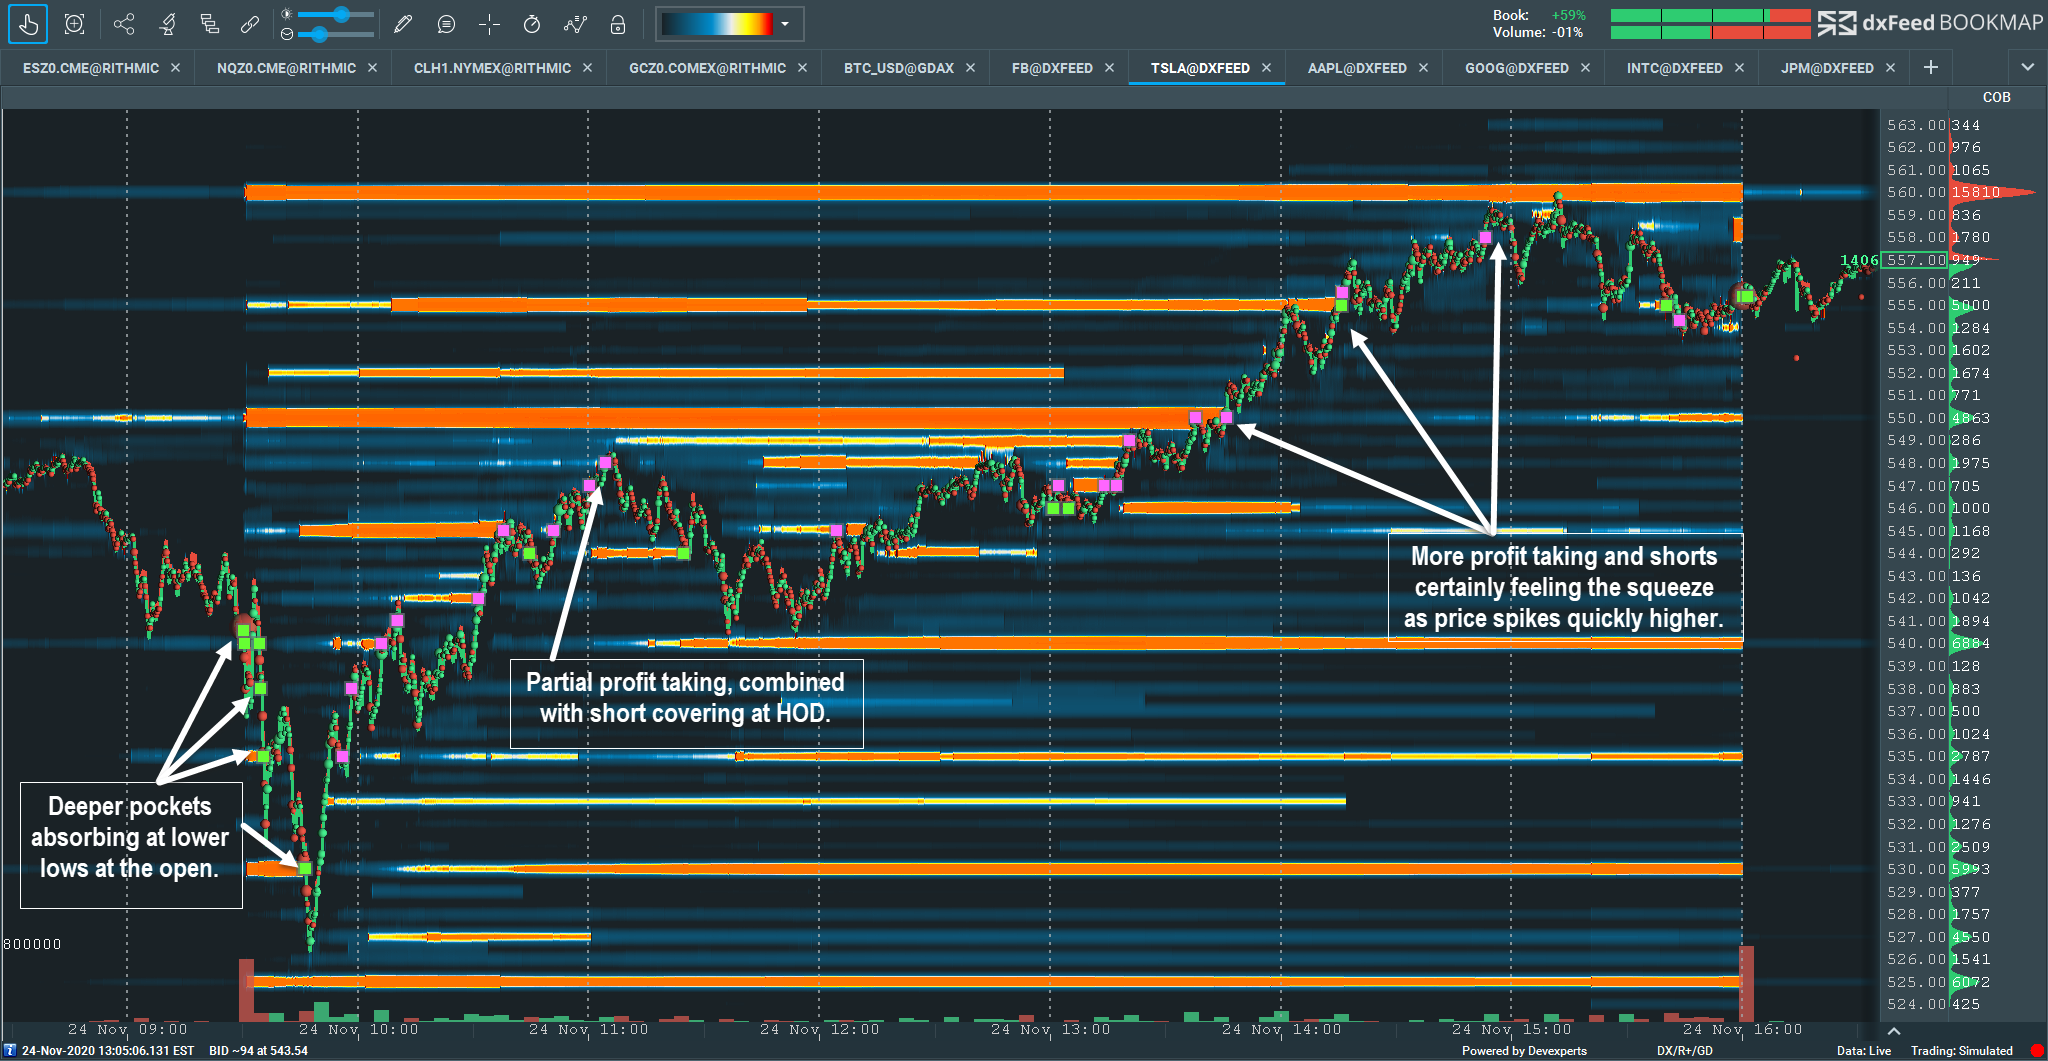
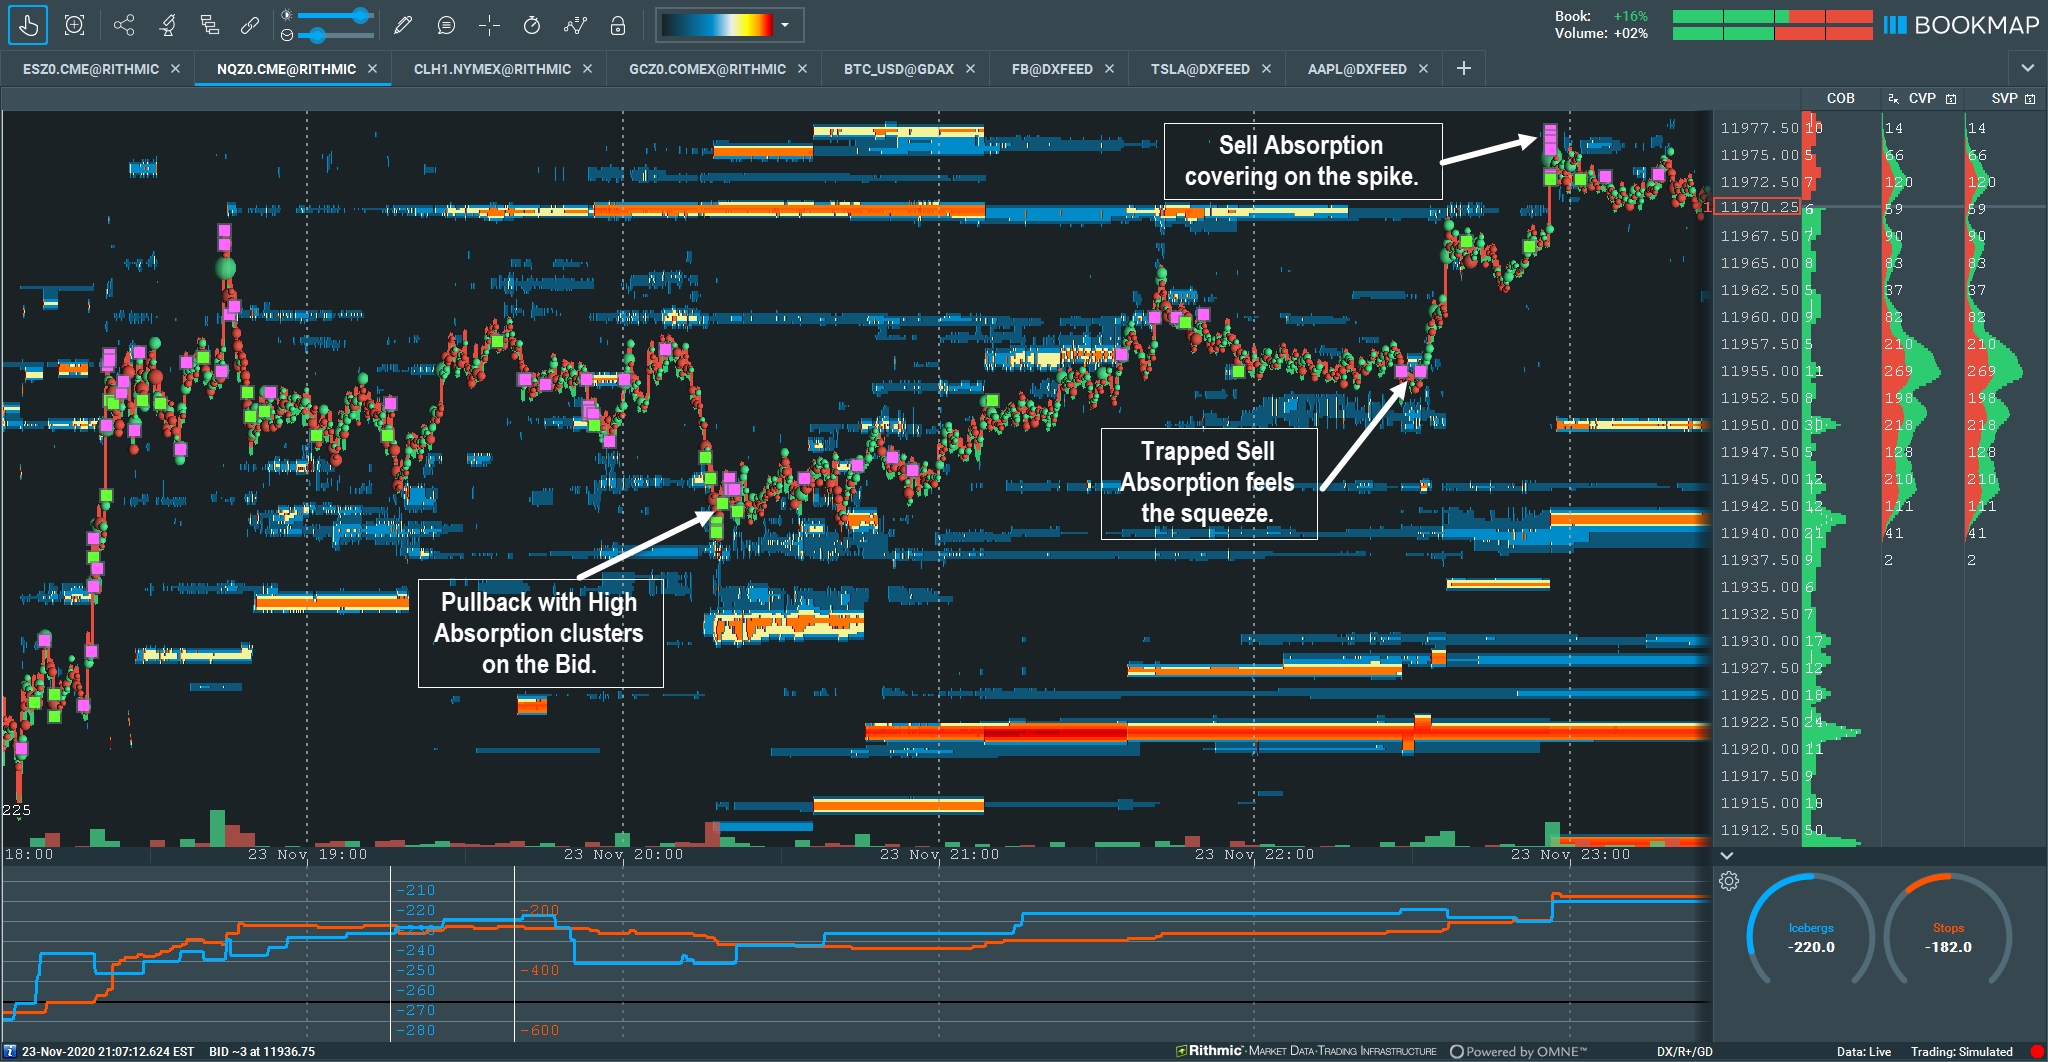
06. Tesla (TSLA)
In this example it appears the larger players at the open are in command of price for the entire day. It makes sense they would absorb as much as they can since TSLA recently was added to the S&P 500. There is high absorption on the bid as price quickly drops at the cash open and the deeper pockets continue to absorb. Some partial profit taking at the return to pre-market swing at 548. Then note any selling absorption on the offer simply cannot turn price around. These sellers are feeling the short squeeze and likely cover on the price spike above 550.
Cryptocurrency Absorption Examples
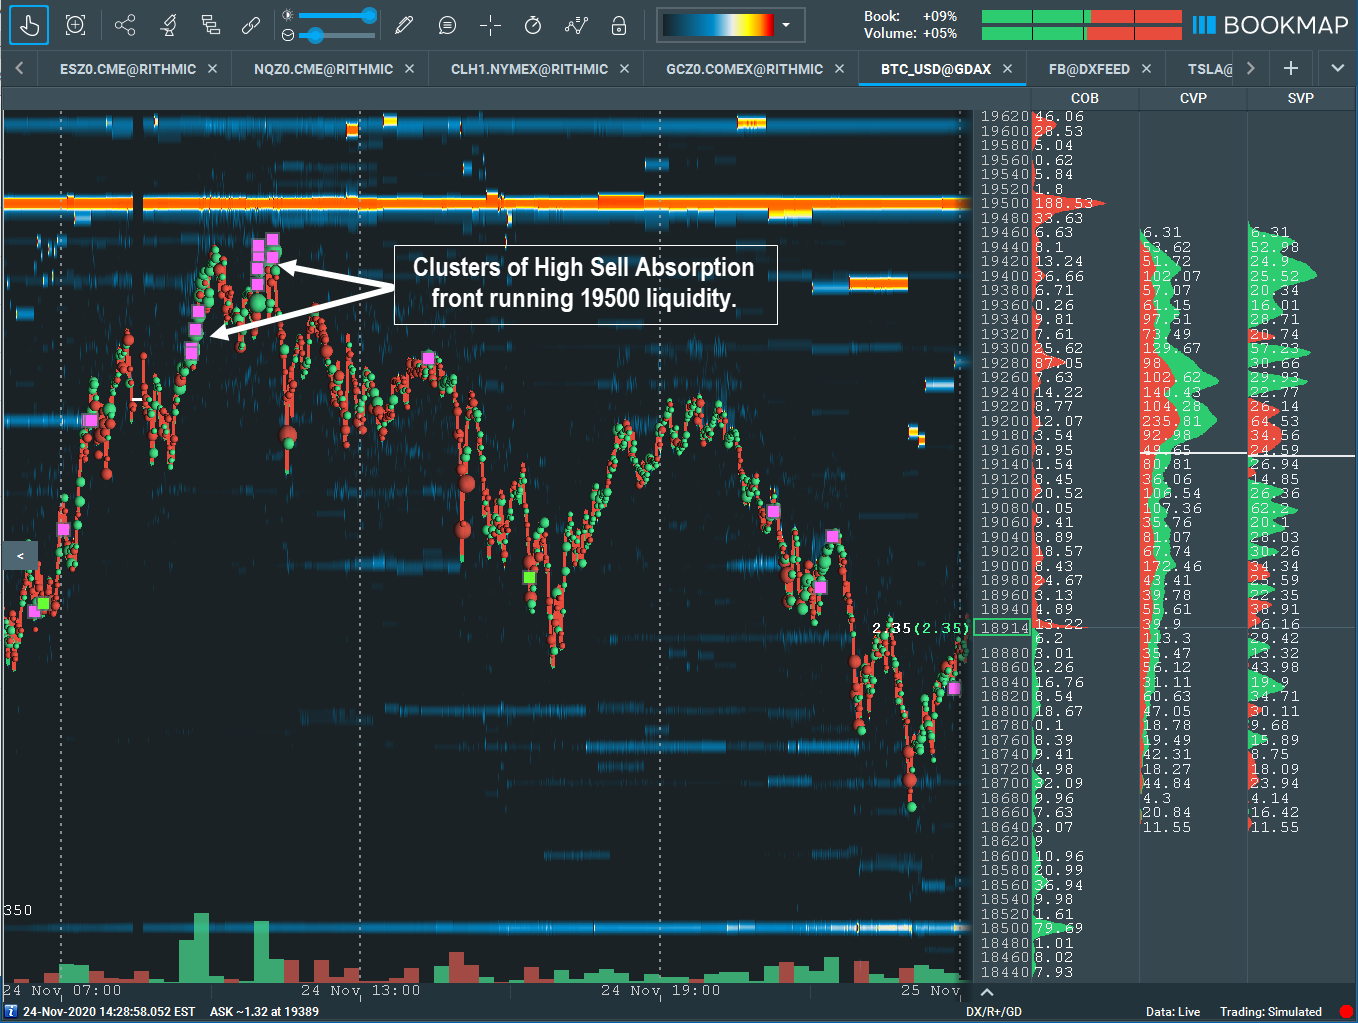
07. Bitcoin (BTC/USD)
An excellent example passive limit sell orders and potential profit taking front running the 19500 price level. These could also be synthetic iceberg transactions as well. Despite all the aggressive buying, price cannot make through the passive sell orders and a rather significant pullback unfolds.
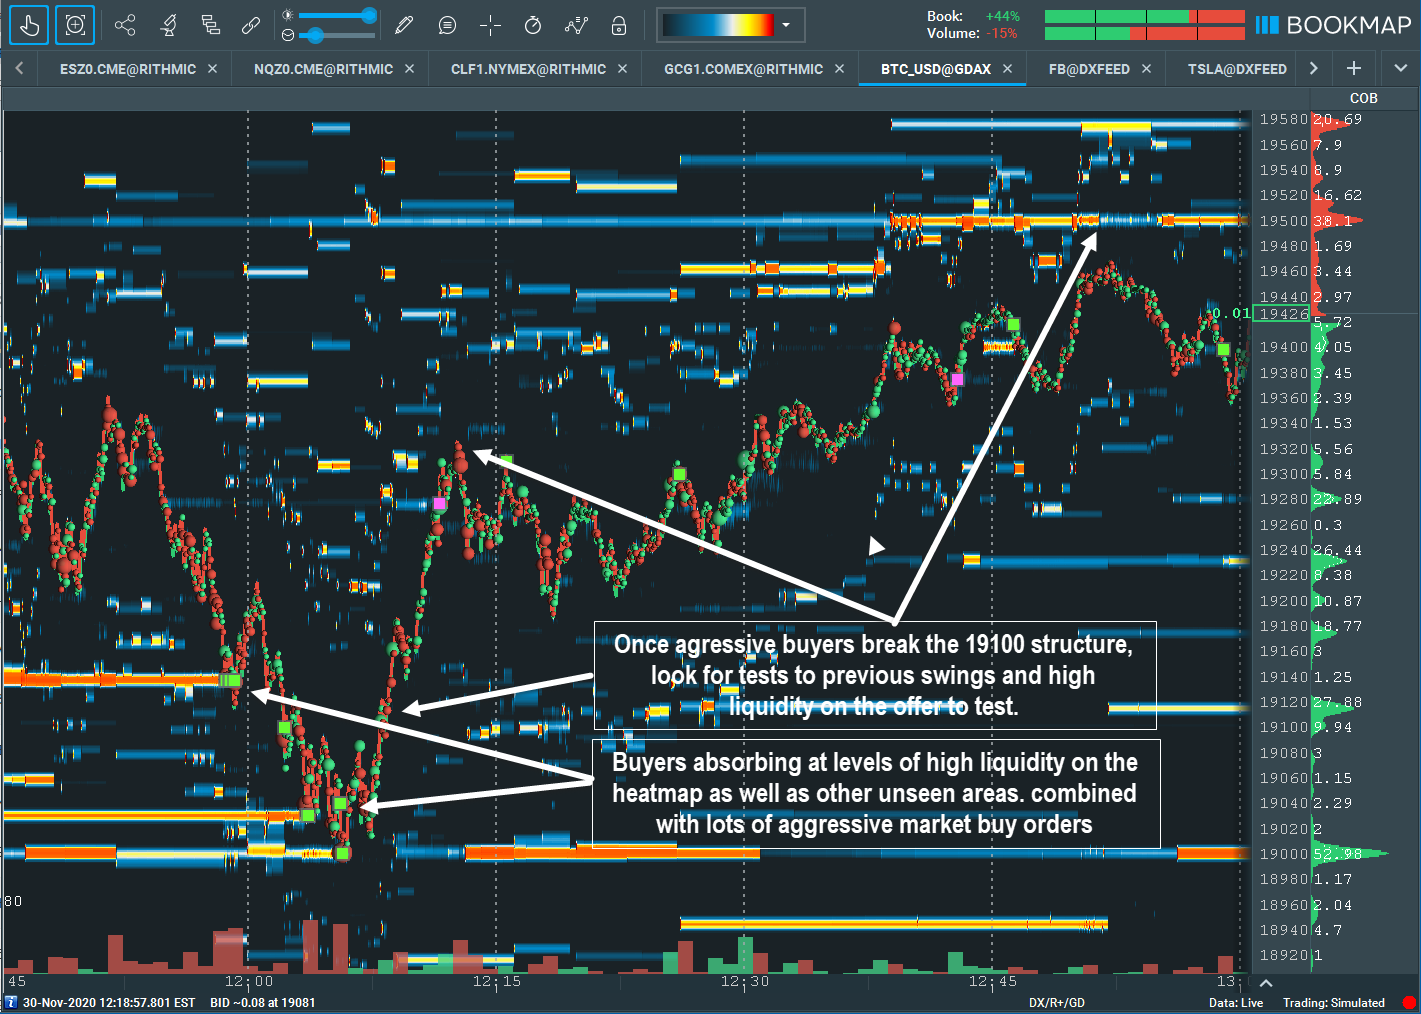
08. Bitcoin (BTC/USD)
Heavy absorption on the bid displayed by the heatmap. However, note the other areas of absorption not in the heatmap. This is where the Absorption Indicator shines. Synthetic Icebergs as well and very aggressive limit buy orders filling at the best bid are captured by the indicator. Combine that with aggressive market buy orders and a move above the 19100 structure leads to the market testing previous swings and high liquidity on the offer.