See trading more clearly in real time.
Compare plans to access deeper market visibility for trading.
Education
January 10, 2024
Updated
SHARE
How to Create a Trading Strategy: Journaling, Testing, and Management
 Ever pondered why some traders consistently excel while others face challenges? The answer lies in crafting a successful trading strategy.
In this article, we’ll guide you step by step in creating a trading strategy that’s not just flexible but robust – one that grows with you as a trader. Also, you will learn about some of the best backtesting techniques, risk-management tactics, and how to maintain a trading journal. Let’s dive in.
Formulating Your Trading Hypothesis
In the world of financial markets, a trading hypothesis is a statement that traders develop to guide their decision-making process. This involves preparing assumptions pertaining to:
- Market conditions
- Asset behavior
- Broader economic environment
Traders leverage hypotheses to anticipate future price movements and develop strategies for buying or selling financial instruments. Explicitly, it aids traders by:
- Establishing a clear decision-making framework, delineating expectations and assumptions.
- Pinpointing risks associated with their strategies.
- Evaluating anticipated market conditions and determining corresponding actions.
- Rigorously backtesting strategies against historical market data.
Validating Your Hypotheses: Backtesting
Backtesting is a process where traders test a trading strategy using historical market data to see how it would have performed in the past. Essentially, traders apply their strategy to previous market conditions to understand how well it might work in the real world.
Traders need to backtest their hypotheses. It helps in:
- Analyzing the practicality of the trading hypothesis in real markets
- Identifying potential risks and drawbacks in the strategy
- Conducting a historical performance review of the adopted strategy
- Adjusting and refining the strategy based on insights gained
The Mechanics of Backtesting
Let’s break this complex process into digestible steps:
Step I: Select a Hypothesis to Test:
-
- Clearly articulate the trading hypothesis you want to test.
- This may involve assumptions about market trends, indicators, or specific entry and exit conditions.
Step II: Acquire Historical Data:
- Obtain historical market data relevant to the period you want to test.
- This data should include:
- Price information
- Trading volumes, and
- Any other relevant indicators
Step III: Establish Trade Execution Rules:
- Outline the specific rules that dictate when to enter or exit a trade based on your hypothesis.
- This includes setting criteria for:
- Buy/sell signals
- Stop-loss levels, and
- Take-profit targets.
Step IV: Set up the Backtesting Environment:
- Use a reliable backtesting platform or programming language (e.g., Python with libraries like pandas and backtrader) to implement your rules on historical data.
- Allow the backtesting platform to simulate the execution of trades based on your defined rules.
Factoring in Real-World Conditions: How Important Is It?
During backtesting, it is crucial to consistently factor in real-world conditions, including transaction costs such as commissions and fees. Traders must also account for slippage, which is:
- The difference between the expected price of a trade
- The price at which it is executed
This ensures a more accurate simulation of real-world trading expenses.
Interpreting Backtesting Results
The secret to trading success and formulation of best trading strategies lies in the efficient interpretation of backtesting results. Let’s understand this analysis process through a hypothetical example.
Drawdown Evaluation
- Trader A sets a predetermined maximum drawdown threshold at 20%.
- After a series of trades, Trader A calculates that their maximum drawdown has reached 25%
- Response: Trader A reevaluates risk management.
- Actions considered: Tightening stop-loss, reducing position sizes, or diversifying the portfolio to prevent exceeding the 20% threshold.
Win Rate Assessment
- Trader A aims for a win rate of at least 50% for a balanced risk-reward scenario.
- Upon analysis, Trader A finds that their win rate has fallen to 40% over the last set of trades.
- Response: Trader A reassesses entry signal effectiveness.
- Actions considered: Revisiting entry criteria, incorporating additional indicators, or adjusting the strategy for better high-probability setups.
What traders can learn from this hypothetical scenario
Trader A uses concrete thresholds (20% for drawdown and 50% for win rate) to trigger a review and potential adjustment of their trading strategy. Similarly, traders must follow a proactive approach to risk management and strategy refinement based on measurable performance metrics.
How to Enter an “Iteration Phase”?
Based on the initial backtesting results, enter an iteration phase where you make systematic adjustments to your strategy. This involves:
- Refining indicators
- Optimizing stop-loss levels, or
- Considering different financial instruments.
Furthermore, keep a detailed record of each adjustment made during the iteration phase to track the impact on performance. After making adjustments, repeat the backtesting process to assess the impact of changes on the strategy’s overall performance.
Cultivating a Trading Edge

Traders can identify their unique advantage in trading. This process involves recognizing individual strengths, skills, or insights that set you apart from other traders. Just as every person is unique, so is their approach to trading. Your unique advantage becomes your competitive edge, giving you the ability to stand out in a crowded and competitive market. Let’s understand the process of identifying your unique advantage.
Identify Your Unique Advantage
Understand this discovery process through the hypothetical example of two traders:
| Type of Trader | Approach | Strengths | Weaknesses |
| Market News Day Trader | Relies on up-to-the-minute market news to predict short-term price movements |
|
|
| Technical Trader | Utilizes technical analysis and pattern recognition for decision-making |
|
|
The Scenario
An unexpected economic announcement causes a sudden market surge. Here’s how the two traders discussed above reacted to the situation:
| Market News Day Trader | Technical Trader |
|
|
This case study illustrates that:
- Every trader’s approach has strengths and weaknesses.
- Market news day traders capitalize on immediate events, while technical traders rely on systematic approaches.
- Traders must recognize their unique advantages and drawbacks.
- Post-identification, continuous refinement and adaptation to varying market conditions are crucial for sustained success.
How to Identify a Personal Edge
You can identify your edge by:
- Reviewing and analyzing your past successful trades
- Regularly observing market behavior and looking for:
- Recurring patterns
- Trends, or
- Anomalies
- Maintaining a trading journal detailing each trade, including:
- Entry and exit points
- Appropriate reasoning, and
- List of trading emotions triggered
- Evaluating your skills and strengths as a trader.
- Staying informed about new market developments, tools, and strategies.
- Developing a robust risk management strategy that aligns with your trading style.
- Establish a feedback loop by regularly reviewing and adjusting your trading strategy based on performance.
Experimentation and Edge Refinement
Experimental trades allow you to test a new edge with minimal risk. This safeguards your capital while providing valuable insights into the viability of the strategy. In the experimental phase, any losses incurred are part of the learning process which helps in fine-tuning and optimizing your strategy.
Experimental trades can be conducted in a controlled environment using micro-futures. It is a simulation account or a small position size to limit potential losses.
How to Refine an Edge
If your trading edge is based on a specific technical indicator, consider backtesting alternative indicators from the same family. For example, if you rely on Moving Averages, experiment with different lengths or types (simple vs. exponential) to find the most reliable configuration.
Protective Measures: Risk Management

Risk management protects traders from catastrophic losses. By systematically assessing and mitigating potential risks, traders safeguard their capital from the unpredictable nature of financial markets. Effective risk management involves:
- Setting clear stop-loss levels
- Defining position sizes
- Diversifying portfolios
Let’s understand its implementation.
Implementing Tactical Risk Strategies
Traders who implement tactical risk strategies gain the psychological fortitude needed to make rational decisions. They tend to prevent emotional reactions and increase their probability of achieving long-term success. Let’s understand through a hypothetical example of two traders:
| Aspects | Thriving Trader | Bankrupt Trader |
| Approach | Implements disciplined risk management strategies, including:
|
|
| Outcome |
|
|
What are the Various Risk Management Techniques?
See the table below for some common and effective risk management techniques:
| What is the technique? | What does it mean? | How IS IT practiced in the market? |
| Stop Losses | It is a predetermined point at which a trader will exit a losing position to limit losses. |
|
| Risk/Reward Ratio | Traders compare the potential profit of a trade to its potential loss. |
|
| Position Sizing | Traders determine the amount of capital allocated to a single trade. The aim is to limit exposure. |
|
| Diversification | Traders spread risk across different assets or markets to reduce the impact of a single loss. |
|
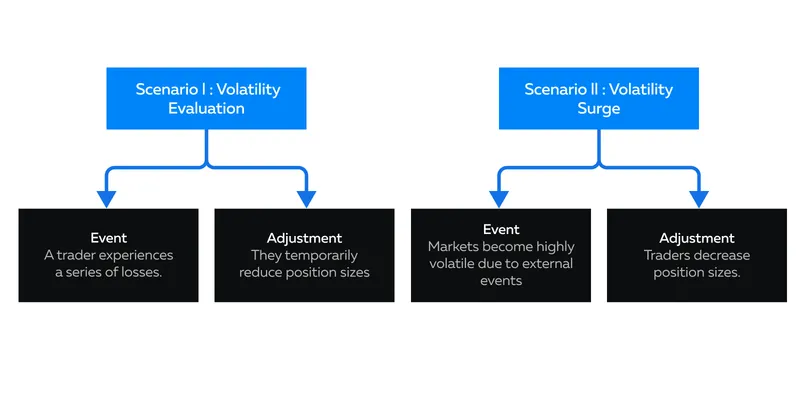
Dynamic Risk Adjustment
Traders perform several trade adjustments in real time. These are mostly based on:
- Volatility-Based Adjustments: A trader increases or decreases position sizes during periods of high or low market volatility.
- Performance-Driven Adjustments: A trader adjusts risk parameters based on recent performance. They consider factors like winning streaks or losing streaks.
Let’s understand this concept through different scenarios in which a trader adjusted risk parameters based on performance analytics derived from their trading journal.
Forward Testing: Validating Your Strategy in Real-Time
Most traders perform forward testing to validate their trading strategy. It can be performed in the following manner:
- Demo/Simulation Testing:
-
-
- Implement the trading strategy in a simulated environment to assess its viability without risking real capital.
- This type of testing identifies potential flaws or weaknesses in the strategy before exposing real money.
-
- Live Market Testing:
-
- Post-simulation testing, traders can gradually transition to live trading with real capital.
- Live testing helps in:
- Validating the strategy in real market conditions and,
- Making adjustments based on live performance.
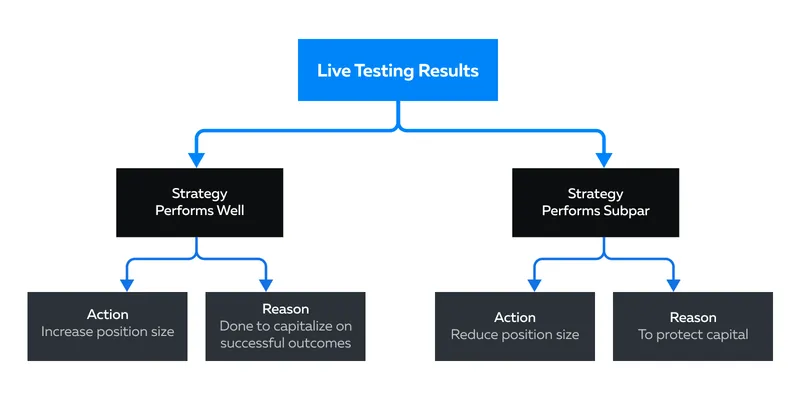
How to Do Size Adjustment Based on Live Testing?
It is a common practice for traders to modify position sizes based on the results of live market testing. They make the following adjustments:
How to Form a Cohesive Trading Strategy
A cohesive trading strategy aligns various elements such as:
- Trading hypotheses
- Risk management, and
- Edge refinement into a unified framework
The primary benefit of a cohesive trading strategy lies in its ability to provide clarity, consistency, and adaptability for traders. Let’s dive deeper.
Integrating the Elements into a Coherent Framework
To develop a successful trading strategy, the integration of key elements into a coherent framework is paramount. Here’s a detailed weekly exploration of the process:
- Journal Review (Week 1-2):
-
-
- Analyze the last quarter’s journal entries for insights.
- Identify recurring patterns, emotional triggers, or areas for improvement.
-
- Identify Actionable Tweaks (Week 3-4):
-
-
- Translate journal insights into actionable tweaks for your trading strategy.
- If impulsive trading during high volatility is a recurring issue:
- Adjust the strategy to include a checklist or,
- Pause before executing trades during volatile periods.
-
- Backtesting New Ideas (Week 5-6):
-
-
- Develop and backtest new strategies or tweaks based on journal insights.
- If a pattern of missed opportunities is identified, test a new indicator or entry signal to capture those opportunities.
-
- Evaluate Backtesting Results (Week 7-8):
-
-
- Assess the performance of the refined strategy through backtesting.
- If the new indicator improves profitability and aligns with risk tolerance, consider incorporating it into the strategy.
-
- Risk Parameter Assessment (Week 9-10):
-
-
- Evaluate the effectiveness of current risk parameters.
- Adjust risk parameters based on recent market conditions and performance.
- If recent losses exceed the predetermined threshold, temporarily reduce position sizes to protect capital.
-
- Incorporate Real-Time Adjustments (Week 11-12):
-
- Dynamically adjust risk parameters during live trading based on ongoing market analysis.
- If market volatility suddenly spikes, reduce position sizes to mitigate potential losses.
Quarterly Strategy Review Checklist
| Week | Action | Steps |
| 1-2 | Journal Review |
|
| 3-4 | Backtesting New Ideas | Test new indicators or entry signals based on journal insights |
| 5-6 | Risk Parameter Assessment | Evaluate the effectiveness of current risk parameters |
| 7-8 | Strategy Refinement | Integrate insights, backtesting results, and risk adjustments into a refined strategy |
| 9-12 | Implementation and Monitoring |
|
The Foundation of Strategy: Journaling Your Trades
A trade journal provides a structured record of trading activities, decisions, and emotions. It serves as a mirror, allowing traders to reflect on their actions, decisions, and emotional states during each trade. By reviewing entries, traders can identify:
- Patterns of success and failure
- Strengths and areas for improvement.
Additionally, a trade journal acts as a repository of experiences that traders can analyze to refine their strategies. By documenting the rationale behind each trade and its outcome, traders can make informed adjustments to their strategies, leading to continuous improvement.
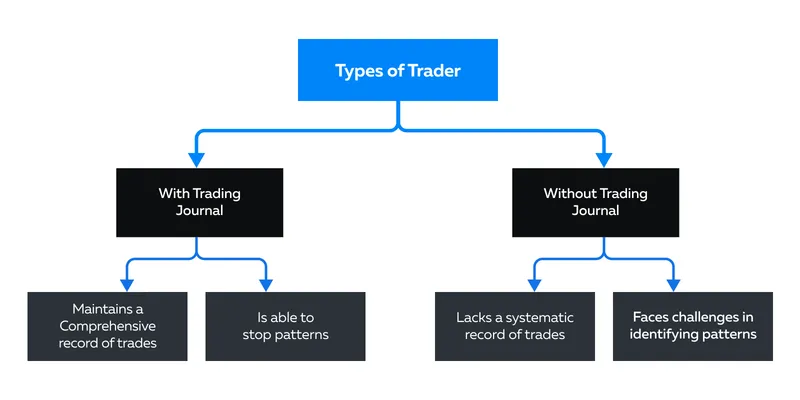
Crafting Your Trading Journal
A trade journal is a powerful tool that goes beyond a mere record-keeping function. It serves as a source of continuous learning and acts as a guide for strategic refinement. Let’s understand the importance of having a trade journal through a comparison of two hypothetical traders:
The Must-Have Elements in a Trading Journal:
| Elements | Explanation |
| Trade Date/Time | Record the date and time of each trade for chronological tracking |
| Instrument | Specify the financial instrument or asset traded in each entry |
| Position Size | Document the size or quantity of the position taken |
| Entry/Exit Points | Note the entry and exit points of the trade |
| Trade Rationale | Provide a brief explanation of the reasoning behind each trade |
| Chart Screenshots | Attach screenshots of relevant charts for visual analysis |
| Emotional State | Reflect on your emotional state during the trade (e.g., confident, anxious, hesitant). |
| Trade Outcome | Summarize the outcome of the trade, including profit or loss |
Understanding Your Trade History
Not merely maintaining but the interpretation of trading journals holds the key. Let’s understand how traders can develop the discipline to periodically review the trading journal:
- Set Aside Weekly Time: Allocate a dedicated time each week to review your trading journal.
- Look for Patterns:
- Identify recurring patterns in successful and unsuccessful trades.
- Analyze common elements, triggers, or indicators associated with losses.
- Quantify Changes:
- Quantify changes needed based on identified patterns.
- For example, if common exit points lead to losses, consider adjusting stop losses accordingly.
Step-by-Step Guide to Creating a Summary Sheet
By creating a summary sheet from the trading journal a trader can enhance the efficiency of performance evaluation, strategic refinement, and goal alignment. Let’s see how to create it:
Step I: Calculate Key Metrics:
Use the data from your journal to calculate these two key metrics:
| Metric | Formula |
| Win/Loss Ratio | Total number of winning tradesTotal number of losing trades |
| Average Profit/Loss per Trade | Total ProfitsTotal number of Trades |
Step II: Identify Trends:
- Identify trends in your metrics over time.
- Look for improvements or deteriorations in your trading performance.
Step III: Tweak Strategies Based on Metrics:
- If the win/loss ratio is low, assess and refine entry and exit signals.
- Adjust position sizes or risk parameters based on the average profit/loss per trade.
Step IV: Document Changes:
- Document any changes made to your strategy based on the analysis.
- Keep a record of adjustments and the rationale behind them.
Conclusion
Creating a trading strategy involves a structured and iterative process, which includes planning, recording, analyzing, adjusting, and managing. From formulating hypotheses to implementing risk management, each stage contributes to strategy development.
Traders can form flexible and robust trading strategies through journaling, backtesting, fostering adaptability, and continually improving. Additionally, the traders must stay disciplined and strictly follow the developed risk management tactics to safeguard capital and huge potential losses.
Now that you understand the building blocks of a strong trading strategy, it’s time to put theory into practice. But with so many strategies out there, how do you choose the one that aligns best with your trading goals and personality?
For further guidance, head over to our article on how to choose a trading strategy where you’ll find valuable tips on selecting a strategy that fits you. Dive in to learn more and refine your approach to the markets!
Sign Up Now