See employment reports more clearly in real time.
Compare plans to access deeper market visibility for employment reports.
Education
May 15, 2025
SHARE
How to Trade Major Employment Data Like a Pro

Every first Friday or mid-week! The surprise from employment data influences forex pairs, stock indices, and bond futures.
But trading these reports isn’t about predicting the number—it’s more about reading the reaction. Whether it’s NFP, ADP, or JOLTS, markets respond not just to the data but to how it compares to expectations. Are you still chasing the first spike? Stop!
In this article, we will tell you how to watch order flow and liquidity. You will understand how to use our real-time market analysis tool, Bookmap. Using it, you can get a clearer picture beyond price charts. So, want to trade job reports like a pro? Read this article till the end to learn how to read real market reactions and manage volatility with confidence.
Why Employment Reports Can Rapidly Shift Market Direction?
Employment reports are among the most watched pieces of economic data. Usually, they cause major price movements across:
- Stocks,
- Bonds, and
- Currencies.
However, the numbers alone don’t tell the complete story! It is how they compare to market expectations and what they imply about the future. Let’s understand in detail:
How Does Job Data Affect Market Expectations?
When traders trade employment reports, they do not only look at whether jobs were added or lost. Instead, they compare the actual data to forecasts.
For example:
- Say the economy adds 200,000 jobs in a month. Now, this might seem strong.
- But if markets expected 300,000, it’s considered a disappointment.
- On the other hand, if expectations were for 100,000, then 200,000 would be very positive.
This difference between expectations and reality often leads to sharp moves in asset prices. That’s because traders quickly adjust their positions based on the surprise.
The Role of Context in Interpreting Employment Data
Please note that context matters as much as the data itself. For example:
- Say a strong Non-Farm Payrolls (NFP) report was released.
- Still, it might not be bullish if markets were hoping for weaker data to justify interest rate cuts from the Federal Reserve.
- In this case, good news can actually be seen as bad news for risk assets like stocks.
This is why order flow (the actual buying and selling activity) can shift dramatically right after the release. Traders change their positions based on how the report changes their outlook on:
- Interest rates,
- Inflation, and
- Overall economic growth.
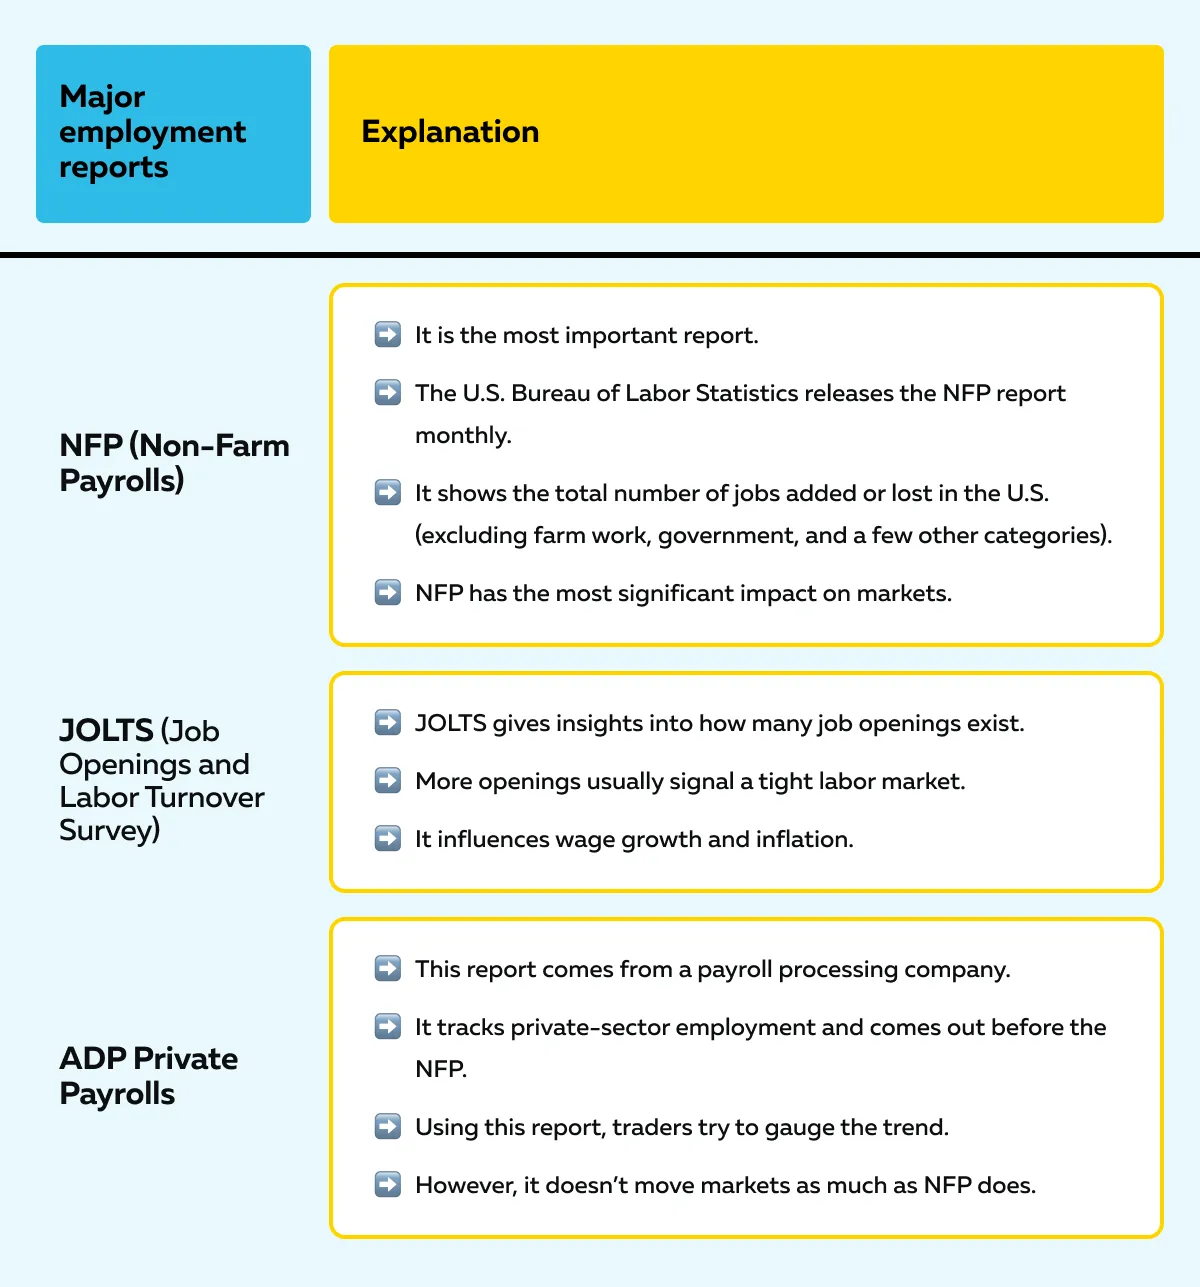
Which Employment Reports Matter Most?
Not all employment reports carry the same weight in the markets. Let’s have a look at some core sources of job data that traders monitor closely when making decisions:
Why Surprises Matter More Than Revisions?
Be aware that market reactions are strongest during the first release of key data, like the “Advanced GDP” report. This is because the element of surprise is highest. Later revisions usually confirm or fine-tune the first number, so they rarely cause major moves.
Next, please note that timing is everything when trading employment reports. Let’s see how, as a trader, you can prepare for a release:
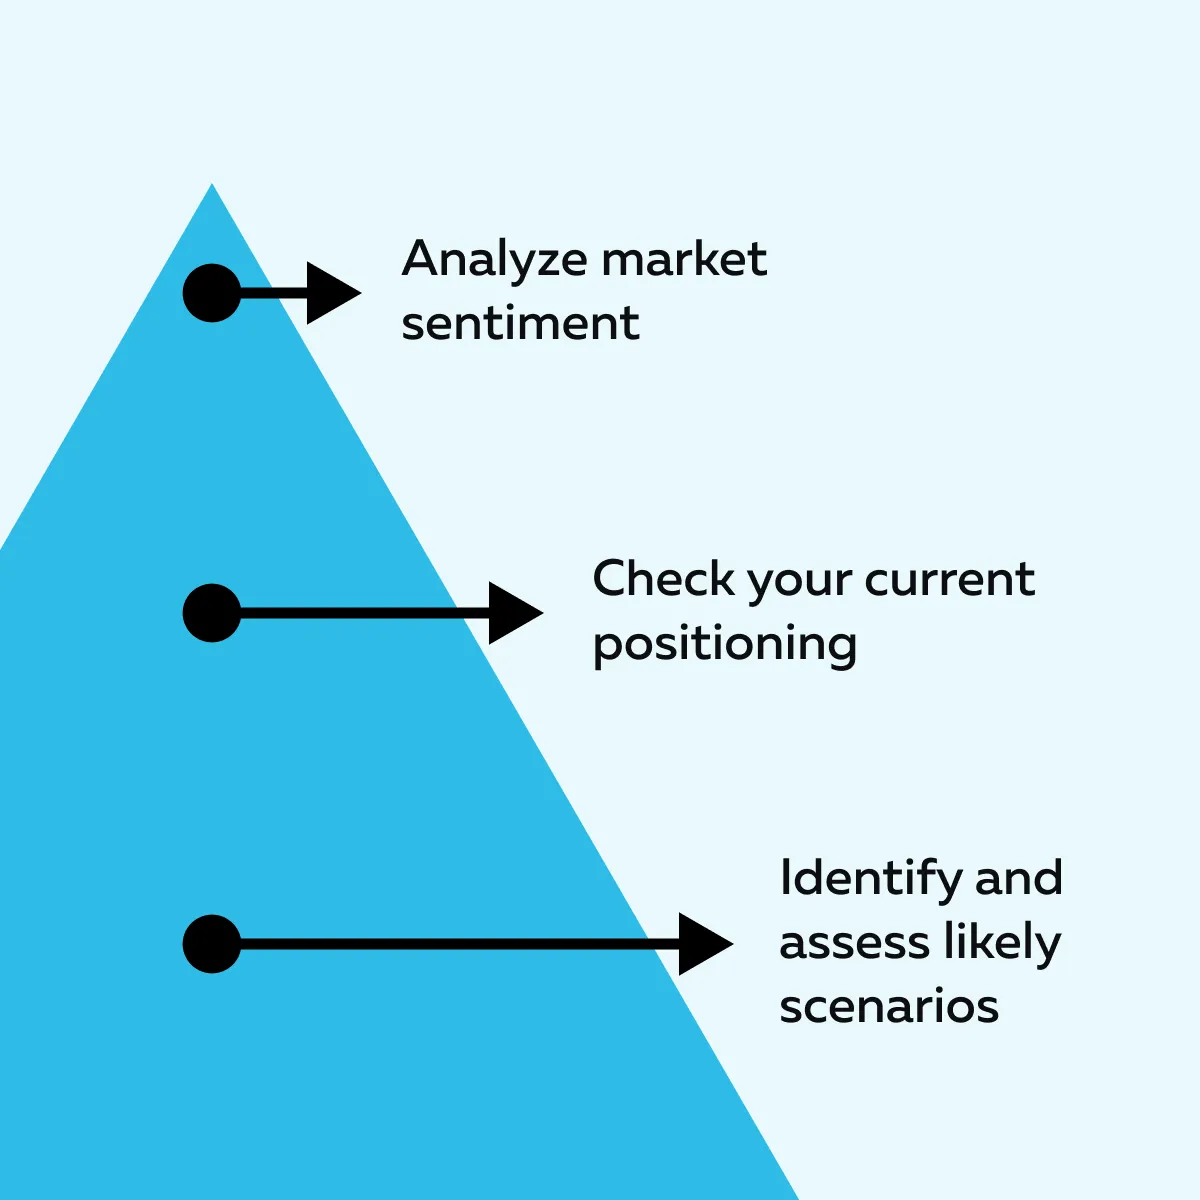
To perform these steps, you can use tools like Forex Factory. Using them, you get a snapshot of:
- What data is coming out?
- What’s expected?
- How has each report impacted the market in the past?
Trade smarter during key economic releases—join Bookmap’s upcoming webinars.
How to Trade Employment Reports Like a Pro?
To profitably trade employment reports (like Non-Farm Payrolls (NFP), JOLTS, and ADP), you must plan around:
- Expectations,
- Levels, and
- Real-time behavior in the market.
Below is a step-by-step guide through which you can approach these high-impact events with discipline:
Step 1: Review the Forecast vs. Previous Reading
Before you look at any charts, check what the market expects from the report. You can use economic calendars like:
- Forex Factory,
- Trading Economics, and
- Econoday.
While assessing, you should look at three major things:
- Previous figure (last month’s number),
- Current forecast (what analysts expect now), and
- Consensus surprise range (what would count as a big beat or miss).
This step matters because markets often move sharply when the actual number is different from expectations. For example:
- Say the forecast is for weak job growth.
- The report shows strong hiring.
- Now, this triggers a risk-off move (particularly in tech stocks or interest-rate sensitive assets).
- This happens because it could delay expected Fed rate cuts.
Step 2: Prepare Key Price Zones
Now that you understand the context, mark important price zones on your chart. Look at:
- The previous day’s high and low,
- Pre-report trading range,
- Round numbers (e.g., 4000 on the S&P 500), and
- VWAP (Volume Weighted Average Price).
These are reference points. But be flexible! If the report is a major surprise, the market may break through these levels quickly. When that happens, a new process called “price discovery” takes over, and the old levels may no longer be relevant.
Step 3: Stand Aside on First Spike — Observe Order Flow
The first few seconds or minutes after a major report are chaotic. Bots and algorithms react instantly, causing sharp price spikes in both directions.
Thus, instead of jumping in, observe the following:
- Where large buy or sell order flow is happening,
- Whether price pauses or stabilizes around key zones, and
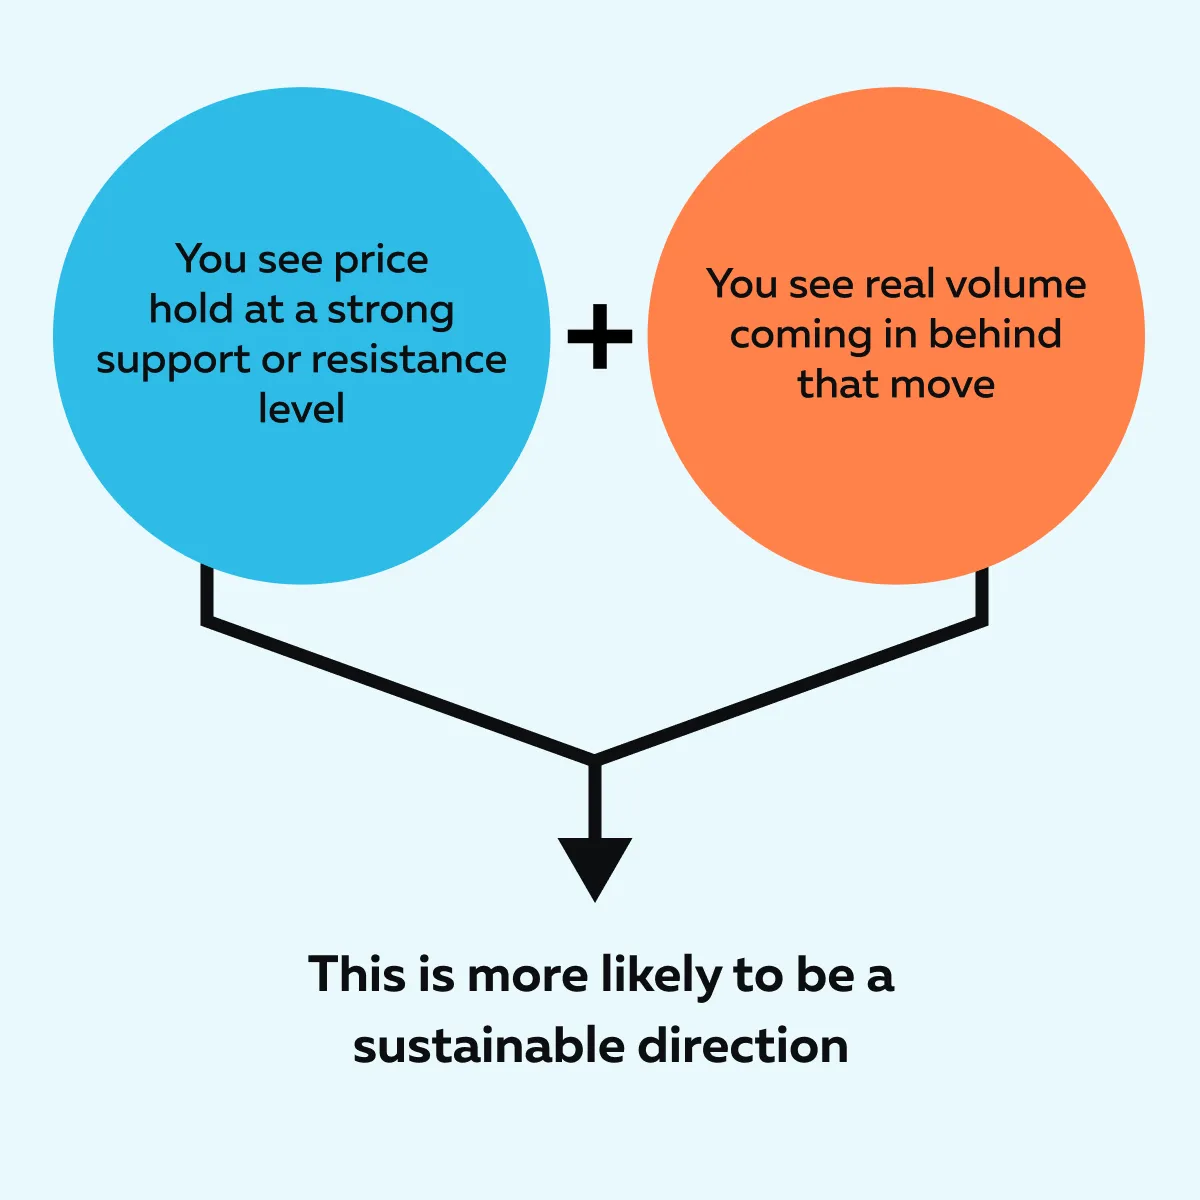
- How aggressively buyers or sellers behave.
Now, you must confirm a sustainable direction. Check out the graphic below to learn how you can do so:
Step 4: Watch for Real Volume and Liquidity Alignment
Don’t base your trades only on chart patterns! Instead, start using volume and liquidity clues to validate what you’re seeing. Some popular examples are:
- Bid stacking (lots of buyers lining up under the current price) suggests bullish intent.
and
- Offer stacking (sellers layering orders above price) signals potential bearish pressure.
For example:
-
- Say a weak NFP report got released.
- In response, the price dips hard.
- But if large buy orders appear under the lows and the volume shows buyers absorbing sellers, that could be a reversal setup.
This is where Bookmap, our modern order flow tool, gives professional traders a significant edge.
Step 5: Adjust Risk for Even Volatility
Events like employment reports often create wide price swings. Thus, you must also manage risk accordingly. Follow these proven tips:
- Use smaller position sizes.
- Widen your stop-loss levels to manage volatility better.
- Set alerts at major price zones so you don’t have to watch the screen constantly.
- Wait for clear confirmation before entering (don’t act on the first emotional wave).
Don’t get trapped during jobs report volatility—see liquidity shifts live with Bookmap.
How does Order Flow reveal the Real Market Reaction?
When you are trading employment reports, watching the price alone isn’t enough! Ideally, you should watch real insight that often comes from observing order flow. Through this observation, you can better understand how buy and sell orders enter and exit the market before and after the report.
Also, these shifts:
- Show you what institutional traders are doing
and
- It allows you to separate noise from real moves.
Let’s understand in detail how you can track order flow to understand the real market reaction:
What Happens to Liquidity Before the Report?
Be aware that 5-10 minutes before the release, liquidity usually vanishes. It is commonly observed that before major job data like NFP, JOLTS, or ADP is released, the market becomes quieter. Let’s see why this happens:
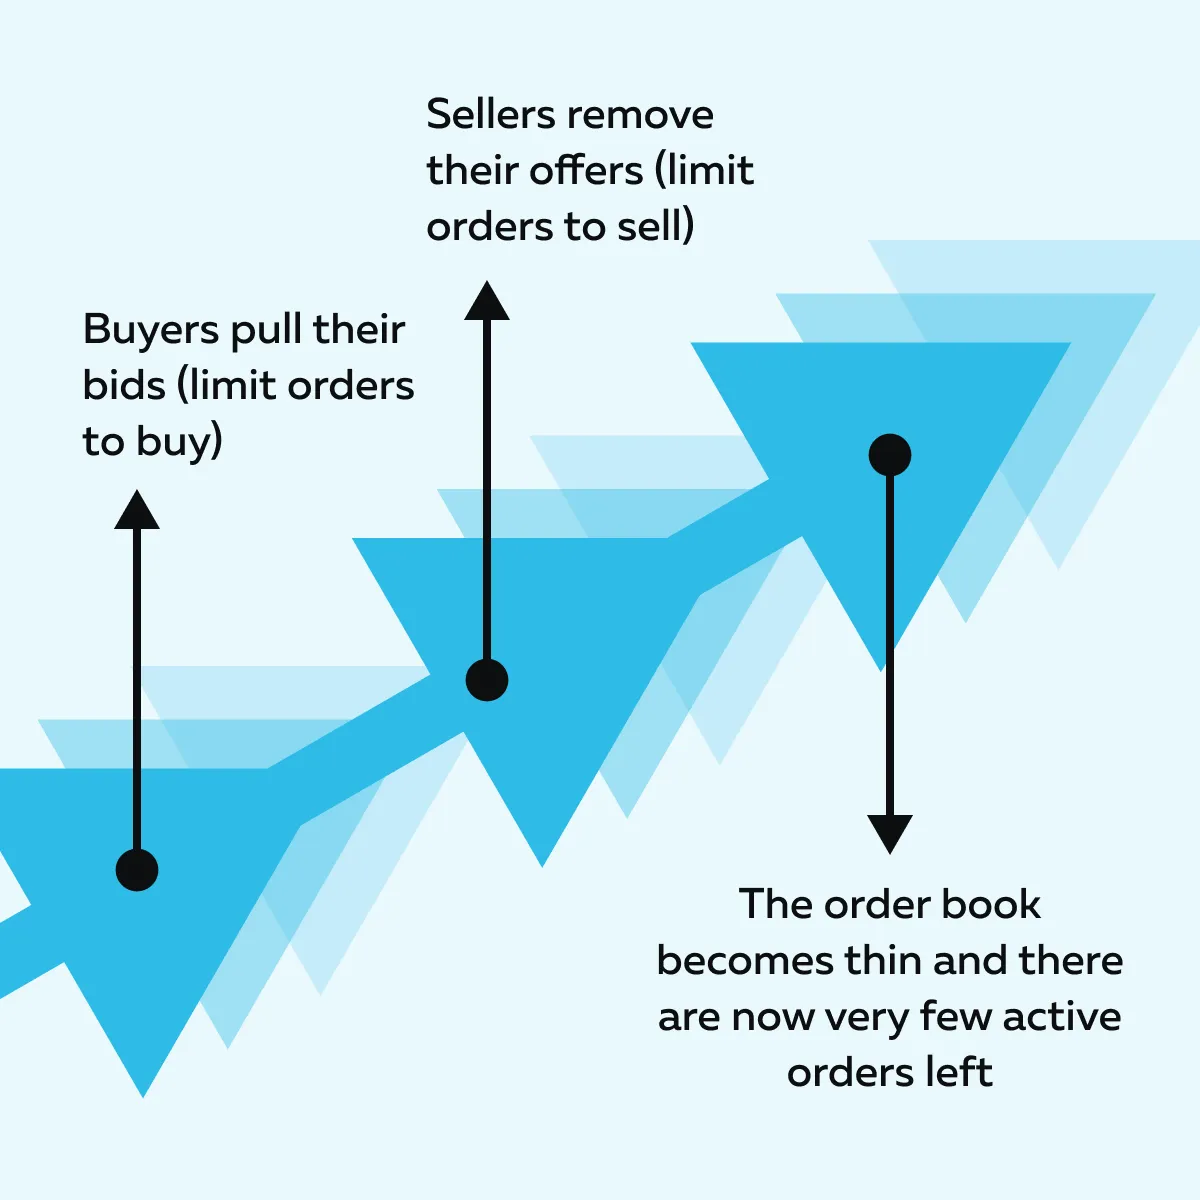
This particularly matters because with fewer orders in the market, even small trades can cause large price swings. As a result, the market becomes fragile. By performing this protective move, you, as a trader, will not get caught in unexpected spikes caused by headline surprises.
What Happens Immediately After the Release?
As soon as the job data hits the wire, prices often jump sharply up or down within the first second or two. This move is usually a raw reaction to the headline number (like total payrolls or unemployment rate).
Such price fluctuations occur because the market often doesn’t have time to process important details like:
- Wage growth,
- Participation rate, and
- Revisions to prior months.
As a result, the initial move does not reflect the complete economic picture. It’s volatile and mostly happens due to algorithms or preset orders reacting to surface-level data.
As a trader, you should wait and watch. During these times, you should look for moments when real buyers and sellers step in (after the initial spike settles). That’s when the proper direction becomes clear.
Why You Should Not React to the First Price Move?
After major job data releases (like NFP or ADP), the market moves violently within the first few seconds. But as a professional trader, you must not trade just based on that first move!
Let’s take a look at what you can do instead:
A) Don’t Chase the First Spike
Right after the release:
- Prices may jump or drop sharply in response to the headline number.
- This move is often fast and emotional.
- It is mainly due to algorithms and not because of thoughtful analysis.
Please note that these spikes can reverse quickly (particularly once traders start analyzing other parts of the report, like wage growth or revisions). If you jump in too early, you risk being caught in a false move. That’s why trading employment reports is more about patience than speed.
B) Wait for Liquidity to Rebuild
After the first wave of activity, the market begins to rebuild liquidity. Most traders start placing new buy and sell orders. As a result, the order book fills out again. By analyzing the order book at this time, you can spot where the real interest lies. In this rebuilding phase, you can understand who is actually in control.
C) Use Order Flow Clues to Understand Market Direction
Now, once the liquidity returns, you should watch the following:
| Liquidity Stacking Below Price = Bullish Demand | Liquidity Stacking Above Price = Bearish Pressure |
|
and
|
How Order Flow Tools Like Bookmap Give Traders an Edge?
After a major employment report is released, price charts alone don’t always tell the whole story. You should ideally use our avant-garde real-time market analysis tool, Bookmap. Using it, you can see beneath the surface and observe how real orders are behaving.
This information lets you identify who’s in control – buyers or sellers. On Bookmap, you can make this analysis much faster than with traditional charts. Let’s understand in detail:
What Does Bookmap Show That Charts Don’t?
Below are two unique features of our Bookmap:
- Analyze Volume Dots to Understand Real-Time Aggression
Bookmap displays volume dots where actual trades occur. The color and size of the dots indicate whether those trades were aggressive buys or sells. Check out the graphic below:
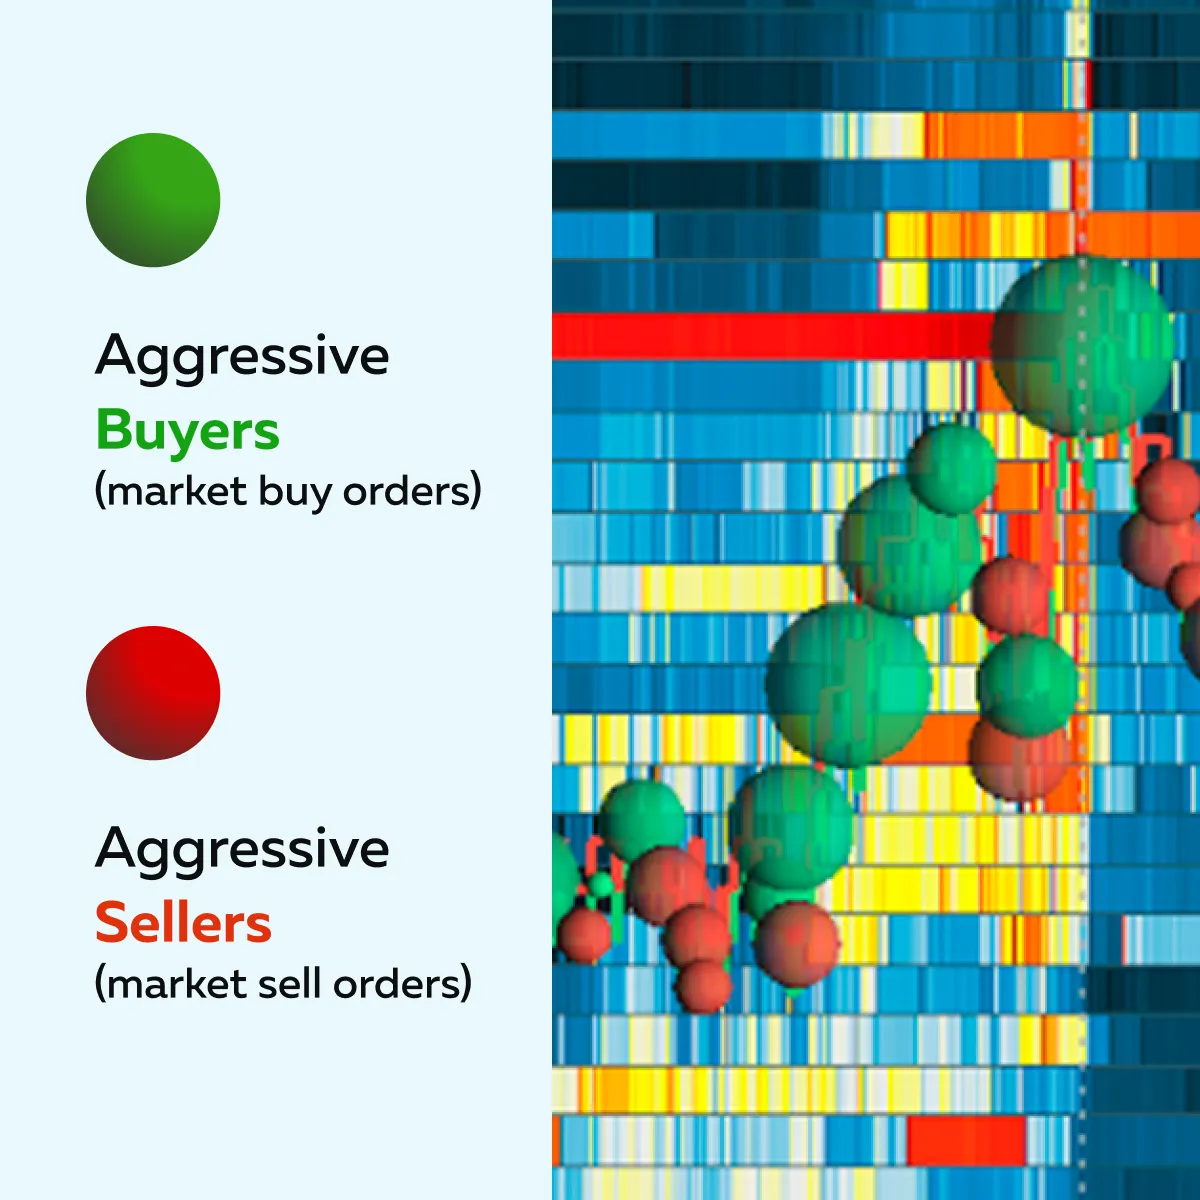
A cluster of large dots near key levels shows where one side is stepping in strongly. Through this analysis, you can see exactly where traders are committing capital (and not just where price is going).
- Check Heatmap to Spot Liquidity Walls in Real Time
The heatmap visualizes where limit orders (buy and sell) are sitting. Usually, brighter areas = more liquidity. As the market stabilizes after the initial chaos, new liquidity levels form. Our Bookmap’s heatmap shows:
- Where buyers are willing to step in
and
- Where sellers are ready to push back.
This lets you anticipate likely reversals or continuations based on how liquidity behaves (and not just price action alone).
For more clarity, let’s study an example:
- Say the Non-Farm Payrolls (NFP) report comes in weaker than expected (a negative surprise).
- In the initial reaction, the market sells off hard as most traders price in slower job growth.
- Now, you, as a trader, use Bookmap and notice:
- Large bids (limit buy orders) appear just below the low of the spike
and
- Volume dots show buyers absorbing aggressive selling.
- This signals that strong hands are buying into the dip.
- You stayed patient and did not panic.
- After some time, the market stabilizes and begins to rally.
- This catches traders off guard who sold into the panic.
This is a classic case where order flow, not just price, reveals the true intent of market participants.
Conclusion
To profitably trade major employment reports like NFP or JOLTS, you must closely watch how the market reacts once the data is released. As a tip, don’t chase the first price move! Instead, wait for signs that show real buyers or sellers are stepping in. You should make this analysis based on how liquidity and volume behave after the initial spike.
To do this precisely, start using our modern real-time market analysis tool, Bookmap. Using it, you can see where aggressive trades are happening and where liquidity is building (or fading). This information gives you a clearer view of whether a move is real or likely to reverse. Also, focus on order flow and job data context. This lets you avoid emotional trades and act with more confidence.
Want to build skills before the next big release? Join our upcoming live webinars. Understand order flow around employment data with real-time examples in the Learning Center.
FAQ
1. What markets react most to employment reports?
The following markets often move sharply after job reports:
- U.S. dollar (especially forex pairs such as EUR/USD),
- U.S. stock indices (like the S&P 500 and Nasdaq), and
- U.S. Treasury bonds (ZB and ZN futures).
These reports give clues about the economy’s strength. They affect interest rates and investor decisions. That’s why traders pay close attention to these markets.
2. How soon should I trade after an employment report release?
Ideally, you should wait at least 2–5 minutes after the report. The first move is usually fast and emotional. Algorithms often drive it. After the initial few minutes, you can see more clearly where real buyers and sellers are stepping in. Please note that waiting gives you a better chance to understand the market’s true direction.
3. Why is liquidity so important during job reports?
Liquidity shows where real buy-and-sell interest exists. During job report release events, liquidity thins, leading to wild price fluctuations.
However, when liquidity returns, it reveals whether price moves are:
- Strong and supported
or
- Just temporary reactions that may reverse.
By watching liquidity, you can avoid false signals and trade with more confidence.
4. How can Bookmap help me trade employment reports?
Our tool Bookmap shows you more than just price. Using it, you can visualize:
- Where large orders are sitting,
- Where trades are happening, and
- How volume behaves.
This information lets you see if buyers or sellers are serious or just reacting. When job reports are released, you can avoid fake breakouts or traps.
Sign Up Now