See market activity more clearly in real time.
Compare plans to access deeper market visibility for market activity.
Crypto
July 21, 2024
SHARE
Identifying True Liquidity With Bookmap
Real Support & Resistance
We’ve all heard about support and resistance from traditional technical analysis. With a simple candlestick or bar chart, areas of extreme price fluctuations can be marked off and used as reference points for trade entries and exits. But there is another layer to this form of analysis: supply and demand. This is also a type of support and resistance, only with extra embedded information. For instance, a cluster of offers in the order book is supply and will act as resistance, potentially keeping prices down. A dwindling quantity of market buy orders being transacted can also keep prices down. So what insights should a trader look for on the heatmap?
In general, a large amount limit orders on the bid can act as a form of support, and a large amount limit orders on the offer as a form of resistance. Since every transaction requires a buyer and a seller, each side has to include aggressive and passive orders; the aggressive market orders being able to remove liquidity (and hence move price), and the passive limit orders being able to absorb the aggressive market orders (and potentially stop prices from changing). The more passive limit orders (i.e. liquidity) at a certain price level in combination with a lack of aggressive traders, the less likely the market will be able to push through this price level. If all the liquidity at a certain price level is consumed, the price changes to the next best price (highest Bid or lowest Offer) that has liquidity. This is how price moves.
Of course, if there was absolutely no liquidity in the form of bids or offers, there would be no market. For a market to be made, limit orders (or liquidity) need to exist in the order book. If liquidity at a certain level pulls and moves to a different level, this can change the best available price. The only other way for a price to change is when a market order transacts and fully consumes all the bids or offers at that particular level—also known as sweeping the book. For this reason, the quantity of aggressive orders relative to available liquidity is one of the most important dynamics to understand for anticipating changes in price.
Liquidity Dynamics
Even with a deep knowledge of market microstructure, good traders still need to keep context in mind. As prices approach layers of liquidity (Bids or Offers in the order book), the behavior of these limit orders can give a lot of insight into the intentions of the players behind them. When prices are rising with more aggressive buyers and the limit sell orders above start to pull, for instance, this is a sign that these traders don’t really want to sell at those prices. It doesn’t really matter what the reason is, the main thing is that we see this behavior on the heatmap and can use these contextual shifts to make better trading decisions.
Swing highs and lows are often vital turning points for order flow. When prices bounce off a particular level, this prints a swing which can be identified even on a simple price chart. But with the added order flow visualization element of the heatmap, we can also see if liquidity was adding or pulling at the swing extreme. When there is more liquidity at a price level than aggressive market orders, it means that there is a greater chance that this level can be absorbed, which could lead to prices bouncing off the level.
For example, when extremely large aggressive selling is struggling to penetrate a high level of liquidity on the Bid, this will be due to absorption of the market sells on the Bids (or Buy Icebergs). If this liquidity is also at a swing extreme, it may be prime time for aggressive buyers to come in and push the market back up, especially if prices are trading at the extreme end of the SVP (Session range volume profile).
Bookmap even has an on-chart absorption indicator that shows exactly where large resting sell or buy limits (sometimes including Icebergs) has absorbed a large volume of aggressors. You can read more about this indicator here.
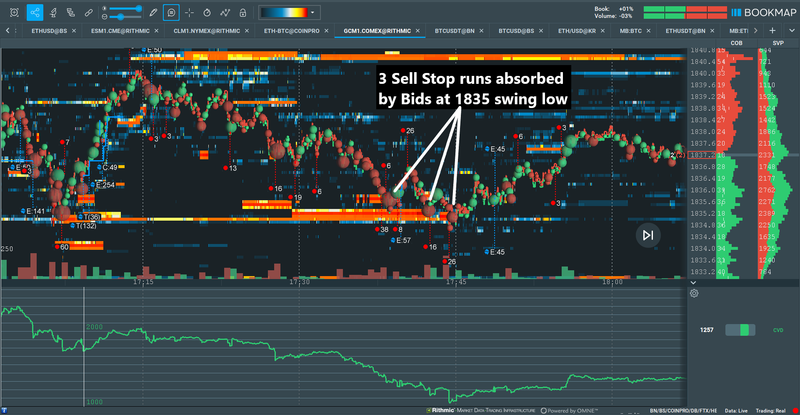
Fig 1 – Bids are added at a previous swing low on Gold, absorbing 3 Sell Stop run attempts to breaker lower.
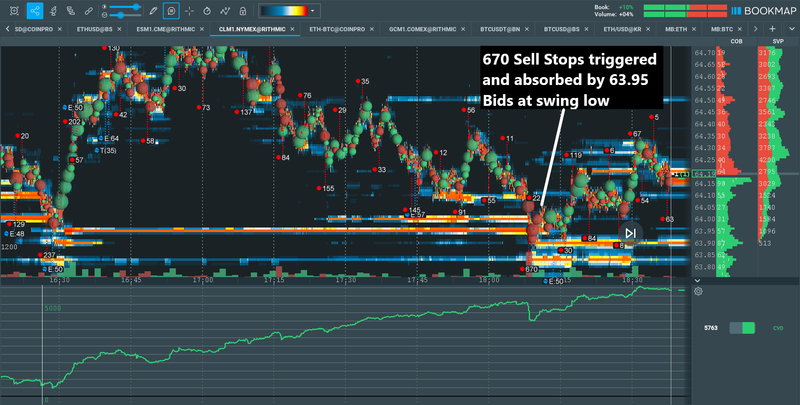
Fig 2 – Another example, this time on Crude Oil. Bids just below the previous swing low absorb a Sell Stop run.
Aggressive Orders Exhaustion
The function of price discovery in financial markets is to facilitate transactions. This means that markets are always seeking liquidity. If prices are trading in a zone where there is a lack of interest, we will see this on the heatmap with little to no volume dots. The market is basically showing a lack of transactions.
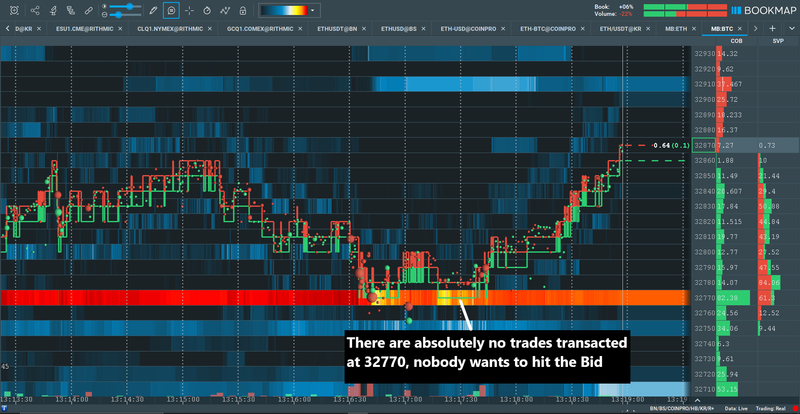
Fig 3 – An example of selling exhaustion. No sellers want to hit the Bid at 32770.
Sometimes exhaustion can occur at prices where large liquidity has recently been fully transacted. When the market moves significantly through a large layer of liquidity and then prices come back to retest the level, it often holds and prices continue the previous trend. This could be because traders who are caught on the wrong side of the move are ecstatic to get out at breakeven, and their flipping of positions also flips the market.
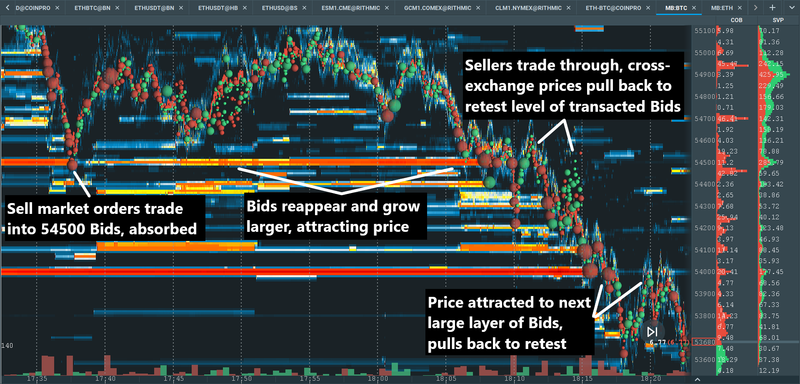
Fig 4 – Multibook of BTCUSD. Each level of large Bids attract prices towards them, and there are pullbacks to the same level once broken.
The Importance of a Global Market View
The more related instruments you view, the more contextual insights you can gain, and the better trading decisions you can make. This is true across all asset classes. Consider stocks, some multinational corporations are “dual-listed”, meaning they trade on multiple exchanges, often in different parts of the world. If you view the liquidity and volume traded across multiple exchanges, you will have a higher chance of avoiding false signals.
One of the biggest markets where such types of liquidity that doesn’t intend to trade may be more of a problem is in the less regulated cryptocurrency market. There are many allegations of newer exchanges using wash trading, which is essentially the exchange trading with itself to pump their volumes. Due to the lack of regulation in this space, this kind of unfair trading may be more common than in traditional markets. But with the right visualization tools, the false signals given off by this kind of volume can be offset. Using the new consolidated order book addon Multibook allows you to see all the liquidity across multiple exchanges.
To reduce the risk of being misguided by false liquidity, you can choose to only view order flow of the most trustworthy exchanges that trade in regulated zones. Secondly, liquidity can’t be fake: they may not have intent to get filled, but they must still have the capital to be able to enter the order. It doesn’t matter where the money behind it comes from—if it’s in the book, it can be transacted. Of course, if you are viewing aggregated data, the ‘fake’ or irrelevant order flow would be unnoticeable on the Multibook chart.
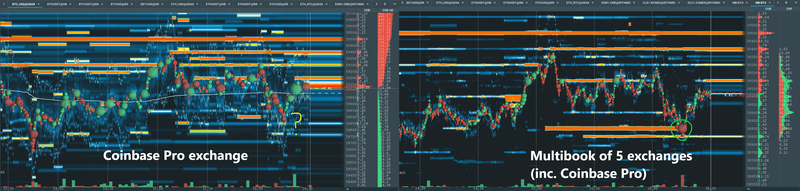
Fig 5 – An example of how viewing more liquidity gives you a contextual edge. On the left we see a chart of BTCUSD on the Coinbase Pro exchange where prices seemingly bounce for no reason, and on the right we see a synthetic Multibook instrument of BTCUSD across 5 exchanges (including Coinbase Pro) across the same time period that clearly shows selling absorption on a large layer of Bids.
The addon can even be used with futures instruments, where combining different contract expiries will give you an even deeper view of liquidity. If you want to read more about Multibook, please check the page on our Knowledge Base.
Bottom line: understanding liquidity is what gives you an edge, and Bookmap with all its tools is what helps you get there.
Sign Up Now