See probability based more clearly in real time.
Compare plans to access deeper market visibility for probability based.
Education
May 12, 2025
SHARE
Making Better Trade Decisions: How to Think in Probabilities, Not Guarantees

In trading, relying on gut feelings is like rolling the dice! Sometimes, you may rack up the occasional win, but most of the time, the house (market) wins. But do you know what successful traders do? They don’t guess! Instead, they think in probabilities.
Do you also want to develop a trading mindset that focuses on consistent and long-term success? This article will teach you everything you require to make probability-based trading decisions.
You’ll learn why thinking in probabilities beats chasing certainty and how to assess market context, liquidity, and risk-to-reward for better outcomes. Also, we will explain how our real-time market analysis tool, Bookmap, can help you visualize market intent and identify high-probability setups. By mastering these concepts, you’ll stop reacting emotionally. Read this article till the end to trade smartly, even in unpredictable environments!
Why Traders Should Think in Terms of Probabilities?
Markets don’t follow a fixed pattern. Even if a trading setup looks perfect, the outcome is never guaranteed. Similarly, a poor-looking setup can sometimes give surprising results because markets are influenced by countless factors, such as:
- News,
- Emotions,
- Liquidity,
and
- Global events.
Thus, as a trader, you must realize that no single strategy works 100% of the time. So, what’s the ideal approach? It is making probability-based trading decisions. It lets you think about outcomes as possibilities, not certainties.
For Example:
- Let’s assume you enter a trade with a 70% win probability.
- Now, that means there’s still a 30% chance of losing.
- Even if that trade ended in a loss, the decision was still valid.
- That’s because the odds were in your favor.
Consistency Beats One-Time Wins
Success in trading isn’t about making one lucky call. Many beginner traders get excited after a few wins and assume they have “figured it out.” However, sustainable profits come from consistent decision-making rather than occasional lucky trades. Check the graphic below to learn how you can develop a consistent trading mindset:
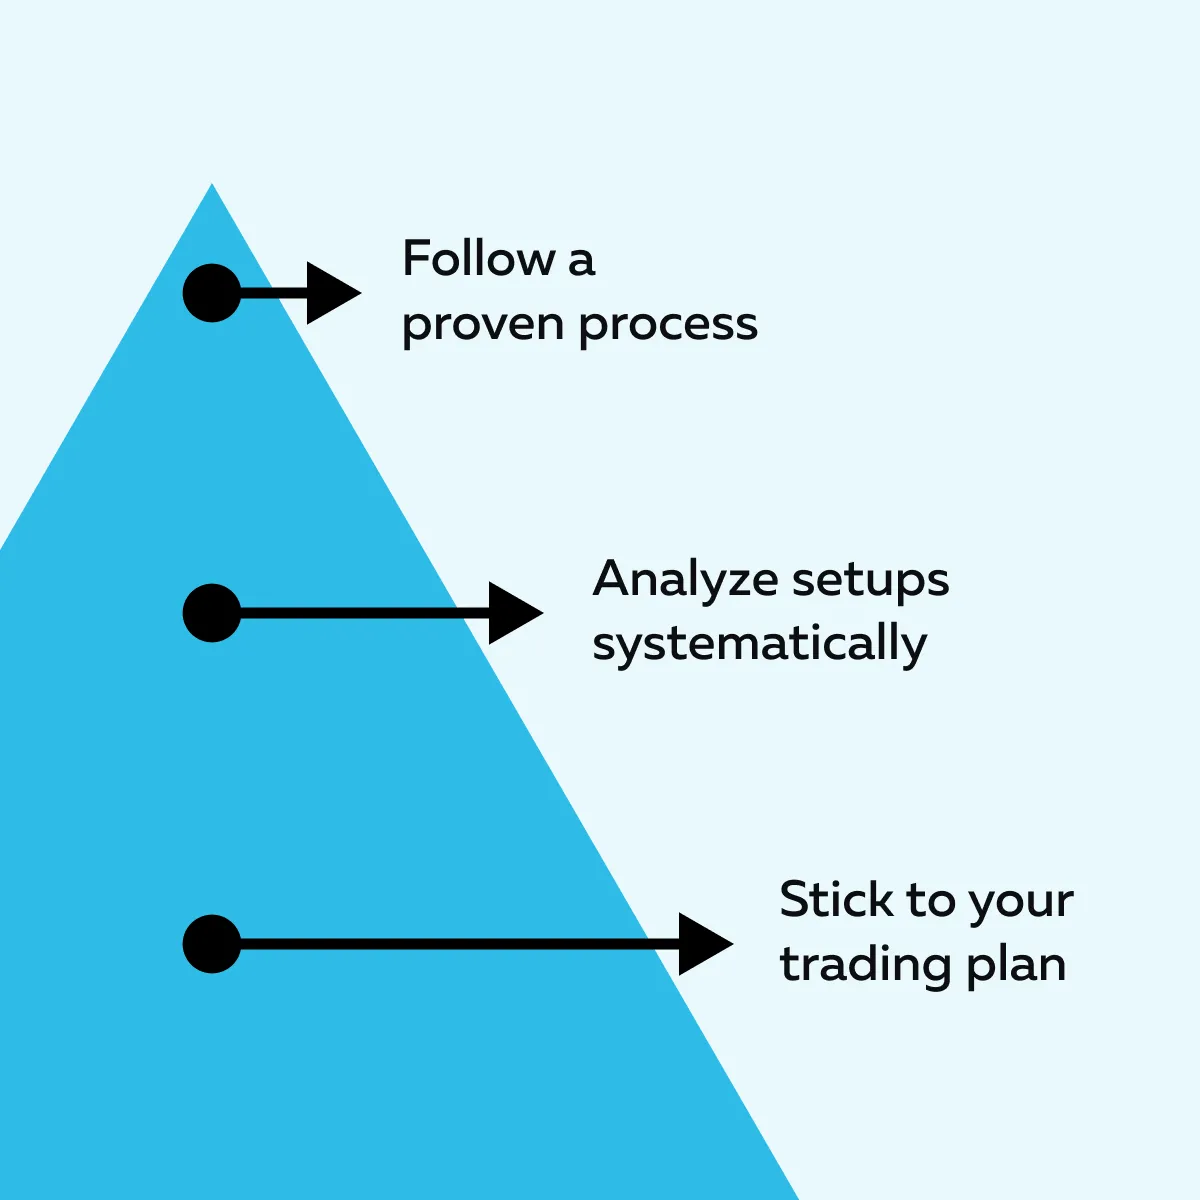
Why Does Consistency Matter?
- It reduces emotional trading.
- You don’t make impulsive decisions.
- It helps refine your strategy based on actual data (not random outcomes).
A structured approach compounds your gains as time passes, whereas impulsive trading often erodes profits.
Always Understand Risk and Reward
Every trade involves both risk and reward. To think like a trader, you need to assess whether the reward justifies the risk taken. The goal is not to avoid losing but to ensure that, over many trades, the rewards outweigh the losses.
For Example:
- Let’s assume you risk $1,000 on a trade with the possibility of gaining $3,000.
- Now, the risk-reward ratio is 1:3.
- Even if only half of such trades are successful, you would still be profitable in the long run.
Thus, you must take trades with favorable payoff scenarios rather than aiming for perfection.
Why Does a Probability-Based Approach Work?
A probabilistic trading mindset helps you avoid emotional reactions to individual wins or losses. Instead of focusing on “being right,” you start following a probability-based system and looking at the bigger picture!
Such a shift from a “win/lose” mindset to a probability-based trading lets:
- You stick to strategies that have positive expected value over time
- You avoid revenge trading after losses (because you understand losses are part of the game)
- You stay objective and disciplined
What Shapes the Odds of a Good Trade?
Please realize that the outcome of a trade isn’t just about picking the right stock or asset! Several factors influence whether a trade has high or low odds of success. By learning them, you can make smarter probability-based trading decisions. Let’s check them out:
Context and Market Conditions
Context matters! You can’t use the same strategy in all conditions and expect consistent results. Factors that influence the probability of success are:
- Market structure,
- Volatility,
and
- Recent news events.
Let’s understand them in detail:
1. Market Structure Affects Trade Setups
Market structure refers to how the price is moving, whether it’s:
- Trending,
- Ranging, or
- Consolidating.
Check the graphic below to see how different market trends give different indications:

For Example:
- Let’s assume there is a breakout trade in a trending market.
- The price momentum is strong.
- There is a higher chance of success.
- Now, assume the same breakout setup in a sideways market.
- This setup often fails because the price tends to revert to the range.
Thus, you need to assess the market structure before taking a position. Always remember that you’re not just looking for setups! Instead, You’re looking for setups in the right environment.
2. Volatility Can Change the Odds
Volatility measures how much the price moves in a given period:
| High Volatility | Low Volatility |
|
|
For Example:
- During earnings season, stocks often experience increased volatility.
- This situation creates both high-risk and high-reward opportunities.
Start using smarter decision frameworks—try Bookmap’s advanced analytics for futures, stocks, and crypto.
3. News and Market Sentiment
Market sentiment significantly impacts the odds of success. Let’s see what influences it:

Thus, as a trader, you must factor in these events before executing trades. For example:
- Let’s assume there is a release of a strong jobs report.
- Now, it can push the market higher.
- This market behavior boosts the odds of bullish trades.
- Conversely, unexpected news (like central bank rate hikes) can create volatility.
- It can invalidate even the best trade setups.
Master Tip
Always check for upcoming news events that might affect your trade. Don’t ignore market sentiment, as it always leads to unnecessary surprises.
Liquidity and Volume Clues
Liquidity and volume provide insights into market activity. Analyzing them lets you learn where big players (institutions, hedge funds, and market makers) are committing capital.
To do so, you can start using our advanced market analysis tool, Bookmap. Using it, you can visualize this data and comprehend trade setups and reversals better.
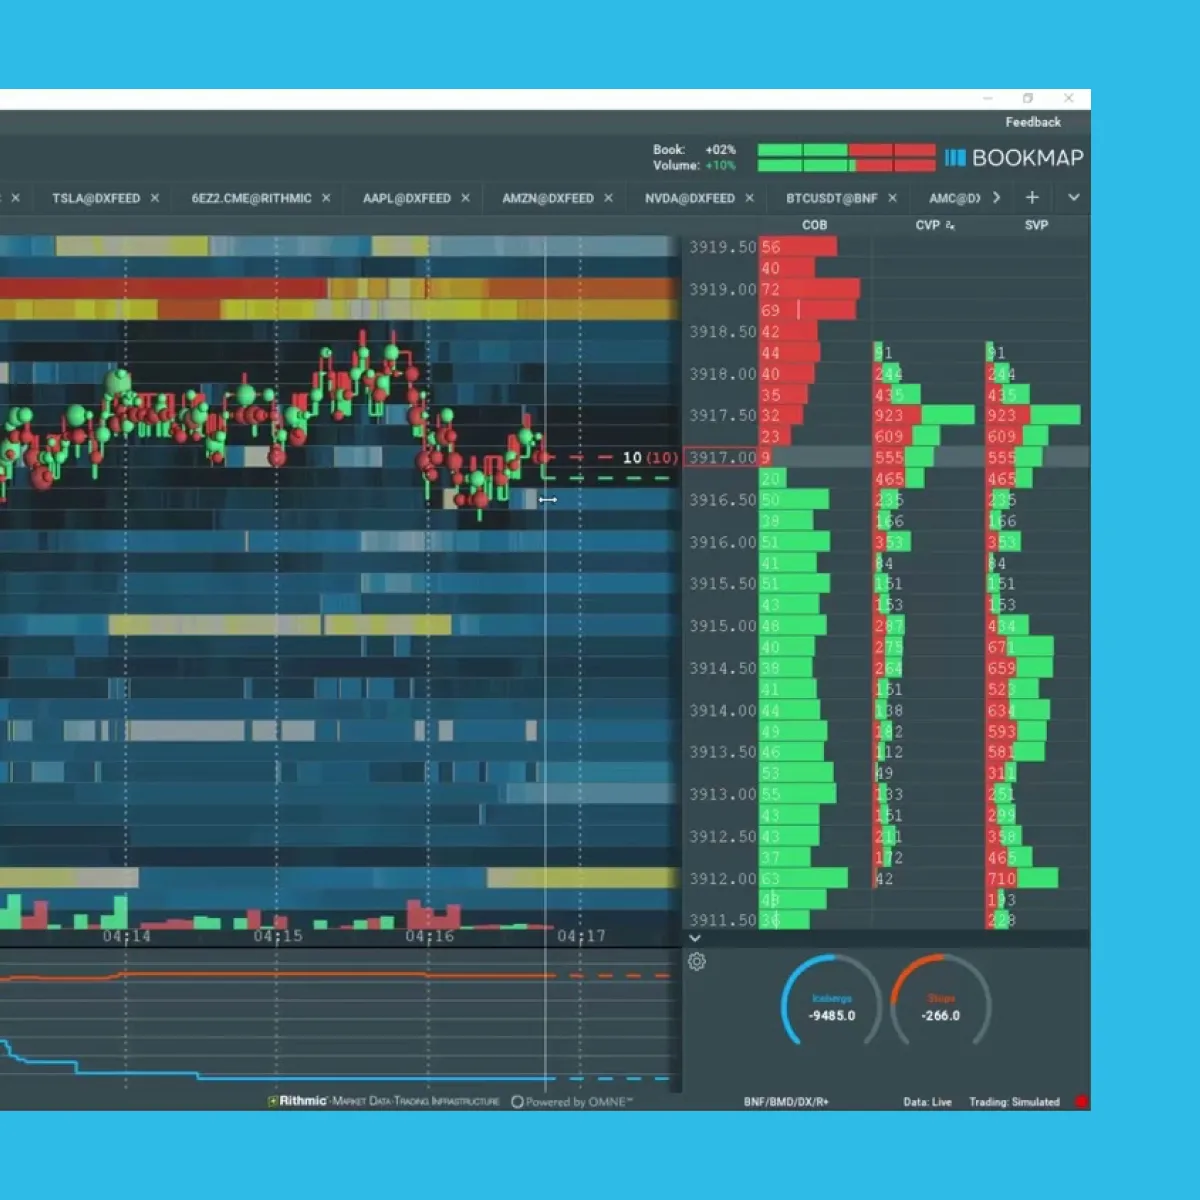
How Can You Use Our Platform Bookmap to Identify Key Levels?
Our platform, Bookmap, is a real-time market analysis tool. It displays market liquidity and order flow in real time. Also, it shows where buy and sell orders are resting in the order book. These visual cues allow you to make probability-based trading decisions based on visible market dynamics.
Let’s check out the three ways you can use our tool, Bookmap:
| Aspects | Heatmap Shows Resting Liquidity | Volume Dots Reveal Trade Intensity | Cumulative Volume Delta (CVD) Tracks Buying vs. Selling Pressure |
| Meaning |
|
|
|
| Why is it important? |
|
|
|
| Example |
|
|
|
Risk-to-Reward Assessment
A successful trader doesn’t just think about winning or losing! They think in terms of risk-to-reward ratios. This approach allows you to determine whether a trade is worth taking (even if the probability of success isn’t extremely high).
What are Risk-to-Reward Ratios?

The risk-to-reward ratio (R: R) compares the potential profit of a trade to the possible loss. A favorable ratio shows that even if a trader loses more often than they win, the wins can still outweigh the losses over time.
Why Ratios Matter More Than Win Rate?
A trade with a high win rate doesn’t guarantee long-term success, especially if the reward is too small compared to the risk. Conversely, a trade with a lower win rate can be profitable if the reward is much higher than the risk.
Let’s understand this concept better through an example:
| Case I | Case II |
|
|
How to Evaluate Trades Using Risk Multiples?
Traders often use “R-multiples” to express risk-to-reward. For example, if you risk $1,000 to make $2,000 potentially, the reward is 2R. This trading mindset lets you evaluate whether the trade offers sufficient upside compared to the risk.
Why This Matters?
- A 2:1 ratio (2R) means you only need to be right 33% of the time to break even.
- A 3:1 ratio (3R) allows profitability even with a lower win rate.
Common Mistakes That Hurt Probability-Based Thinking

When traders shift to probability-based trading decisions, they often fall into common traps. These traps undermine their long-term success. These mistakes primarily arise from emotional reactions or overconfidence. Let’s check them out:
1. Overconfidence in Single Trades
Many traders become overly confident in a particular trade setup. They start believing that it’s a guaranteed winner. Such a mindset often leads to taking on excessive risk or holding onto a losing position for too long.
Why It’s a Problem?
- No trade is 100% certain, no matter how perfect the setup looks.
- Betting too much on one trade exposes your account to unnecessary risk.
Let’s Understand Better Through an Example:
- Let’s assume a trader sees a breakout setup that worked well in the past.
- Now, they may double their position size, assuming it will succeed again.
- However, if the market conditions fluctuate, the setup may fail.
- This folly can result in a larger-than-expected loss.
How to Avoid This Mistake?
- Treat every trade as one of many outcomes in a more extensive series.
- Focus on maintaining consistent risk across all trades.
2. Ignoring Unfavorable Odds
Just because a trade setup looks familiar doesn’t mean it’s a high-probability opportunity in the current market. That’s because market conditions, volatility, and sentiment change constantly. These factors affect the odds of success.
Why It’s Dangerous?
- Relying on past setups without considering the current context leads to false confidence.
- Taking trades with unfavorable odds erodes long-term profitability.
Let’s Understand Better Through an Example:
- A trader notices a bullish pattern.
- In the past, it worked well during a trending market.
- They try the same strategy during a choppy or range-bound market.
- The odds are lower in such an environment.
- There is an increased likelihood of failure.
How to Avoid This Mistake?
- Constantly assess the market context before entering a trade.
- Use our tool, Bookmap, to visualize liquidity zones.
- Also, on Bookmap, identify when setups have higher probabilities of success.
3. Avoiding Small Losses
Many traders struggle to accept small losses! They keep holding onto losing trades for too long. They do so, hoping for a reversal. Sometimes, they even add to losing positions (this turns a manageable loss into a disaster).
Why It’s Harmful?
- Avoiding small losses disrupts the probability-based trading mindset.
- Holding onto bad trades affects emotional discipline and increases overall risk.
Let’s Understand Better Through an Example:
- A trader refuses to exit a losing trade with a 1R loss ($1,000).
- They believe the price will bounce back.
- The loss eventually ballooned to 5R ($5,000).
- It wipes out gains from multiple successful trades.
How to Avoid This Mistake?
- Define your stop-loss before entering the trade and stick to it.
- Accept that small losses are part of a probability-based trading system.
Practical Ways to Build Probability-Driven Trading Habits
To succeed in trading, you must change your habits and align them with probability-based thinking. Below are some habits you can develop to maintain discipline and refine your strategy:
1. Use Trade Journaling to Analyze Setups

Keep a detailed trading journal. It lets you track more than just wins and losses. That’s because it captures valuable information such as:
- Trade setup quality,
- Market context,
- Volatility, and
- Your reasoning behind entering and exiting trades.
You can quickly identify patterns that lead to success or failure through journaling. Also, you can review past trades to fine-tune your strategy. To improve consistency, start using Bookmap’s Trading Journal to log trades and analyze performance.
2. Focus on Consistency in Execution
Execution consistency means sticking to your trading plan (regardless of emotions or external noise). Many traders:
- Abandon their strategy after a losing streak,
or
- Chase trades due to FOMO (Fear of Missing Out).
Such behavior disrupts probability-based decision-making. Check the graphic below to learn more:

3. Use Real-Time Market Data Tools Like Bookmap
Real-time data improves decision-making. It provides a clearer view of liquidity zones and order flow. Using our tool, Bookmap, you can easily visualize critical market data. It lets you identify where significant buying or selling pressure is likely.
Why Real-Time Data Matters?
- It highlights liquidity zones where big players are committing capital.
- It helps you anticipate high-probability setups and likely reversals.
For Example:
- Let’s assume our tool, Bookmap, shows a large liquidity cluster at a key support level.
- Now, it increases the probability that the price might bounce.
- By recognizing these zones, you strategically timed your entries and exits.
React to high-probability setups faster with Bookmap’s real-time order flow tools.
Visualizing Market Intent: Bookmap’s Role in Thinking Probabilistically
Successful traders don’t rely on predictions! Instead, they focus on:
- Understanding market behavior,
and
- Identifying high-probability setups.
Our tool, Bookmap, plays a critical role in this process. It provides a visual representation of market intent. These visual aids allow traders to make probability-based trading decisions. Let’s see how:
How Does Bookmap Help Traders Think Probabilistically?
Bookmap is a real-time market visualization tool. It displays order book data, showing where buyers and sellers are placing their orders.
Unlike traditional price charts that only show past price action, Bookmap offers a dynamic view of:
- Liquidity,
- Order flow,
and
- Volume patterns.
These are key insights and let you think like a trader focusing on probabilities. Let’s understand them in detail:
1. Spotting Liquidity Absorption and Large Order Behavior
Liquidity absorption occurs when large buy or sell orders are repeatedly filled without significantly changing prices. This behavior shows that big players (institutions or market makers) are:
- Controlling the order flow,
and
- Absorbing demand or supply at key levels.
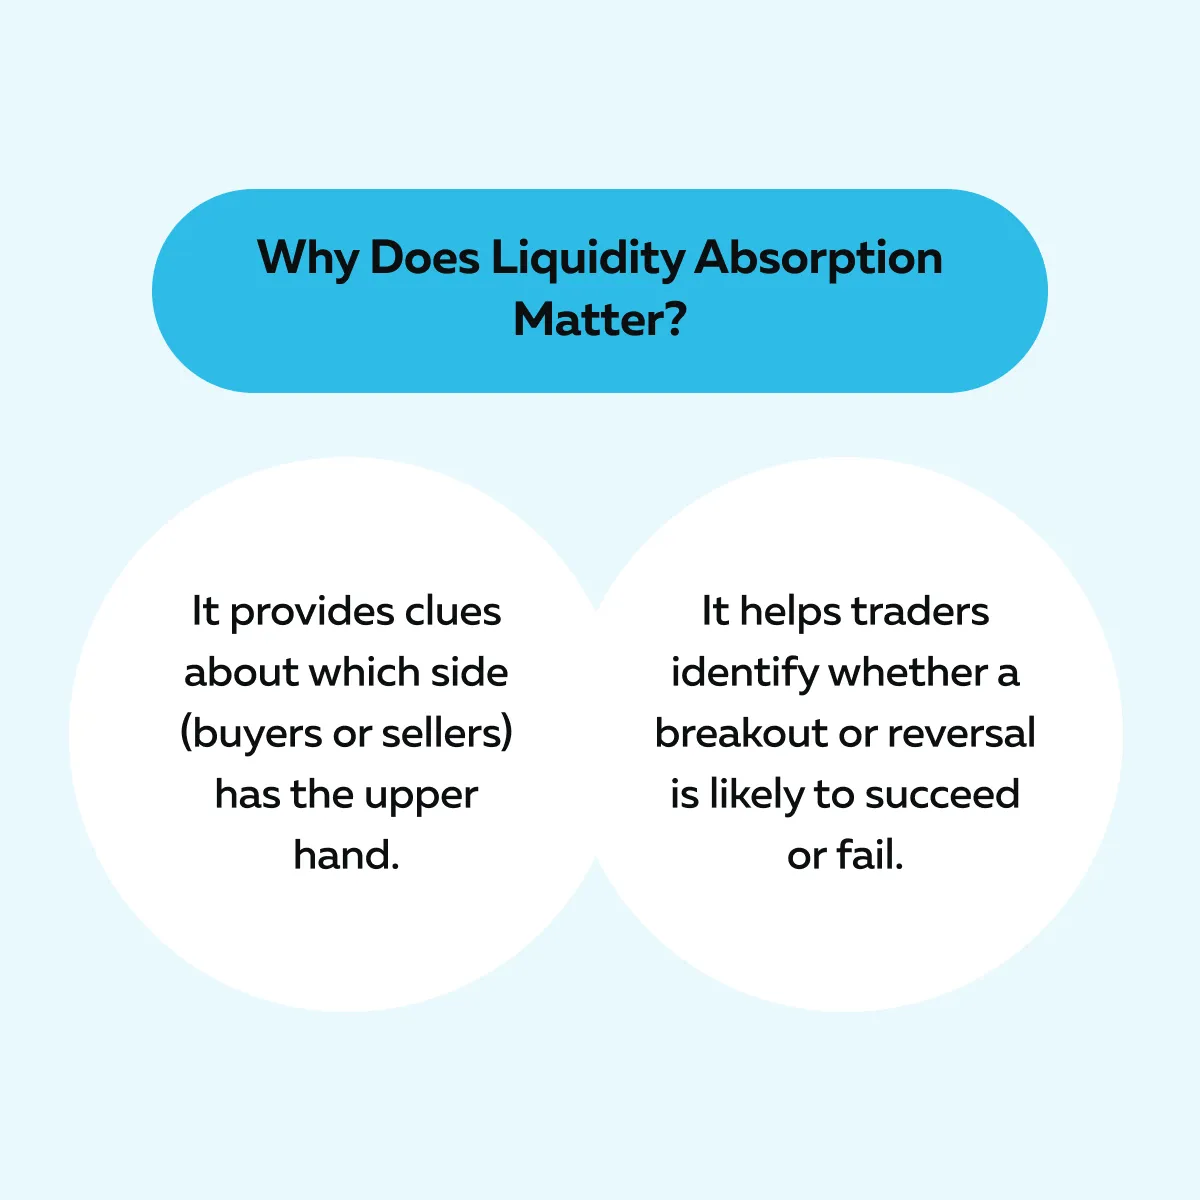
Let’s understand better through an example:
- Let’s assume a stock is approaching a key support level.
- On our tool, Bookmap, you observe multiple large buy orders (resting liquidity) getting filled.
- If the price doesn’t bounce despite this buying interest, it suggests that:
- Sellers are in control,
- They are absorbing the demand.
- These conditions reduce the probability of a long (buy) trade succeeding.
- Thus, you must adjust your strategies.
2. Identifying Large Buyer and Seller Interest
Our tool, Bookmap, also offers “heatmaps.” It displays zones where large limit orders are stacked. Using it, you can learn about significant buying and selling interest zones.
For example,
- Bright areas on the heatmap indicate heavy liquidity.
- They often act as potential support or resistance zones.
Why It’s Important?
- Large buy/ sell interest signals where institutions are likely placing significant orders.
- These zones often act as magnets. They draw the price toward them before a reversal or breakout.
For example, let’s assume our platform, Bookmap, displays heavy sell interest at $1,200. However, the price approaches this level with weakening volume. Now, the probability of a breakout is low. In such cases, you should wait for confirmation before entering a position.
3. Analyzing Volume Patterns for Trade Confirmation
Please note that volume plays an important role in probability-based trading decisions. Our tool, Bookmap, visually displays traded volume in real time. It helps traders assess whether buying or selling pressure is strengthening or weakening.

For Example:
- Let’s assume the price breaks above a resistance level.
- But our platform, Bookmap, shows low traded volume.
- Now, it signals weak conviction from buyers.
- This increases the likelihood of a failed breakout.
Why Bookmap Improves Probabilistic Thinking?
Bookmap doesn’t predict price direction! Instead, it provides the context traders need to make better-informed decisions. Using our tool, Bookmap, traders can observe:
- Liquidity absorption,
- Large order behaviour,
and
- Volume patterns.
This lets traders gain valuable insights that improve their judgment and execution.
How Does This Build a Better Trading Mindset?
| Context over Guessing | Adapting to Market Behavior | Fine-Tuning Your Bias |
| You’re not guessing market direction but reacting to visible data. | You assess whether the current environment supports your trade idea. | If data contradicts your initial plan, you adjust your position size or direction accordingly. |
Let’s study an example for a better understanding:
- Consider a scenario where the price approaches a strong support zone.
- Here, Bookmap shows multiple large-limit buy orders getting absorbed.
- However, despite the absorption, the price fails to rise.
- Now, this means:
- Sellers are overpowering buyers,
and
- The support zone may not hold.
- These conditions reduce the probability of a long (buy) trade succeeding.
- Thus, traders should consider a more neutral or bearish stance.
Conclusion
By making probability-based trading decisions, you can recognize when the odds are in your favor. This discretion smartly allows you to manage risks when they aren’t! Most successful traders know losses are part of the game, but a consistent, probability-based approach leads to long-term success.
Combining this mindset with our Bookmap’s real-time data allows you to gain deeper insights into market intent and spot high-probability setups. This strategy lets you avoid emotional decision-making.
Also, using our tool, Bookmap, you can visualize liquidity zones, volume patterns, and order flow. Through such a visualization, you can trade profitably, even when market conditions are uncertain.
Want to visualize market probabilities in real time? Bookmap’s heatmap shows where traders are committing capital.
Sign Up Now