


See market more clearly in real time.
Compare plans to access deeper market visibility for market.
Trading Basics
January 5, 2026
Updated
Market Cycles: The Key to Timely Trading Decisions

Are you aware of the rhythmic patterns that guide financial markets? These
patterns, also called ‘market cycles’, occur during times of growth and
decline.
Understanding these cycles helps in spotting emerging market trends and
making smarter investment decisions. Through this article, we will
understand the strategies for each phase after considering the principles of
adaptability, diversification, and risk management.
Whether you’re a seasoned trader or just starting, this article lets you
know the secrets of market cycles and makes you a better market participant.
Table of Contents
- What Are Market Cycles?
- Economic Phases and Fluctuations
- Cyclical Patterns in Financial Markets
- Understanding Boom and Bust Trajectories
- Seasonal and Sentiment Cycles
- Identifying Accumulation and Distribution Zones
- Leading Indicators for Market Cycle Shifts
- Historical Market Performance Across Cycles
- Mean Reversion and Market Behavior
- Applying Market Cycle Analysis
- Common Mistakes
- Frequently Asked Questions
What Are Market Cycles?
Market cycles describe the recurring expansion and contraction that occurs across financial markets over time. Although every cycle is unique, markets have historically moved through recognizable phases driven by changing economic conditions, investor psychology, liquidity, corporate earnings, and monetary policy.
Rather than moving in straight lines, financial assets typically alternate between periods of optimism, consolidation, pessimism, and recovery. Understanding these transitions helps traders and investors place current price action into broader context instead of reacting to every short-term movement.
Market cycles influence virtually every asset class, including:
- equities
- bonds
- commodities
- currencies
- cryptocurrencies
While no model predicts turning points perfectly, studying recurring market behavior can improve timing, risk management, and portfolio allocation.
The Types of Market Cycles
Understanding economic cycles is crucial for investors. By recognizing the
different phases of a market cycle, investors can:
-
Adjust their portfolios to align with the prevailing economic
conditions and -
Potentially capitalize on opportunities while mitigating risks.
Let’s break it down and explore it in detail.
Economic Phases and Fluctuations
Economic activity naturally expands and contracts over time.
These fluctuations are influenced by numerous factors including:
- consumer spending
- business investment
- central bank policy
- employment
- inflation
- credit availability
Financial markets frequently begin anticipating these changes months before official economic data confirms them.
Understanding how different asset classes respond during various economic environments allows traders to adjust expectations and position sizing accordingly.
Economic Cycles
Economic cycles (alternatively called ‘business cycles’) are recurring
fluctuations in economic activity characterized by the following phases:
-
Expansion
-
Peak
-
Contraction, and
-
Trough phases
These cycles have a profound impact on various financial instruments,
including stocks, bonds, and commodities. Read the table below to understand
the different phases of the market cycle:
|
Phase |
Explanation |
Investor Action |
|
Expansion Phase |
During the expansion phase, the economy experiences
|
Investors favor riskier assets, such as stocks, and |
|
Peak |
The peak represents the height of economic activity,
|
Investors closely monitor economic indicators to gauge |
|
Contraction Phase |
Contractions, also known as recessions, follow the peak
|
Investors turn to safer assets like bonds as they seek |
|
Trough |
The trough marks the lowest point of the economic cycle,
|
Investors start looking for opportunities in the stock |
Cyclical Patterns in Financial Markets
Financial markets rarely move randomly over long periods.
Instead, recurring cycles emerge as investor expectations evolve from optimism to caution before eventually returning to optimism again.
Typical market cycle characteristics include:
- accumulation
- sustained trends
- distribution
- corrections
- recovery
Recognizing these recurring behaviors helps traders distinguish temporary volatility from broader structural changes.
Understanding Boom and Bust Trajectories
Markets tend to alternate between periods of expansion and contraction.
Boom phases are generally characterized by:
- improving economic data
- rising corporate earnings
- increasing investor confidence
- expanding liquidity
Bust periods often involve:
- slowing growth
- tightening financial conditions
- declining confidence
- increased volatility
Rather than attempting to predict exact tops or bottoms, many traders focus on recognizing where the market currently sits within the broader cycle.
How Do Phases Impact Financial Instruments?
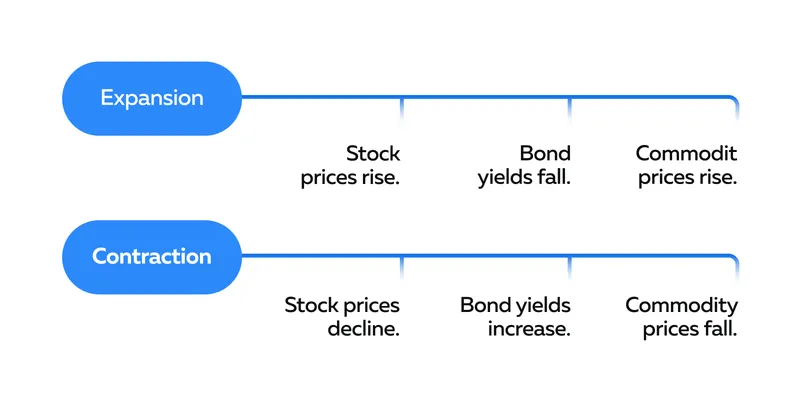
Market cycles affect stocks, bonds, and commodities in various ways during
their different stages:
-
Stocks:
-
In the expansion phase, stocks perform well as companies
generate higher profits. -
During contractions, stock prices decline, but selective
investments may offer value during the trough.
-
-
Bonds:
-
Bonds are considered safer investments during contractions as
interest rates often decline. -
Investors seek the relative stability and fixed income that
bonds provide in uncertain economic times.
-
-
Commodities:
-
During expansions, demand for commodities rises, leading to
higher prices. -
In contractions, commodity prices decline due to reduced demand.
-
Seasonal Cycles
Seasonal cycles refer to predictable patterns that occur during specific
times of the year. These cycles are visible in the commodities and retail
sectors and are influenced by the following factors:
-
Weather
-
Holidays, and
-
Consumer behavior.
Let’s understand this concept in-depth.
The Major Commodities
|
Agriculture Commodities |
Energy-based Commodities |
|
Spring Planting:
|
Summer Driving Season:
|
|
Harvest Season
|
Winter Heating Season
|
The Retail Stocks
-
Holiday Season:
-
Pre-Holiday:
-
Retail stocks experience a boost in anticipation of
increased consumer spending during the holiday season. -
Investors choose to buy retail stocks before this period,
expecting a rise in sales and stock prices.
-
-
Post-Holiday Sales:
-
After the holiday season, some retail stocks experienced a
dip. -
Investors explore buying opportunities as companies may
recover through post-holiday sales and promotions.
-
-
-
Back-to-School Season:
-
Investors put money in retail companies that sell school
supplies before the back-to-school season. -
They anticipate a surge in consumer spending during this time.
-
How Weather Impacts Prices
Let’s explore how weather influences crude oil and retail clothing to grasp
this concept.
|
Crude Oil |
Retail Clothing |
|
|
Sentiment Cycles
Sentiment cycles refer to the fluctuating emotions of market participants, which influences their perceptions of the financial
markets. These cycles play a crucial role in:
-
Shaping market trends and
-
Providing valuable insights
By understanding sentiment cycles, investors understand and respond to
shifts in market sentiment.
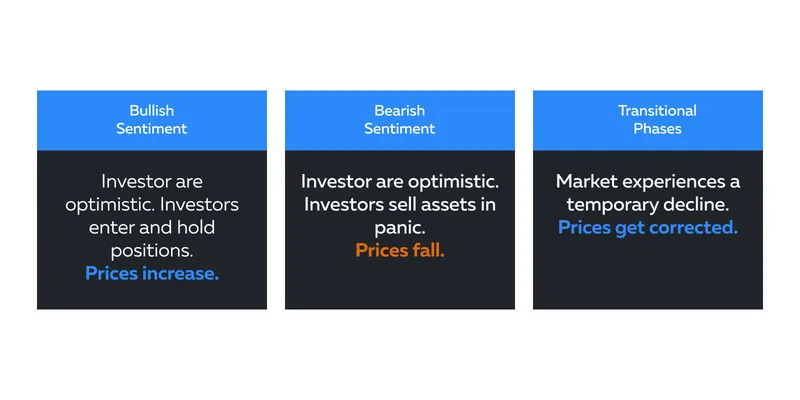
How Do Sentiments Impact Market Trends?
-
Bullish Sentiment:
-
During periods of bullish sentiment, investors are optimistic
about the market’s prospects. -
This optimism leads to rising stock prices.
-
More market participants buy and hold securities, anticipating
further gains.
-
-
Bearish Sentiment:
-
This sentiment reflects a pessimistic outlook on the market.
-
In this phase, investors sell off assets due to fear and
uncertainty. -
This bulk sale leads to a decline in prices.
-
-
Transitional Phases:
-
Sentiment cycles also include transitional phases, such as
corrections. -
During this period, the market experienced a temporary decline
before resuming its previous trend. -
Identifying these phases is crucial for investors to
differentiate between a:-
Short-term correction and
-
More prolonged trend reversal.
-
-
How to Identify Shifts in Market Sentiments
To identify the prevailing market sentiments, investors can perform the
following actions:
-
Monitor news headlines, significant news events, economic data
releases, or geopolitical developments. -
Track social media platforms, forums, and online communities. These
act as sentiment indicators. -
Perform technical analysis using tools, like Bookmap, to identify shifts in sentiments.
-
Chase economic indicators, especially those related to consumer
sentiment to valuable information. For example, a decline in
consumer confidence may signal a potential shift towards bearish
sentiment.
Analyzing and Responding to Market Cycles
Successful market cycle analysis involves combining macroeconomic context with current market behavior.
Rather than attempting to forecast exact turning points, traders seek evidence that confirms whether markets remain in expansion, transition, contraction, or recovery.
Effective analysis typically incorporates:
- economic indicators
- price structure
- liquidity conditions
- market participation
- investor sentiment
Combining multiple forms of analysis generally produces more robust conclusions than relying on any single indicator alone.
Identifying the Phase of a Market Cycle
Investors can use various techniques and indicators to identify where the
market stands in its cyclical pattern.
Economic Indicators:
-
GDP Growth:
-
Monitoring Gross Domestic Product (GDP) growth rates provide
insights into the economic cycle. -
High GDP growth often indicates an expansion phase, while a
decline may signal a contraction.
-
-
Employment Data:
-
Low unemployment rates are associated with expansion while
rising unemployment signals contraction.
-
Technical Analysis:
-
Moving Averages:
-
Using moving averages, such as the 200-day moving average,
identifies trends and potential turning points in the market
cycle. -
Crossovers and deviations from these averages signal changes in
momentum.
-
-
Relative Strength Index (RSI):
-
RSI indicates whether a market is overbought or oversold.
-
This indicator provides insights into potential trend reversals.
-
Sentiment Analysis:
-
Contrarian indicators:
-
These represent the ratio of bulls to bears in investor surveys
and signal potential reversals. -
Extreme bullish sentiments precede market peaks, while extreme
bearish sentiments indicate potential buying opportunities.
-
Leading Indicators for Market Cycle Shifts
No single indicator consistently predicts economic turning points.
Instead, traders frequently monitor multiple leading indicators together, including:
- yield curve behavior
- manufacturing activity
- unemployment trends
- inflation expectations
- consumer confidence
- corporate earnings revisions
These indicators should be viewed collectively rather than independently, since individual data releases can produce misleading signals.
Some Common Case Studies and Hypothetical Examples
Read the table below to understand how techniques have been used effectively
in the past.
|
Case Study |
Indicators |
Investor Response |
|
2008 Financial Crisis |
Leading up to the 2008 financial crisis, indicators such |
Investors who recognized these signals:
|
|
Technological Bubble Burst (2000): |
During the late 1990s, the technology sector experienced
Indicators like extreme overvaluation of tech stocks |
Investors identifying these signs:
|
Historical Performance of Equities During Expansionary Periods
Historically, equity markets have tended to perform strongest during sustained economic expansions, although returns vary considerably between sectors.
Growth-oriented industries often outperform early in expansions, while defensive sectors may become relatively stronger as economic momentum slows.
Rather than assuming every expansion follows the same pattern, traders should continuously evaluate whether current market leadership supports the broader economic environment.
Mean Reversion Behavior in Asset Pricing
Markets frequently experience periods where prices extend significantly above or below longer-term averages before gradually reverting toward equilibrium.
Mean reversion does not imply that prices must immediately reverse after strong trends.
Instead, it suggests that unusually extended valuations often become increasingly difficult to sustain without continued fundamental support.
Many traders combine mean reversion concepts with market structure and liquidity analysis to identify areas where momentum may begin slowing.
Adjusting Trading Strategies for Market Cycles
Investors need to adjust their trading styles to respond effectively to the
various phases of market cycles. Let’s understand the ideal strategies
below:
Expansion Phase
-
Focus on Growth Stocks:
-
In the expansion phase, growth stocks tend to outperform.
-
Allocate a portion of the portfolio to technology and consumer
discretionary sectors.
-
-
Cyclical Sectors Emphasis:
-
Allocate resources to cyclical sectors like industrials and
materials. -
These sectors benefit from increased economic activity and
infrastructure development during expansion.
-
-
Maintain a Higher Risk Appetite:
-
Given the optimistic market sentiment, most investors consider
taking on slightly more risk, such as investing in small-cap
stocks or high-beta equities.
-
Recession Phase Strategy
-
Defensive Stocks:
-
Defensive stocks are less sensitive to economic downturns.
-
Allocate a significant portion of the portfolio to defensive
sectors like utilities and healthcare.
-
-
Quality Dividend Stocks:
-
Invest in companies with a history of consistent dividends.
-
These stocks offer income during recessions and provide a buffer
against market volatility.
-
-
Safe-Haven Assets:
-
Consider allocating a portion of the portfolio to safe-haven
assets like gold and treasury bonds. -
These assets perform well during economic uncertainties.
-
How to Diversify? – Top 3 Tips
Diversifying investments across different sectors, geographies, and asset
types allows investors to lower their risk and optimize their portfolios for better risk management. Let’s understand the most followed diversification strategies:
|
Sector Diversification |
Asset Class Diversification |
Geographical Diversification |
|
|
|
How to Implement Risk Management
To optimize returns and minimize potential downsides, investors must develop
rigorous risk management strategies. They can do the following:
-
Set Stop-Loss Orders
-
Implement stop-loss orders to limit potential losses.
-
During market volatility, these orders automatically sell a
position if it reaches a predetermined price. -
Such an automatic execution protects profits or minimizes
losses.
-
-
Asset Allocation Rebalancing:
-
Periodically rebalance the portfolio to maintain the desired
asset allocation. -
This practice ensures that the portfolio aligns with the
investor’s risk tolerance and financial goals.
-
-
Stay Informed
-
Stay informed about economic indicators, news, and market
sentiment. -
Regularly assess the portfolio’s performance.
-
Adjust strategies based on evolving market conditions.
-
Common Mistakes and How to Avoid Them
By recognizing and actively addressing common mistakes related to market
cycles, traders can:
-
Enhance their decision-making processes and
-
Improve overall portfolio performance
Read the table below to understand some common mistakes made by traders and
the strategy to avoid them.
|
Common Mistakes |
Explanation |
Avoidance Strategy |
|
Misinterpretation of Economic Indicators |
Traders struggle to accurately identify the current |
|
|
Overreacting to Daily Volatility |
Traders overreact to short-term market fluctuations and |
|
|
Lack of Diversification |
Traders overconcentrate investments in a single sector |
|
Overreaction to Market Noise
Traders should be cautious about overreacting to short-term news or events
that do not necessarily signal a significant shift in the market cycle.
Thus, traders must verify the information from multiple sources.
Further, traders must establish a well-thought-out trading plan that
considers the long-term market cycle. They must avoid deviating from the
plan based on short-term market noise to prevent making impulsive and
suboptimal decisions.
Implementing Market Cycle Analysis in Trading
Market cycle analysis should complement—not replace—a trader’s existing strategy.
Most professionals use market cycles to provide higher-level context while relying on their primary execution methodology for individual trade decisions.
For example, understanding that markets are transitioning from expansion toward contraction may influence:
- overall risk exposure
- sector selection
- trade duration
- position sizing
Execution, however, still depends on each trader’s preferred methodology.
Integrating Cycle Analysis into Your Trading Plan
Here’s the integration guide:
-
Step I: Expand Knowledge Base:
-
Understand the various phases of the market cycle.
-
Familiarize yourself with key economic indicators that signal
transitions.
-
-
Step II: Economic Indicator Alerts:
-
Utilize financial news platforms and economic calendars to set
up alerts for key indicators such as:-
GDP growth
-
Unemployment rates, and
-
Consumer confidence
-
-
These alerts notify you of potential shifts in the economic
cycle.
-
-
Step III: Use Sentiment Analysis Tools:
-
Incorporate tools like Bookmap to visualize market liquidity and
sentiment changes. -
Create custom visualizations to highlight:
-
Key support and resistance levels
-
Large order imbalances, or
-
Sudden shifts in sentiment.
-
-
-
Step IV: Real-Time Monitoring:
-
Regularly monitor Bookmap during trading sessions to stay
informed about evolving market dynamics. -
Pay attention to:
-
Order flow
-
Trading volumes, and
-
Liquidity changes.
-
-
-
Step V: Regularly Review Cycle Positioning:
-
Establish a routine for reviewing your portfolio’s positioning
in relation to the market cycle. -
During these reviews, evaluate the allocation of your portfolio
across different sectors and asset classes. -
Ensure that your positions align with the prevailing market
conditions and economic cycle phase.
-
Focus on Adaptability
Adapting in a trading plan is crucial as it allows traders to stay
responsive to ever-changing market conditions. Here’s how you can remain
adaptive:
-
Acknowledge the dynamic nature of market cycles and be prepared to
adapt your trading strategies. For example, shift focus between
growth and defensive stocks based on the economic outlook. -
Adjust risk management parameters based on the current phase of the
market cycle. In periods of heightened volatility or economic
uncertainty, consider tightening stop-loss levels to protect against
larger drawdowns. -
Be flexible in sector rotation based on economic indicators. If
leading indicators suggest an economic slowdown, consider rotating
into defensive sectors like utilities and healthcare. -
Modify asset class allocations as market conditions evolve. For
instance, during economic expansions, allocate more to equities,
while during contractions, increase exposure to fixed-income assets.
Broader Perspectives on Market Cycle Analysis
Numerous frameworks attempt to explain recurring market behavior.
Examples include:
Elliott Wave Theory
Elliott Wave Theory proposes that markets progress through recurring impulse and corrective waves driven largely by investor psychology. While widely followed, interpretations often differ between analysts.
Kitchin and Juglar Business Cycles
Economic research has also identified shorter inventory cycles (Kitchin cycles) and longer investment cycles (Juglar cycles). Although these models simplify complex economies, they provide useful historical perspectives on recurring business activity.
Rather than relying exclusively on one framework, many traders combine multiple analytical approaches with current market evidence.
Conclusion
Understanding market cycles is vital for successful trading. Traders must
strategically adjust portfolios, by focusing on growth stocks during
expansions and defensive assets in recessions.
Diversification and effective risk management help traders to optimize
portfolios and achieve long-term success. Additionally, the usage of
advanced market analysis tools like Bookmap offers a competitive advantage
and an enhanced ability to spot emerging patterns via depth-of-market
visualization.
As you refine your approach to trading with market cycles, understanding
market correlations becomes increasingly important. Discover how different
markets and assets interact and influence each other in our in-depth guide,
‘Market Correlations: Why They Matter and How They Impact Your Trading
Journey.’ This resource will complement your knowledge of market cycles and
enhance your trading strategy.
Explore the Guide Here
Frequently Asked Questions
Are you interested in the psychological stages of market sentiment or the quantitative data used to track economic expansions and contractions?
Both approaches provide valuable information. Sentiment helps explain investor behavior, while economic data offers measurable evidence of broader market conditions. Many traders combine both perspectives when analyzing market cycles.
Do you want to focus on equity markets specifically or the broader global economy?
Although equity markets often receive the most attention, market cycles influence bonds, commodities, currencies, and cryptocurrencies as well. Global economic conditions frequently affect multiple asset classes simultaneously.
Can market cycles predict future prices?
No. Market cycles provide context rather than certainty. They help traders understand where markets may be within broader economic trends but cannot accurately forecast exact turning points.
What is the difference between accumulation and distribution?
Accumulation refers to periods where buying gradually absorbs selling pressure following declines. Distribution typically occurs after prolonged advances when larger participants gradually reduce positions while public participation remains elevated.
Which indicators are commonly used to monitor market cycles?
Traders frequently monitor GDP growth, unemployment, inflation, manufacturing surveys, corporate earnings, consumer confidence, yield curves, and market breadth alongside price action and liquidity conditions.
How does Bookmap complement market cycle analysis?
Market cycle analysis provides macro context, while Bookmap helps traders evaluate real-time liquidity, order flow, and participation. Together they allow traders to combine long-term market context with short-term execution decisions.
Sign Up Now
Latest Articles