See order flow more clearly in real time.
Compare plans to access deeper market visibility for order flow.
Book Summaries
February 16, 2026
SHARE
Technical Analysis vs. Order Flow: Techniques and Tools for Traders
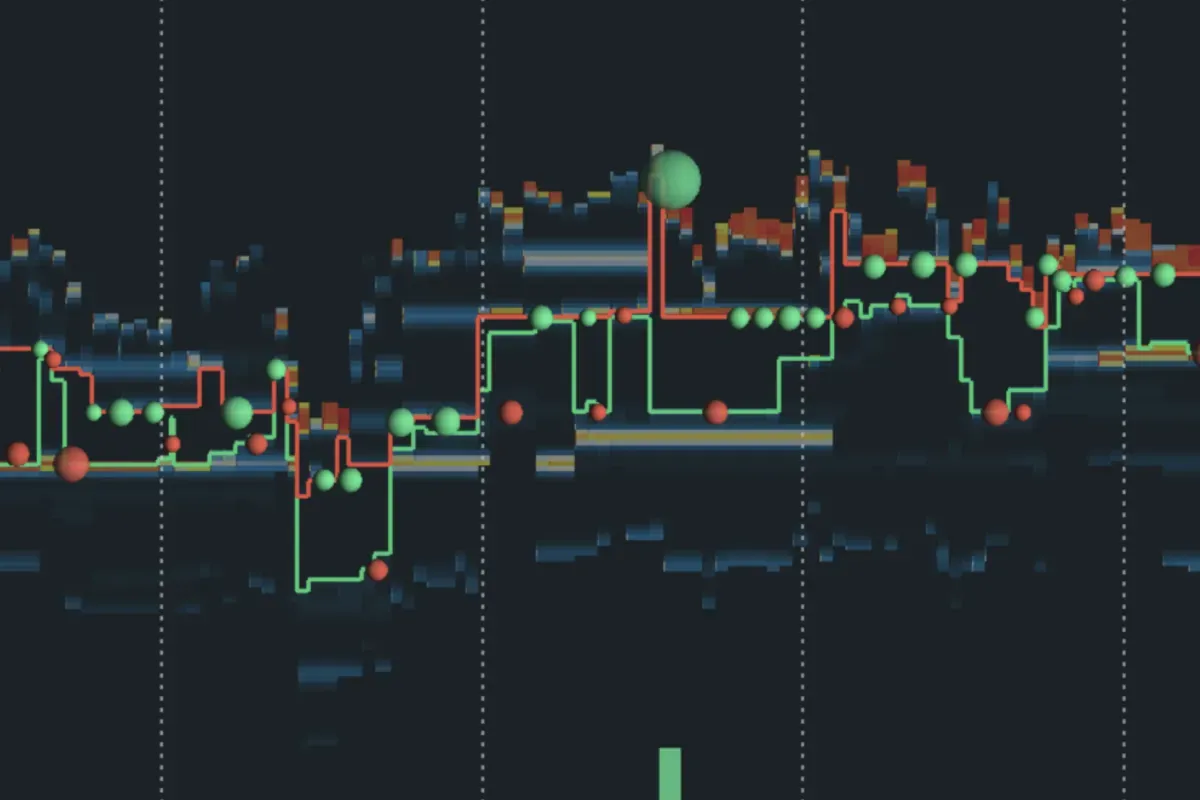
Table of Contents
- What is Technical Analysis and Order Flow?
- Pros and Cons of Technical Analysis
- Why Order Flow Analysis Offers an Edge
- Key Techniques in Order Flow Analysis
- Essential Tools for Effective Order Flow Analysis
- Integrating Order Flow with Technical Analysis and Sentiment
- Building Trading Strategies with Order Flow
- Case Examples: Trading with Order Flow
- How to Implement Order Flow Analysis with Bookmap
- Conclusion
- FAQs
What is Technical Analysis and Order Flow?
Technical Analysis (TA) involves examining historical market data—primarily price and volume—to identify and predict market trends. Traders utilize patterns and indicators derived from past market behavior to inform trading decisions.
Order Flow Analysis is the technique of observing and interpreting the real-time flow of buy and sell orders, including their size and aggressiveness, to predict immediate future price movements. It provides insight into market participants’ intentions and the underlying dynamics driving prices.
What is Order Flow in Trading?
Order flow trading is the process of analyzing the real-time stream of buy and sell orders in a market to understand supply and demand dynamics. Unlike traditional technical analysis that looks at historical price movements, order flow focuses on the present, providing insight into the intentions of market participants, especially large institutional traders. By observing the size and location of orders, traders can anticipate potential price movements.
Pros and Cons of Technical Analysis
Pros:
- Simplifies market data into identifiable patterns.
- Defines clear entry and exit points.
- Helps predict trend reversals based on historical data.
Cons:
- Ignores fundamental economic data.
- Can produce conflicting signals, causing confusion.
- Requires extensive practice and understanding to interpret correctly.
Why Order Flow Analysis Offers an Edge
Order flow analysis complements and surpasses TA by providing deeper, real-time insights:
- Market Transparency: Reveals underlying market mechanics through actual trades and orders.
- Early Signals: Identifies shifts in buying or selling pressure before traditional indicators do.
- Precision: Tracks liquidity changes, large trade impacts, and real-time bid-ask spreads.
Limitations:
- Does not incorporate macroeconomic or fundamental news directly (though the effects of these may appear indirectly).
- Requires skilled interpretation and advanced tools.
Explaining Order Flow Analysis
Order flow analysis is a specialized form of market analysis that provides a microscopic view of market activity. It examines individual orders and their volumes to determine who controls the market—buyers or sellers.
Key elements include:
- Depth of Market (DOM): shows open buy and sell orders at each price level.
- Footprint charts: display the executed buy and sell volume at each price within a candle.
These tools help traders identify imbalances between aggressive and passive orders, signaling possible price direction.
Key Techniques in Order Flow Analysis
When it comes to financial markets, mastering the art of order flow analysis can be a game-changer. It can be done by learning several techniques employed in order flow analysis. Let’s have a look at some popular techniques and see how you can enhance your chances of profitable outcomes.
Strategy I: Reading the Order Book
By reading the changes in the order book, traders can better predict upcoming price movements. See the graphic below to understand how:
Let’s understand better using a hypothetical example:
- Assume that an asset is trading at $50.
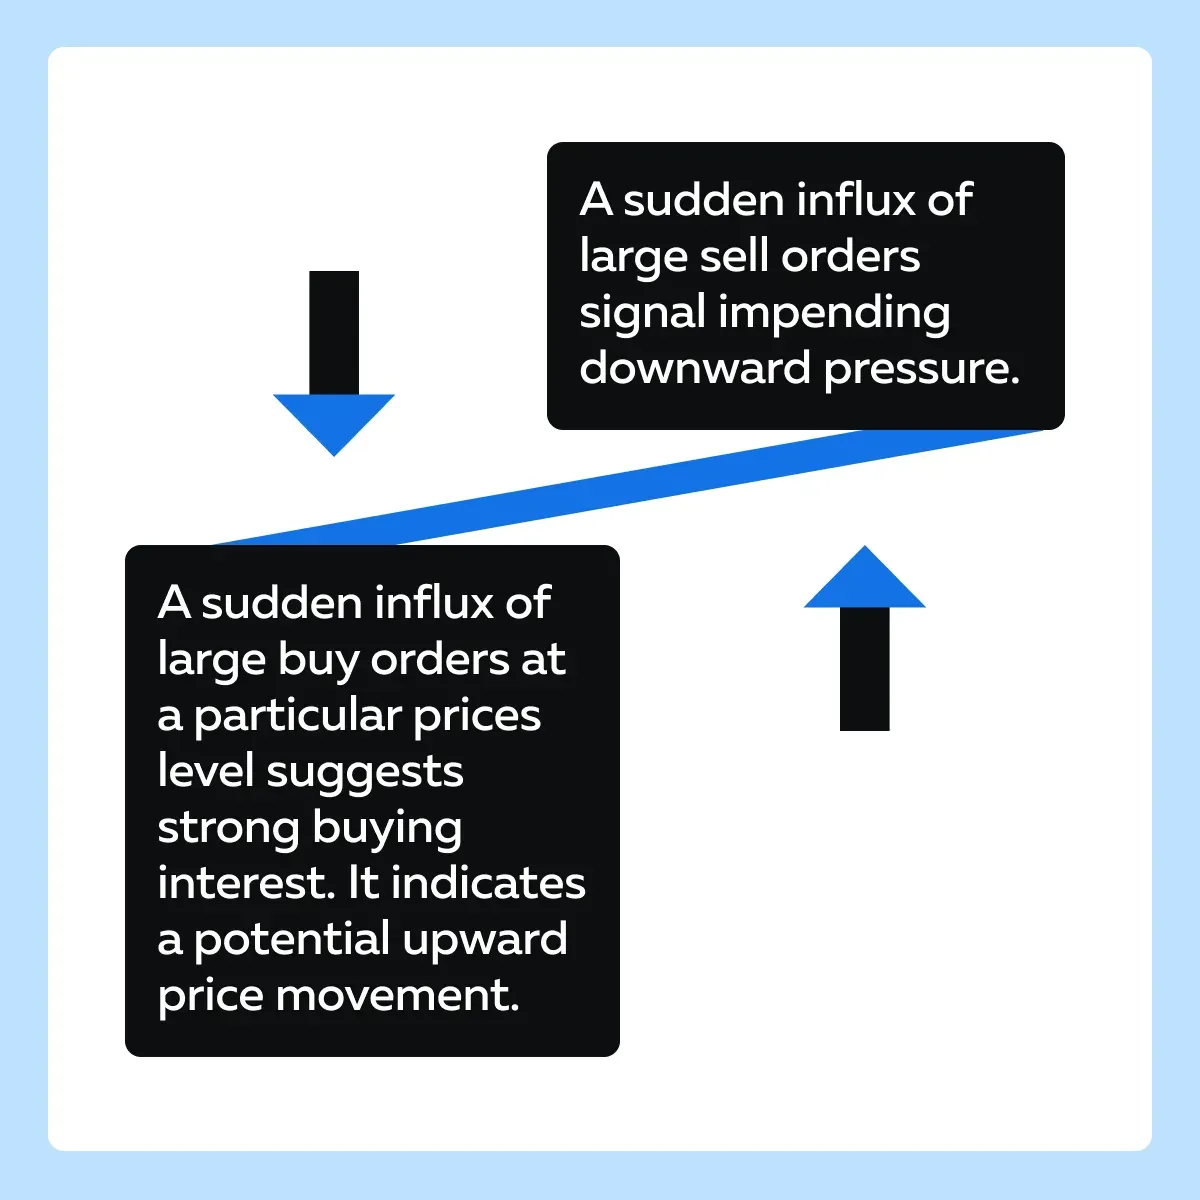
- The order book shows a significant increase in large buy orders (e.g., 10,000 shares each) at $49.90.
- This accumulation suggests strong demand at this price level and acts as a support zone.
- If the current price is close to this level, it may bounce upwards due to the buying pressure.
Strategy II: Volume Analysis
In this strategy, traders analyze volume at specific price levels. Let’s see how:
| Volume Clusters | Pivot Points |
|
|
Let’s understand better using a hypothetical example:
- Assume that an asset consistently shows high volume at the $100 price level.
- Each time the price approaches $100, it either bounces back or drops.
- This price action indicates a strong resistance or support zone.
- By analyzing these volume spikes, traders set their entry or exit points near this level.
Strategy III: Time and Sales (Tape Reading)
In this strategy, traders interpret the time and sales feed (also known as the tape). These tapes provide real-time data on every executed trade, including the following:
- Price,
- Volume, and
- Time of execution.
Mostly, large block trades significantly impact market direction. By closely monitoring these trades, traders can anticipate potential price movements. For example, here’s a scenario to understand this better:
- Assume that while monitoring the tape, a trader notices a series of large sell transactions (e.g., blocks of 5,000 shares each) executed within a short period.
- This sudden surge in selling pressure leads to immediate price drops.
- The trader recognizes this pattern and decides to:
- Sell their position
or
- Enter a short trade.
- They are anticipating further price decline.
How to Use Order Flow for Trading
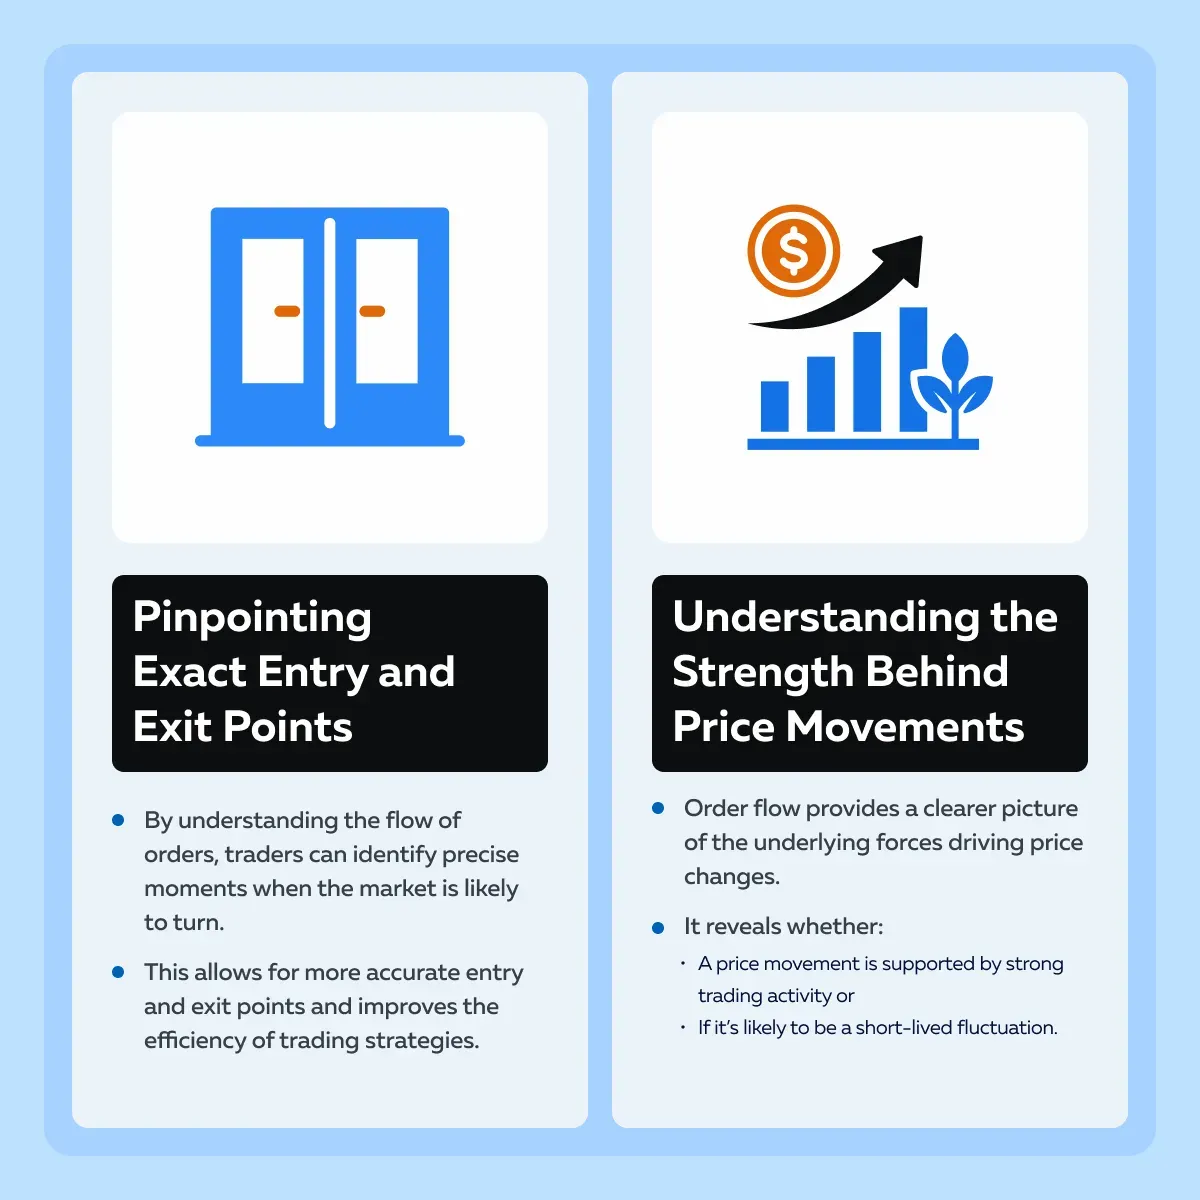
Traders use order flow to make more precise trading decisions by:
- Identifying Support and Resistance: Large clusters of buy or sell orders often act as key liquidity zones.
- Confirming Signals: Order flow confirms whether buying or selling pressure supports signals from other indicators.
- Finding Optimal Entries and Exits: Watching where large orders appear helps traders time their entries and exits.
- Gauging Market Sentiment: Reveals whether the market is dominated by aggressive buyers or sellers.
Essential Tools for Effective Order Flow Analysis
Traders must note that they will need sophisticated tools to use order flow analysis. These tools will help capture and interpret the complex data involved. Among the several tools, Bookmap, and advanced market analysis tools stand out and provide useful features for effective order flow analysis. Let’s have a look at some common features available across all the platforms:
- Real-time Data
- Instantaneous updates on order flow
- These updates ensure traders have the latest market information.
- Historical Data
- Access to past order flow data
- It helps in developing backtesting strategies and understanding historical market behavior.
- Custom Alerts
- Notifications based on specific criteria, such as:
- Large orders
or
- Sudden changes in volume.
- These notifications help traders react promptly.
What are some of the unique features and capabilities offered by Bookmap?
| Bookmap’s Features | Meaning | Benefit |
| Real-time Heatmaps |
|
|
| Volume Bubbles |
|
and
|
| Execution Insights |
|
|
Order Flow vs. Volume Profile
Both order flow and volume profile analyze trading activity, but they serve different purposes.
- Volume Profile: Displays total traded volume at each price over a given time—useful for spotting historical areas of interest.
- Order Flow: Focuses on live order execution, showing whether buyers or sellers are being more aggressive.
Volume Profile is static, while Order Flow is dynamic and reveals the ongoing interaction between liquidity and executed orders.
Order Flow Trading Analysis Tools
Bookmap’s order flow tools help traders identify patterns of accumulation or distribution, track aggressive buyers and sellers, and recognize changes in market sentiment as they occur.
How to Choose Order Flow Trading Software
When selecting order flow software, consider:
- Whether it offers full-depth market data for your instruments.
- The quality and speed of the data feed.
- Tools for identifying key levels and large participant activity.
- Visual clarity so patterns are easy to spot under pressure.
What Are the Key Features of Order Flow Trading Tools?
Bookmap’s core features for order flow trading include:
- A real-time heatmap for liquidity visualization.
- Volume bubbles to highlight executed trades.
- Historical market depth playback for review and study.
- Custom alerts for unusual activity or liquidity changes.
What Is the Difference Between Order Flow and Technical Analysis?
Technical analysis studies past price and volume to identify patterns. Order flow focuses on current market activity, showing exactly where traders are placing orders and how price reacts. This makes it possible to anticipate moves based on the actions of participants rather than waiting for a pattern to complete.
Order Flow Trading Software Pricing
Bookmap offers different subscription tiers to suit various traders. Costs depend on the features you need, the markets you trade, and whether you require additional market data packages such as BookmapData for CME or Nasdaq.
Order Flow Trading Strategies
Bookmap can be used for strategies such as:
- Absorption when large passive orders hold price.
- Iceberg detection to spot hidden large orders.
- Momentum trades following a rapid removal of liquidity.
Why should you integrate order flow data with other market data?
Order flow analysis as a standalone tool is effective. However, this effectiveness increases manifolds when it is integrated with other technical indicators and sentiment analysis tools. This integration enables traders to perform a “comprehensive analysis”. Let’s see how:
| Technical Indicators | Fundamental Analysis | Market Sentiment Tools |
|
|
|
Furthermore, this integration provides a rounded approach to market analysis and leads to better trading decisions by:
- Enhancing Decision-making
- Integration creates a multi-faceted approach that includes:
- Order flow,
- Technical data,
- Fundamental data, and
- Sentiment data.
- This approach leads to more informed and balanced trading decisions.
- Risk Management
- By cross-referencing different data sources, traders can better manage risks.
- They can avoid doing trades based on incomplete or misleading information.
- Offering Strategic Flexibility
- The ability to see the market from multiple perspectives allows traders to:
- Adapt their strategies to varying market conditions
and
- Improve overall performance.
Indicators Used for Order Flow Trading
Common indicators and tools used in order flow trading include:
- Footprint Charts: Show buy and sell volume at each price level within a candle, highlighting imbalances.
- Cumulative Volume Delta (CVD): Tracks the net difference between buying and selling volumes to reveal divergence.
- Depth of Market (DOM): Displays pending buy and sell limit orders in real time.
- Large Lot Tracker & Iceberg Detection: Identify hidden or institutional orders that influence price movement.
Best Trading Analysis Tools
A strong trading platform should provide clear market data, flexible visualizations, and tools to study how liquidity interacts with price. Bookmap delivers this for traders in futures, stocks, and crypto.
Top Financial Market Analysis Software
Bookmap provides an in-depth view of order flow that goes beyond traditional charting. It allows you to track liquidity shifts, volume events, and market reactions in real time.
Day Trading Software with Volume Profile
With Bookmap, traders can combine volume profiles with heatmaps to see where trading activity concentrates. This helps identify support and resistance levels with greater accuracy.
Trading Platform with Depth of Market
Bookmap displays full-depth market data, allowing traders to see every visible order in the book. This is essential for understanding supply and demand dynamics and for making informed intraday decisions.
Top Order Flow Trading Software
Order flow trading software allows traders to see where liquidity sits in the market and how orders are interacting in real time. Bookmap provides this with precision, offering a clear view of the order book, executed trades, and liquidity changes as they happen.
Leading Tools for Order Flow Analysis
Within Bookmap, traders can use:
- Real-time heatmaps to visualize liquidity zones and see how they change.
- Volume bubbles to spot executed trades and gauge buying or selling pressure.
- Liquidity trackers to follow large orders and potential iceberg activity.
Most Effective Order Flow Trading Platforms
For traders who want to base their decisions on real-time market data, Bookmap stands out by combining full-depth order book visibility with historical playback, custom alerts, and high-quality market data.
Building Trading Strategies with Order Flow
Order flow suits various trading styles:
| Trading Style | Strategy |
| Scalping | Quick trades based on micro-trends and immediate liquidity shifts. |
| Day Trading | Identify intraday high-volume zones for precise entry/exit points. |
| Swing Trading | Utilize cumulative volume data to determine broader market momentum. |
Adjusting Strategies:
- Continuously monitor real-time order flow data.
- Use predefined risk management rules.
- Avoid emotionally driven decisions.
For a detailed guide on creating a trading strategy, journaling, testing, and management, refer to this Bookmap blog post.
Order flow techniques apply to multiple trading styles:
- Scalping: Quick trades based on micro liquidity changes.
- Day Trading: Pinpoint intraday zones of interest using volume clusters.
- Swing Trading: Use cumulative volume data to capture momentum over several sessions.
Best Order Flow Trading Tools for Futures
Bookmap supports CME full-depth data and offers features like liquidity tracking and iceberg order detection, making it a valuable tool for futures traders who rely on order flow.
Order Flow Analysis Software for Day Trading
Day traders can use Bookmap’s heatmap, volume dots, and liquidity tools to react quickly to market shifts and find precise entry and exit points.
Order Flow Tools for Institutional Investors
Institutional-style trading benefits from Bookmap’s ability to track large orders, study historical liquidity changes, and monitor how big participants impact the market.
Best Order Flow Tools for Options
While Bookmap does not display options order books directly, it can be used to track related futures or underlying stock activity to help interpret options market moves.
Order Flow Trading Strategies for Futures
Futures traders benefit from order flow due to transparent centralized data. Common approaches include:
- Trend and Reversal Identification: Spot shifts in buy/sell pressure early.
- Breakout Confirmation: Verify strong, aggressive volume before entering a breakout.
- Identifying Trapped Traders: Detect when traders are caught on the wrong side of a move, which can trigger sharp reversals.
Identifying Market Manipulation with Order Flow
Order flow analysis helps detect manipulation such as spoofing and iceberg orders.
- Spoofing: Large fake orders placed to mislead others and later canceled.
- Icebergs: Hidden large orders divided into smaller visible pieces.
By monitoring the heatmap and order evolution, traders can recognize these behaviors in real time and avoid being trapped by false signals.
Case Examples: Trading with Order Flow
- Successful Trade: Spotting high volume at support levels indicating strong buying interest.
- Cautionary Tale: Ignoring order cancellations, resulting in failed support.
- Mixed Scenario: Effective scalping disrupted by unexpected news highlights the importance of diversified analysis and risk management.
How to Implement Order Flow Analysis with Bookmap
Order flow analysis becomes particularly powerful when paired with advanced visualization tools like those offered by Bookmap. Traders can significantly improve their trading strategies by using Bookmap’s:
- Real-time heatmaps,
- Volume dots,
- Liquidity trackers, and more.
For a comprehensive guide on order flow analysis, refer to Bookmap’s Learning Center.
Now, let us see how you can use Bookmap’s visualization tools:
Heatmaps
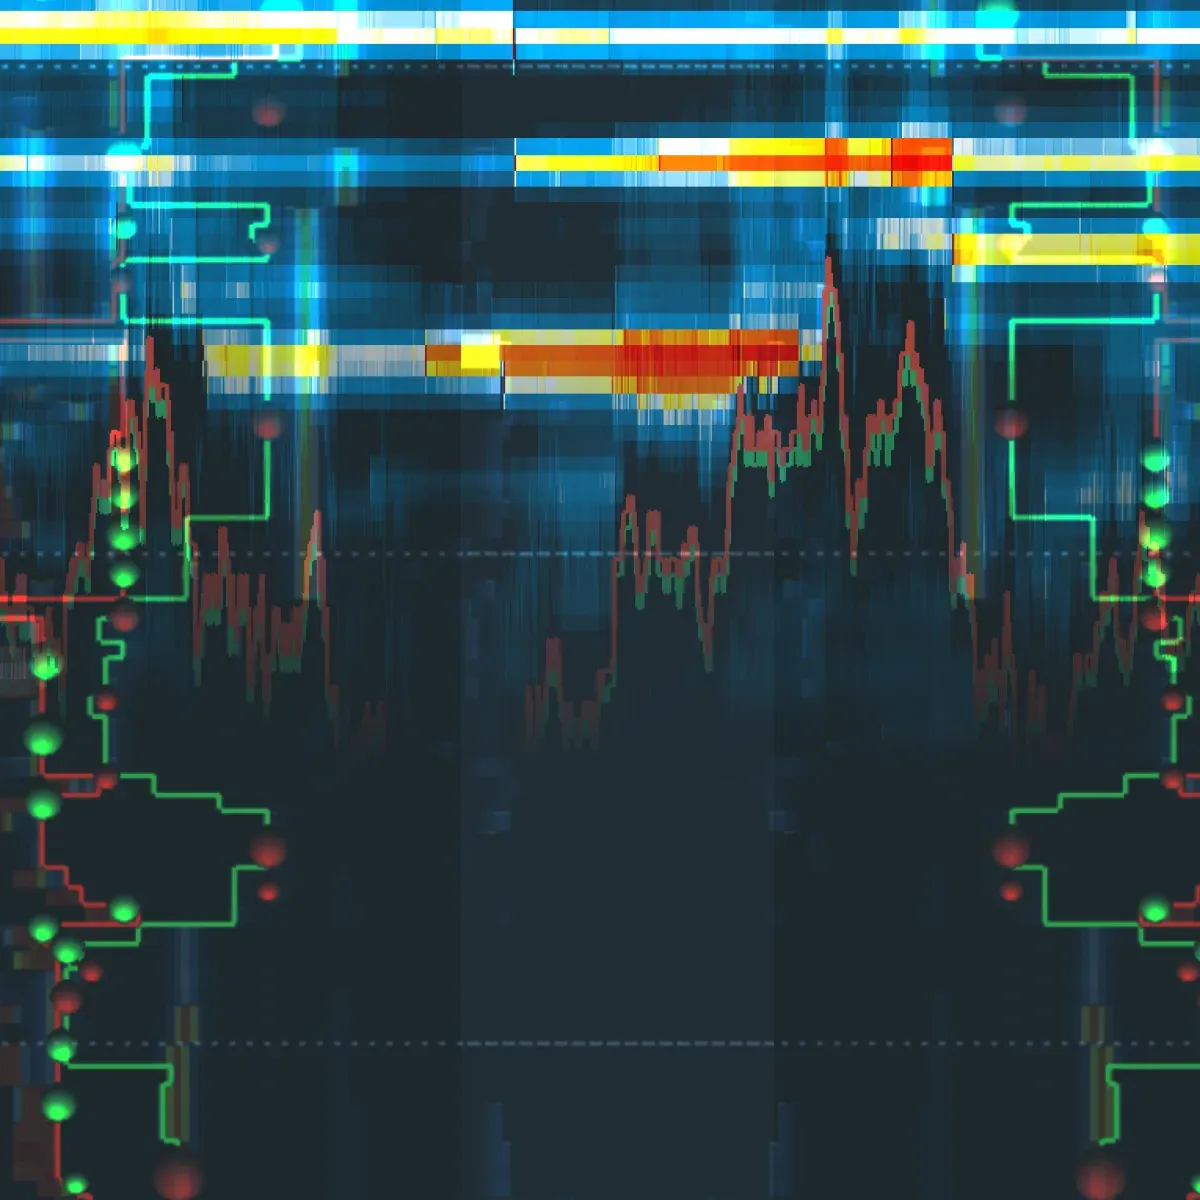
Bookmap’s heatmaps visually represent liquidity. They show where large orders are placed in the market. Different colors indicate varying levels of liquidity, with brighter colors representing higher concentrations of orders.
Example
- Assume a trader is observing a heatmap.
- It shows a large cluster of buy orders at $100 for a particular stock.
- As the price approaches this level, the trader anticipates strong support.
- When the price dips to $100 and large buy orders start getting executed (indicated by the heatmap turning bright), the trader enters a long position.
- The price then rises due to the buying pressure.
- The trader enjoys a profitable trade.
Volume Dots
Volume dots on Bookmap display “executed trades.” The size of these volume dots represents the trade size. Larger dots indicate higher-volume trades, which often signify institutional activity.
Example
- A trader notices multiple large-volume dots (indicating high-volume trades) around the $105 level
- This activity suggests strong buying interest
- Recognizing this as a potential accumulation phase by institutions, the trader decides to buy.
- Soon after, the stock price surges
- This happens because:
- The accumulation leads to a breakout
and
- The trader’s entry point gets validated
Large Lot Tracker
The large lot tracker highlights trades involving large quantities. These trades are mostly executed by institutional investors. By following these large trades, traders learn about big market players’ activities. For example,
- A trader observes consistent large buy orders.
- This situation indicates institutional accumulation and a bullish trend.
For our better understanding, let’s observe a hypothetical example showing how visualization helped identify a key entry point before a major price movement.
- Assume that a trader is observing a stock trading around $150 using Bookmap
- The heatmap shows substantial liquidity at:
- $148 (strong support)
and
- $152 (resistance).
- As the price nears $148, the trader sees a series of large buy volume dots and high liquidity on the heatmap.
- The trader recognizes strong support and institutional buying interest.
- The trader decides to enter a long position at $148.
- The price holds at $148 due to the large buy orders and begins to rise.
- The trader then notices the price breaking through the $152 resistance.
- The increasing volume of dots confirms the upward momentum.
- The trader exits the position at $155.
- They secure a profit from the identified entry point.
What is Algorithmic Trading?
Algorithmic trading uses automated, pre-programmed instructions to execute orders based on factors like price, time, and volume. Platforms with API access allow traders to integrate order flow data into their automated systems, improving timing and execution accuracy.
Conclusion
Order flow analysis offers traders actionable insights by revealing real-time market dynamics, enhancing precision in entries and exits. Combining these insights with advanced tools like Bookmap provides clarity, improved decision-making, and risk management.
Ready to integrate order flow into your trading? Start with Bookmap today.
FAQs
What are chart patterns? Visual formations created by price movements used to predict future market direction.
Common Technical Analysis Tools:
- MACD
- Moving Averages
- RSI
- ADX
- Stochastic Oscillator
- Bollinger Bands
What Is Order Flow Trading?
Order flow trading is the process of analyzing how buy and sell orders interact in real time, with the goal of predicting short-term price movements based on liquidity behavior and trade execution patterns.
Order Flow for Beginners
If you are new to order flow, start by:
- Learning how to read the heatmap.
- Watching how price reacts to large visible orders.
- Understanding how aggressive orders push through liquidity.
Is Order Flow Trading Profitable?
Order flow trading can be profitable for traders who have the skills to interpret the data accurately and the discipline to follow a structured plan. Like any approach, it requires practice, testing, and proper risk management.
What Data Is Needed for Order Flow Analysis?
To trade with order flow in Bookmap, you need:
- Full-depth market data.
- A time and sales feed for executed trades.
- Optional MBO (Market-by-Order) data for granular insight into individual orders.
What indicators are used in order flow trading?
Footprint charts, Cumulative Volume Delta (CVD), Depth of Market (DOM), and iceberg detectors are key order flow tools.
What is the difference between order flow and volume profile?
Volume profile is a historical summary of traded volume; order flow reveals real-time buying and selling aggression.
Can order flow analysis help detect market manipulation?
Yes. It can reveal spoofing, iceberg orders, and hidden liquidity through live heatmap visualization.
Is order flow trading suitable for futures markets?
Yes. Futures provide centralized order books, making order flow data highly transparent and precise.
Ready to explore more? Join Bookmap now.
Sign Up Now