See market activity more clearly in real time.
Compare plans to access deeper market visibility for market activity.
Stocks
January 15, 2026
SHARE
NQ vs ES: Why They Move Together, Until They Don’t
Let’s assume the stock market is a symphony, and ES and NQ futures are the lead instruments. Now, what will you observe? Usually, they play in harmony, but occasionally they hit different notes!
Yes, most of the time, the Nasdaq vs S&P 500 futures move together. They follow the same market rhythm, which is influenced by macro sentiment and Fed policy. But sometimes, one surges while the other stalls. And that’s when things get interesting!
These moments of divergence between NQ and ES are strong clues about market rotation, liquidity changes, and trader psychology. If you can interpret them, you can better anticipate price movements.
Want to stop chasing price blindly? Read this article to learn how index composition, liquidity structure, and order flow changes influence the ES and NQ relationship. You’ll also understand how to recognize, analyze, and even trade these divergences with the help of advanced market analysis tools like Bookmap.
Why NQ and ES Usually Trade in Sync
E-mini-Nasdaq-100 (NQ) or E-mini-S&P 500 (ES) futures show correlated moves because they respond to the same economic and market conditions, such as:
- Inflation data,
- Interest rate changes, and
- Investor sentiment.
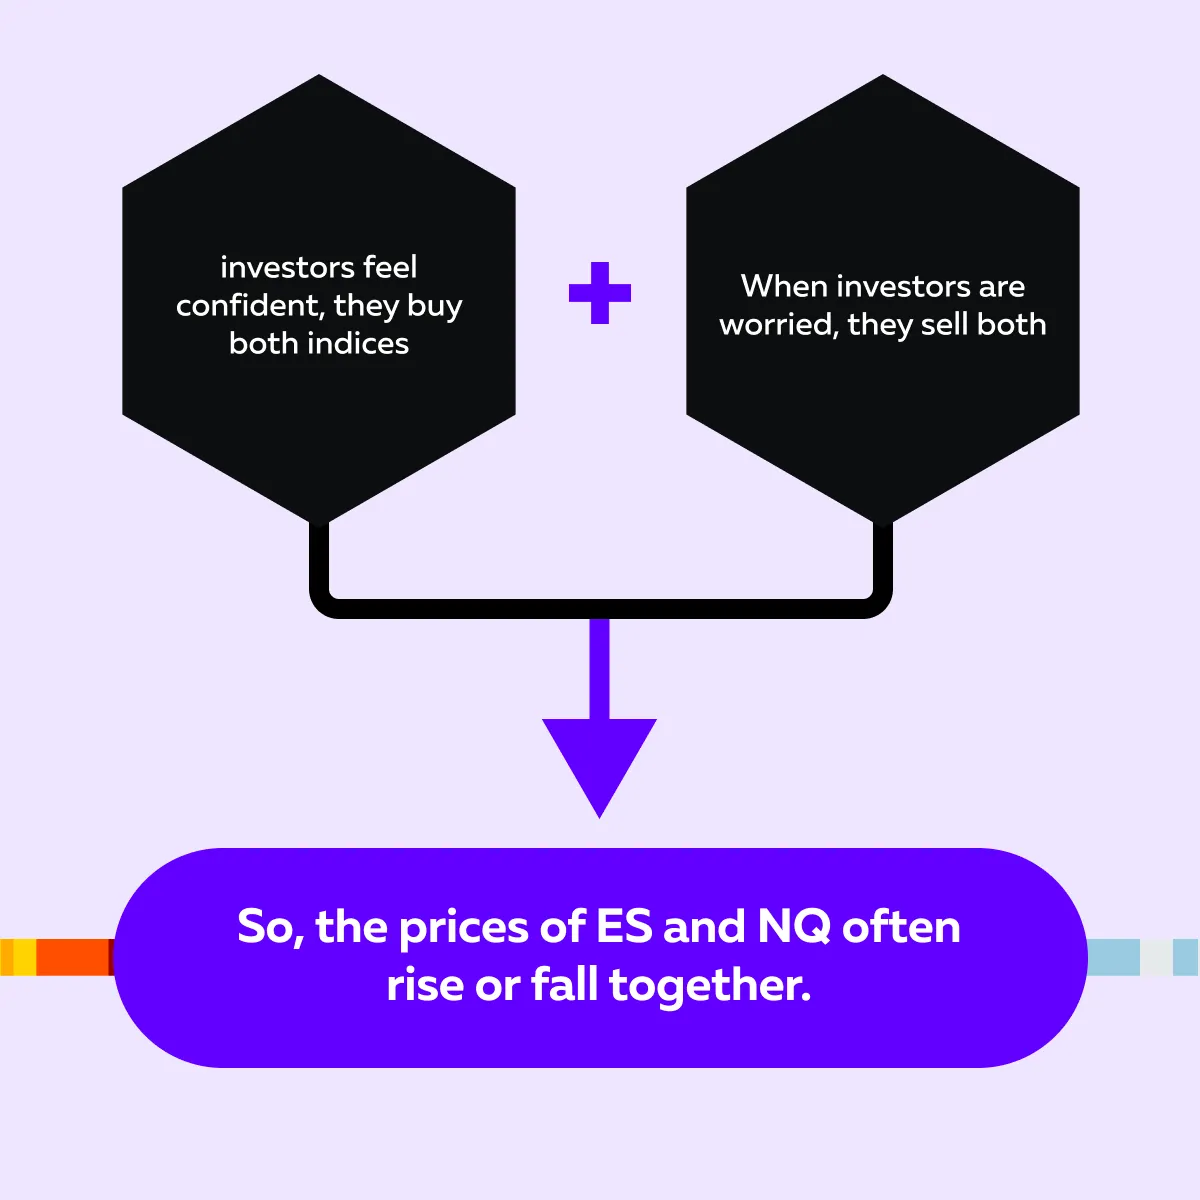
When investors feel optimistic about the economy (say, after strong jobs data or a dovish Fed meeting), money flows into equities. That’s known as a “risk-on” environment, and it pushes both NQ and ES futures higher. On the other hand, when fear or uncertainty hits (for example, owing to geopolitical tension or poor inflation data), both drop as traders shift to a “risk-off” stance.
But That’s Not It! Check Out These Reasons for This Tight Relationship:
| Reason | Explanation | Effect on ES-NQ Relationship |
| Index and ETF Arbitrage |
|
|
| Passive Investment Flows |
|
|
| Intraday Liquidity Providers and Algos |
|
|
Still, remember that correlation doesn’t mean equality! ES and NQ don’t always move with the same speed or intensity. For example,
- Let’s say tech stocks, which dominate the Nasdaq, rise or fall sharply.
- Now, NQ futures may react much faster or more strongly than ES futures, which are more diversified.
So, even if both points are in the same direction, the intensity of change can be different. Compare order flow between NQ and ES side-by-side →
What’s Inside the Index: ES vs NQ Composition Differences
The Nasdaq vs S&P 500 futures comparison isn’t just about size! It’s about sensitivity. To understand NQ and ES correlation, and when it might break, you first need to look at what each index is made of:
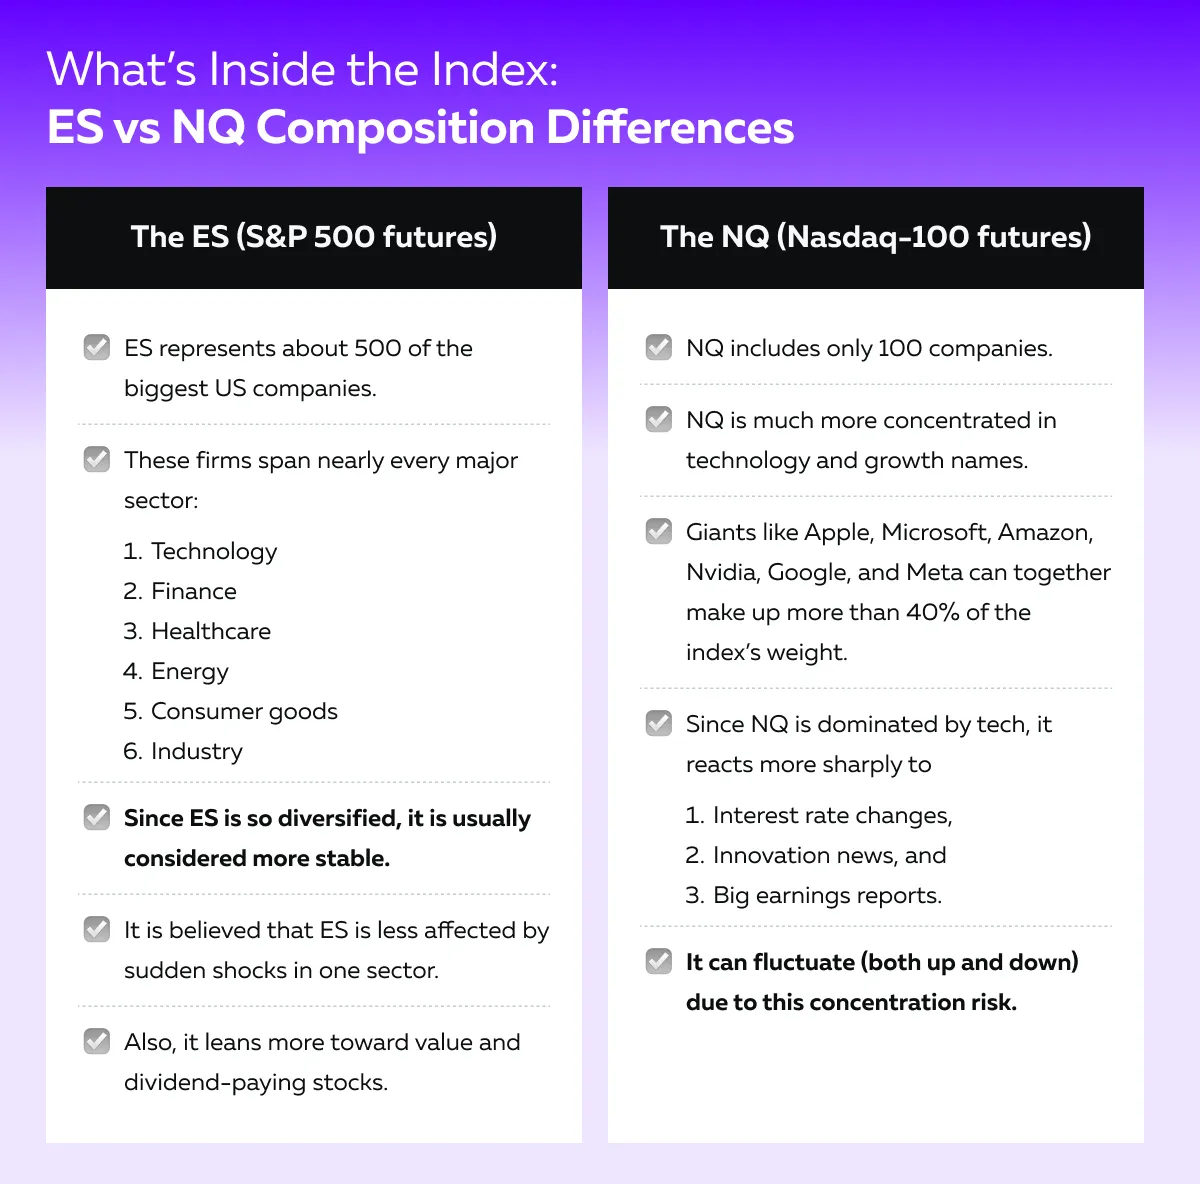
So, as a smart trader, you must realize that even if the market mood is stable, one major tech headline can send NQ futures surging or sliding while ES futures remain relatively calm.
What Causes Divergence Between NQ and ES?

Divergence between NQ and ES futures doesn’t happen randomly! It’s usually triggered by some “recurring catalysts”. By learning about these catalysts, you can easily recognize:
- When the Nasdaq vs S&P 500 futures relationship might temporarily break down
and
- How to better trade that index futures divergence.
Now, let’s check out some popular recurring catalysts that cause divergence between NQ and ES:
1. Sector-Specific News or Earnings
As mentioned before, NQ is heavily influenced by major tech stocks. So, if a big player like Apple or Meta reports weak earnings, NQ may drop sharply. In contrast, ES could stay stable thanks to strength in financials or energy.
Conversely, positive news around AI or semiconductors can lift NQ faster than ES.
2. Interest Rate Expectations
When interest rates rise, future earnings of growth companies (like those in NQ) get discounted more heavily. That’s why NQ often falls more than ES when:
- Bond yields jump
or
- The Fed sounds hawkish.
3. Macro Rotations
In times of inflation or high commodity prices, investors may rotate out of tech. They could migrate and enter into value or cyclical sectors that are favoring ES over NQ. Additionally, institutional rebalancing between sectors can also tilt flows in one direction.
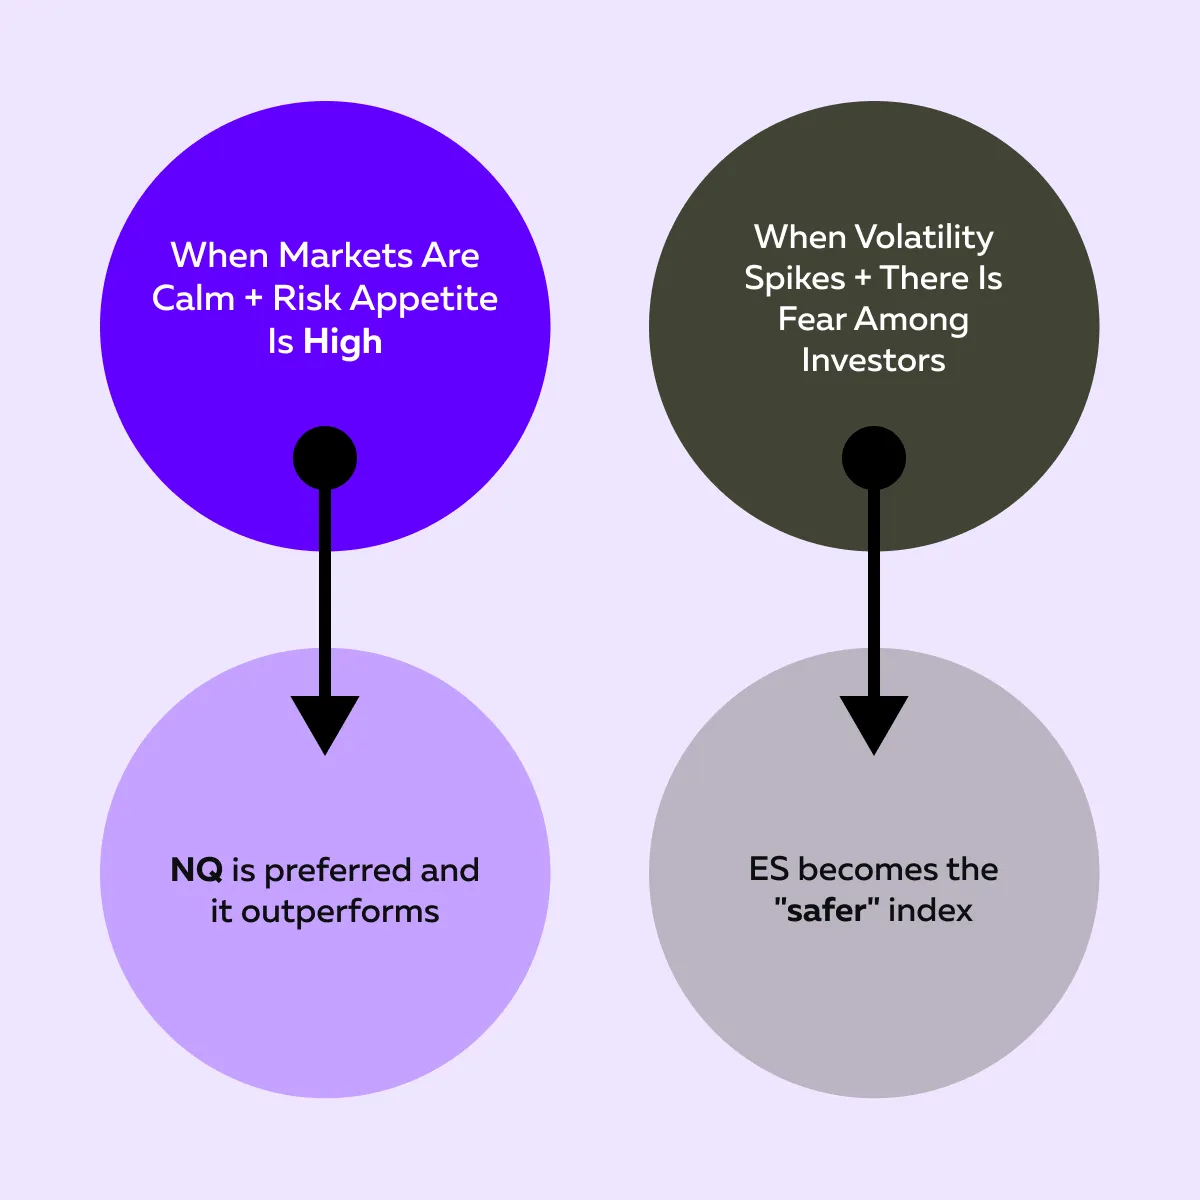
4. Risk Appetite and Volatility
When the market feels stable and optimistic, investors are more willing to take risks! So, they buy tech-heavy NQ futures, which usually rise faster.
In comparison, when the market becomes uncertain or volatile, traders prefer safer and more balanced investments like ES futures. During those fearful periods, NQ may fall more sharply. This causes the two indices to diverge or move differently.
5. Options Market Influence
Options market activity can also affect how NQ and ES futures move during the day. Dealers who sell options on QQQ (Nasdaq) or SPY (S&P 500) often hedge their risk by buying or selling futures.
When gamma positioning (their exposure to price movements) changes, they might need to adjust those hedges. This buying or selling can add extra pressure to one index and make it move more sharply, while the other lags!
Need a Pro Tip!
Keep an eye on implied correlation indicators and sector ETF flows, particularly XLF (financials) vs XLK (technology). Such an observation lets you spot early signs of expected ES and NQ divergence before it plays out.
Liquidity and Microstructure Differences Between ES and NQ
Do you think the ES and NQ futures differ only in terms of the companies they represent? Nope! They also behave differently at the micro level. Their liquidity and trading structure influence price movements and reversals. Let’s understand in detail:
| ES (S&P 500 futures) | NQ (Nasdaq-100 futures) |
|
|
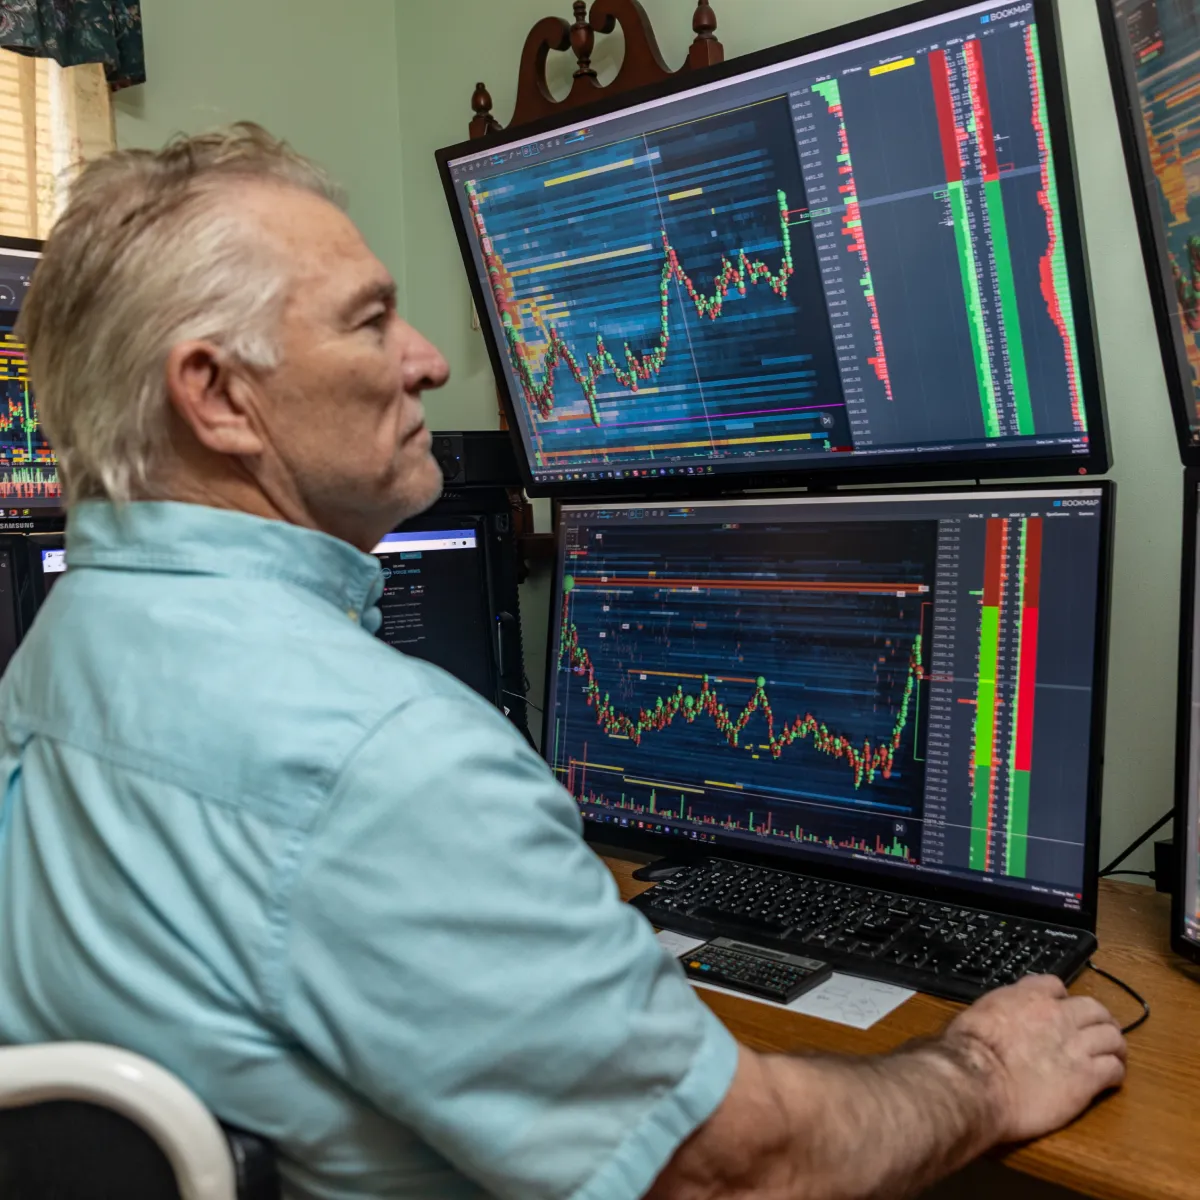
Okay, but how to spot these differences? You can start using advanced real-time order flow analysis tools, like Bookmap. On them, you’ll often see NQ displaying:
- Sharper stop runs,
- Flash reversals, and
- Iceberg order spikes.
In contrast, ES will appear calmer and more stable. See how passive liquidity behavior differs between ES and NQ →
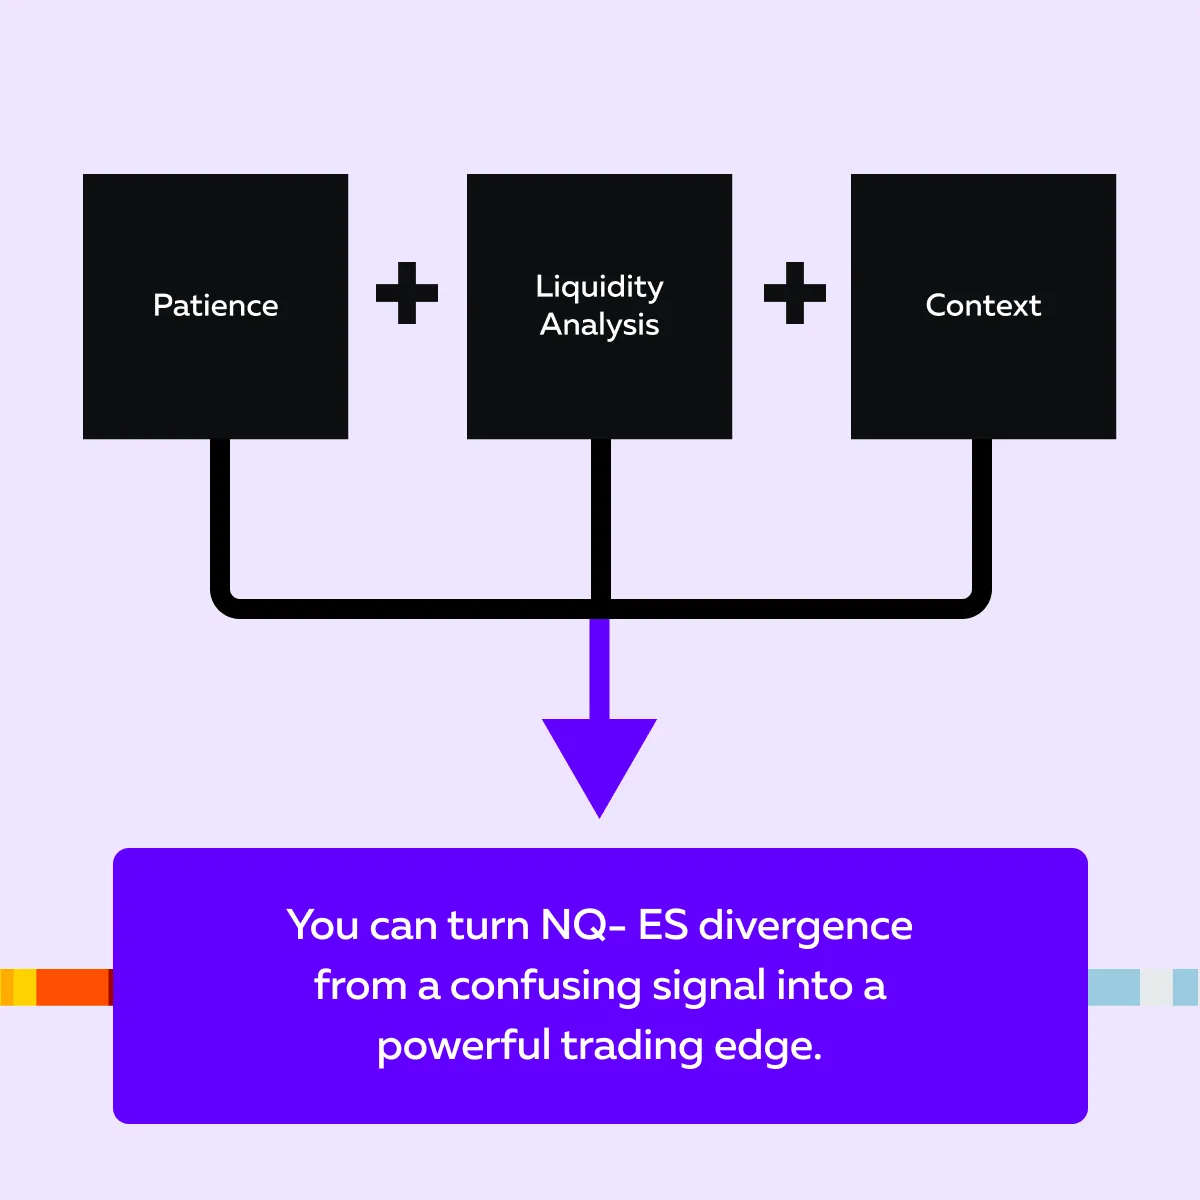
How to Trade When ES and NQ Diverge
When ES and NQ futures start moving apart, it’s a signal. When you try to understand why the NQ and ES correlation is breaking, you can react intelligently instead of emotionally. Let’s see how professional traders approach index futures divergence with discipline and context:
1. They Identify the Lead!
Firstly, pro traders figure out which index is setting the tone. If NQ moves first, it’s often a tech-driven shift. But if ES moves higher while NQ lags, that could signal an inflation or interest rate theme favoring value and financials.
In this way, by knowing the leader, you can easily interpret what’s really driving price!
2. They Confirm with Order Flow
Most pro traders use volume + delta data to see if one index’s move has real conviction. They check the “liquidity heatmap” to check whether the lagging index stalls or shows absorption.
3. They Remain Cautious with Mirroring Trades
Professional traders never assume that if ES breaks out, NQ will follow. That’s because divergence can persist if liquidity or volume doesn’t support alignment. Thus, you also must always confirm if both instruments are moving with genuine participation.
4. They Look for Mean Reversion or Convergence
Many divergences eventually fade, but usually after stop runs or fake breakouts. Wait for signs of exhaustion in the leading index before trading a reversion setup.
5. They Use Bookmap to Replay Divergence Scenarios
Veteran and successful traders often use order flow tools like Bookmap. Using it, they can replay how ES vs NQ futures behaved during key events, such as:
- Fed meetings,
- CPI releases, and
- Mega-cap earnings.
By studying past patterns using Bookmap, you can sharpen your sense of timing + spot divergence setups in real time. Replay divergence days in Bookmap to spot repeatable setups →
Conclusion
So now you know that ES and NQ futures usually move together. However, there are cases when divergence also appears because of:
- Tech earnings shocks,
- Changing rate expectations, and
- Liquidity differences between the two markets.
That’s why most professional traders know that the ES and NQ relationship is dynamic, not fixed.
As a trader, if you also want to trade this relationship more effectively, you must monitor real-time volume, order flow, and sector momentum (instead of assuming both indices will always align). When divergence appears, treat it as useful information! It is a clue about market sentiment, rather than noise or confusion.
Furthermore, you can even use leading market analysis tools like Bookmap to study how Nasdaq vs S&P 500 futures behave during major events. The more you understand their rhythm and reaction, the better your trades will be. Use Bookmap’s full-depth liquidity view to track rotations in real time →
FAQs
1. Why do ES and NQ usually move together?
Both ES and NQ futures represent the complete US stock market mood. When hit by major economic news like Fed announcements or global events, most investors buy or sell equities broadly.
That’s why both indices usually rise or fall in the same direction. They even show similar macro sentiment and risk appetite.
2. Why does NQ move faster or more aggressively?
The NQ (Nasdaq-100) is dominated by large tech stocks. It has thinner liquidity compared to ES. This makes it more sensitive to headlines about:
- Technology
- Interest rates
- Innovation trends
Thus, due to fewer large resting orders in the NQ order book, price moves can stretch quickly and reverse just as fast!
3. Should I trade both NQ and ES the same way?
No! NQ futures are more volatile. They demand tighter stops and need you to make quick decisions. In contrast, ES futures are more stable with fewer fluctuations. They suit more structured setups.
Thus, it is recommended that, based on each instrument’s speed and liquidity profile, you must adjust your:
- Position size,
- Stop-loss distance, and
- Trading strategy.
4. What tools help identify divergence between ES and NQ?
You can utilize real-time order flow tools, such as Bookmap, which will help you:
- Spot where liquidity builds or disappears,
- Learn how aggressive buyers or sellers act, and
- Track which index leads.
Additionally, you can even compare this data between ES and NQ futures to spot genuine divergence early and avoid false signals.
5. Can divergence between ES and NQ be traded directly?
Yes, but trade carefully! Some traders use spread strategies, where they buy the weaker index and sell the stronger one. They do so expecting prices to converge.
However, this approach requires experience and a solid understanding of the “index futures divergence strategy”. Also, you should have a comprehensive understanding of the market structure.
Sign Up Now