Ready to see the market clearly?
Sign up now and make smarter trades today
Education
December 25, 2024
SHARE
Pairs Trading: A Deep Dive into this Market Neutral Strategy

In the financial world, “pairs trading” is a market concept that involves
identifying two related securities that move in harmony.
The selection of securities is akin to choosing dance partners who move well
together. To make the best selections, traders delve into historical
relationships and perform correlation analysis. However, the market, much
like life, is unpredictable. Even the best pairs can fall out of sync.
This article provides a comprehensive examination of pairs trading, with a
particular emphasis on risk management, exit strategies, and the analytical
tools that can empower traders to achieve a competitive advantage. So, let’s
get started.
Foundations in Pairs Trading
Pairs trading is firmly grounded in the principles of
statistical arbitrage
and mean reversion. It’s a market strategy that involves:
-
Methodical identification of two closely related securities, often
two stocks operating within the same sector. -
Creating a pair to trade based on the historical relationship
between their prices.
Let’s understand the rationale.
The Rationale Behind the Strategy
Pairs trading doesn’t focus on the individual performance of each stock but
rather on the relative performance between the two stocks. The ultimate goal
is to comprehend the consistent distance or relationship.
For instance, if two stocks were racing cars, pairs trading wouldn’t bet on
who wins, but on the distance between them staying consistent.
The Basis of Pairs Trading
Pairs trading as a strategy is based on these two foundational concepts:
|
Statistical Arbitrage |
Mean Reversion: |
|
|
How Correlation Drives Pairs Trading
In the context of pairs trading,
correlation
can be likened to two synchronized swimmers. Just as these swimmers move in
harmony, correlated stocks move together and show a similar directional
movement in their prices. When graphing the correlation between stock pairs
over time, you would typically see a line or chart showing the degree of
correlation.
In ideal circumstances, this trend should:
– Exhibit a positive trajectory or
– Maintain a consistently high level
Such a trend signifies a robust positive correlation, indicating that the
prices of the paired stocks move harmoniously in the same direction.
Is Stock Correlation Foolproof?
No, it is not. Despite the apparent synchrony in correlated pairs, there
have been instances where even highly correlated stocks have deviated from
their expected behavior. Let’s explore the various factors contributing to
these deviations:
i. Unforeseen Events: Sudden market shocks, economic crises, regulatory
changes, or unexpected news can disrupt the customary correlation between
related stocks.
ii. Company-Specific News: Events such as earnings reports, management
changes, or product success or failure can prompt one stock within a
correlated pair to diverge from the other.
iii. Changes in Investor Sentiment: Shifting market trends, alterations in
investor sentiment, or changes in macroeconomic conditions can also lead to
temporary interruptions in the correlation between paired stocks.
How to Implement Pairs Trading
Choosing the appropriate pair is the cornerstone of successful pairs
trading. Usually, this decision is based on historical co-movement between
two stocks. Let’s explore this process in greater detail.
Selecting the Right Pair
Selecting a stock pair for pairs trading can be likened to selecting dance
partners. Just like good dancers move in sync, a successful pair in trading
should show a strong historical correlation in their price movements.
Let’s understand it better through a hypothetical case.
-
There are two tech companies, say A and B.
-
Both have shown a consistent historical relationship in their stock
prices. -
Over a span of six months, both stocks have consistently moved in
tandem.
This correlation can be observed through:
-
Rigorous statistical analysis
-
Comprehensive charting
-
Thorough research into their historical price movements.
How Choosing the Wrong Pair Hurts Traders
Traders can suffer substantial losses if:
-
The selected pair doesn’t exhibit a strong historical correlation
-
Unforeseen factors disrupt the typical relationship between the
chosen assets
This unfortunate outcome occurs when poorly matched correlated assets
deviate from their usual pattern, moving apart rather than converging. It
underscores the critical importance of careful pair selection in pairs
trading.
How Can Traders Choose Optimal Pairs?
|
Deciding Factors |
Explanation |
|
Historical Correlation |
Look for pairs with a strong and consistent historical |
|
Similar Market Reactions |
|
|
Continuous Monitoring |
|
Calculating the Spread and Entry Points
The “spread” is like the lead in the dance for pairs trading. It represents
the difference in prices between the two paired securities. Just as a lead
dancer guides the movements, the spread guides the trade decisions in pairs
trading.
Let’s have a closer look at its calculation through a hypothetical scenario.
-
Consider a pair of stocks, Company X and Company Y.
-
Their prices are $50 and $45 respectively.
-
To calculate the spread, subtract the price of one stock from the
other:-
Spread: Stock X price ($50) – Stock Y price ($45) = $5
-
This spread of $5 represents the deviation from the historical relationship
between the paired stocks.
How to Spot Entry Points Via Spread Analysis?
In pairs trading, an entry point occurs when one stock stumbles (such as
experiencing a price decline) while the other doesn’t. Let’s assume in the
above example, Stock X stumbles, dropping to $48, but Stock Y remains steady
at $45. This fluctuation causes the spread to widen. The revised spread
would be calculated as follows: Stock X price ($48) – Stock Y price ($45) =
$3. This divergence in spread value is a potential entry point for pairs
trading.
Trading Opportunity
This widening of the spread indicates an opportunity for pairs traders.
Their primary aim is to profit from the expected reversion of the spread
back to its historical average. In such a case, most traders would resort to
the following strategy:
|
Position |
Action |
|
|
Stock X |
Long |
Buying |
|
Stock Y |
Short |
Selling |
Managing Risk and Exit Strategies
You can think of the market as a tempestuous sea, subject to constant
changes and unpredictability. Even the most robust pairs in pairs trading
can fall out of sync due to unforeseen events or shifts in market dynamics.
This falling out creates the need for concrete risk management strategies,
such as:
-
Setting Stop-Loss Orders:
-
Implementing stop-loss orders helps in limiting potential trade
losses. -
If the trade moves unfavorably, these orders automatically close
the position at a predetermined price point. -
For instance, a trader can set a stop-loss order if the spread
widens beyond a certain threshold.
-
-
Position Sizing:
-
Managing the size of positions taken in each stock within the
pair is essential. -
By allocating an appropriate portion of the overall portfolio to
each trade, traders can control risk exposure.
-
Let’s highlight the importance of risk management and forming appropriate
exit strategies through some hypothetical stories of trades gone south:
The Event
-
Consider a pair of stocks, Company A and Company B.
-
Both maintain a historically strong correlation.
-
A trader enters a pairs trade when the spread widens due to
unexpected market volatility. -
Committed to risk management, the trader sets a stop-loss order.
The Break
-
Instead of reverting as anticipated, the stocks continue to move
further apart. -
The trader sensed a break in their usual correlation.
The Saving Exit Strategy
-
As the spread widens beyond a predetermined threshold, the stop-loss
order automatically triggers. -
The position gets closed to limit further losses.
The Result
While the trade ultimately results in a loss, owing to the unforeseen
divergence between the paired stocks, the trader’s unwavering adherence to a
disciplined exit strategy serves as a safeguard against more substantial
losses. This narrative underscores the paramount importance of risk
management and the implementation of well-considered exit strategies in
pairs trading.
Grasp a Better Chance at Success in Pairs Trading with Modern Tools

The usage of modern tools, like Bookmap, helps traders to:
-
Gain a deeper understanding of correlations
-
Accurately identify optimal entry and exit zones
Bookmap offers a host of features such as Market Pulse, Heatmaps, and Volume
Dots that offer a comprehensive and integrated solution for pairs trading.
Let’s understand it further.
Leveraging Bookmap for Pairs Trading Analysis
|
What are Bookmap’s Modern Features? |
What Do They Do? |
How Do Traders Use Them? |
|
It eliminates the need to switch between multiple |
Traders can view correlations directly on their trading
|
|
|
Market Pulse Widget Specifics |
It presents correlations visually and in real time. |
Traders swiftly assess the strength and changes in |
|
Utilizing Heatmap Visualization and Volume Dots |
By combining Bookmap’s heatmap visualization with the |
Traders analyze the intensity of trading activity at |
The Role of Algorithmic and Automated Trading
Back in the day, trading floors were filled with traders shouting orders and
frantically gesturing. Trading was human-driven and characterized by high
emotion and energy. In stark contrast, the present trading is silent. The
buzz of human activity has been completely replaced by the quiet efficiency
of algorithm-driven trading.
How Important are Algorithms?
Algorithms function as the unsung heroes of modern trading. They tirelessly
work in the background and:
-
Analyze vast amounts of data
-
Scan numerous stock pairs
-
Quickly identify potential opportunities based on predefined
parameters.
Operating with unparalleled speed and efficiency, algorithms execute trades
in milliseconds, far quicker and often more accurately than human traders.
Manual vs. Automated Trading for Pairs Trading
There’s an ongoing debate regarding manual versus automated trading for
pairs trading strategies. Let’s shed some light on it:
|
Trading Type |
Meaning |
Comparative Benefit |
|
Manual Trading |
Manual trading relies on humans:
|
Traders possess the flexibility to adapt to changing |
|
Automated Trading |
Algorithms in automated trading follow predefined rules |
Algorithms excel in speed, can handle vast amounts of |
The Synergy of Manual and Automated Approaches
The debate between manual and automated trading for pairs trading doesn’t
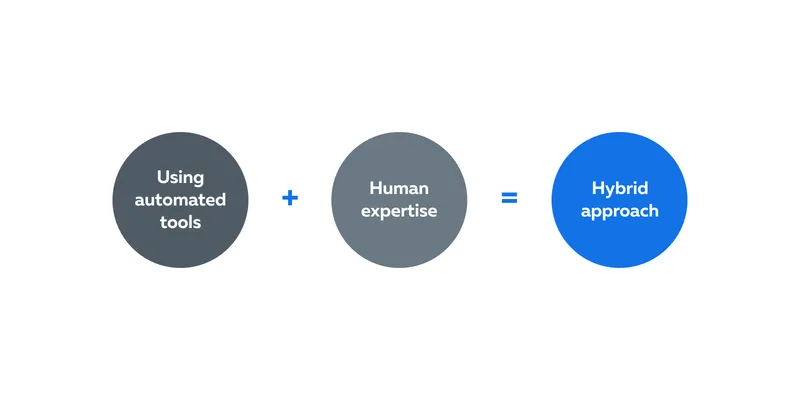
necessarily need to be an “either/or” scenario. There’s a growing trend
toward a hybrid approach, in which traders combine the strengths of both
methods.

Traders often use automated tools for data analysis, pattern recognition,
and trade execution. At the same time, they apply their human expertise to
oversee and interpret the broader market context.
Conclusion
Pairs trading represents a trading strategy in which two correlated assets
are identified. Emphasis is laid upon historical data to establish the
correlation. However, this strategy isn’t foolproof and can fail due to
unforeseen events or changes in investor sentiments.
This vulnerability creates the need for a robust exit strategy.
Additionally, the usage of advanced market analysis tools like Bookmap,
allows traders to quickly assess the strengths and changes in correlation.
Pairing these advanced tools with a strong foundation of knowledge helps
traders to thrive in the world of pairs trading. Looking to deepen your
understanding of market dynamics?
Dive into the intricate world of market correlations, their significance,
and their direct influence on trading decisions.
Discover how market correlations impact your trading journey with our
in-depth guide!