4th of July Sale
50% Off Bookmap Global+, Data & Add-Ons
Save on Global+, market data, and add-ons from July 3–13.
Education
July 18, 2024
SHARE
Prisoner’s Dilemma and Trading: Cooperation vs. Competition in Financial Markets

Trading in financial markets is like solving a complex puzzle. It encompasses strategies, risks, and decision-making. One useful way to put these pieces together is through the lens of the Prisoner’s Dilemma, a classic concept from game theory.
It explains the choices traders face: whether to cooperate by following market trends or to compete by going against them. In trading contexts, cooperation among traders leads to stable prices and reduced volatility. Conversely, competition drives market efficiency but can also increase risks and potential for manipulation.
By using advanced market analysis tools, traders can gain valuable visual analytics. The “heatmaps” and “volume data” allow traders to observe collective market actions, identify trends, and spot opportunities for both cooperative and competitive strategies.
Let’s understand how the Prisoner’s Dilemma can help traders develop more informed strategies.
What is the Prisoner’s Dilemma in Trading Contexts?
To understand the term “prisoner’s dilemma” better from a trading point of view, let’s first understand what it means in game theory. The prisoner’s dilemma shows a conflict between:
- Individual rationality
and
- Collective rationality.
In its classical form,
- It involves two individuals.
- Both are suspected of committing a crime.
- They are held in separate cells.
- Both are offered a deal.
- If one confesses and implicates the other by confessing, they receive a reduced sentence, while the other receives a harsher one.
- If both confess, they both receive moderate sentences.
- However, if neither confesses, they both receive light sentences due to lack of evidence.
Now coming to the context of trading, this Prisoner’s Dilemma can be applied to situations where traders must decide whether to cooperate or defect with others in the market.
| Co-operate (similar to not confessing) with others in the market | Defect (similar to confessing) with others in the market |
| It involves following a trend or adhering to established market norms. | It involves trading against the trend or exploiting market inefficiencies. |
Whether to cooperate or defect, is usually influenced by various factors:
- Individual Rationality vs. Collective Rationality
-
- Just like in the classical form, the prisoner’s dilemma for traders involves a conflict between:
- What is individually advantageous (defecting)?
- Just like in the classical form, the prisoner’s dilemma for traders involves a conflict between:
and
- What is collectively beneficial (cooperating)?
- For example, say for an individual trader,
- Trading against the trend can yield short-term gains.
- Collectively following the trend can lead to better overall market stability and profitability.
- Risk and Reward
-
- Traders weigh the potential risks and rewards while making decisions.
- Cooperating with the trend offers:
- A more predictable outcome
with
- Potentially lower gains.
- On the other hand, defecting and trading against the trend results in higher returns but also greater risk.
- Information Asymmetry
-
-
- Traders have different levels of information or interpretations of market conditions.
-
- This differentiation leads to varied decisions regarding cooperation or defection.
-
- Some may have insights indicating a trend reversal, while others may perceive the trend differently and choose to cooperate.
Cooperation vs. Competition in Financial Markets

Traders must note that both cooperation and competition play crucial roles in the financial markets. Each contributes to market stability and efficiency in different ways. Let’s understand in detail:
How does cooperation impact the financial markets?
- Stabilizing Prices
-
- When market participants cooperate by following established norms and trends, it leads to price stabilization.
- For example
- Say most traders cooperate by buying into an upward trend.
- This collective effort reinforces the trend and helps stabilize prices.
- This stabilization benefits all the market participants by:
- Reducing uncertainty
and
- Promoting confidence in the market.
- Reducing Volatility
-
- Cooperation among traders reduces volatility by smoothing out price movements.
- Cooperation also mitigates:
- Panic selling
and
- Panic buying.
-
- This usually happens when traders cooperate by:
- This usually happens when traders cooperate by:
- Collectively absorbing shocks
or
- Adjusting their positions in response to market events.
- Market Integrity
-
-
- Cooperation among market participants maintains market integrity.
- This usually happens when traders adhere to regulations and ethical standards.
- Further, this kind of cooperation:
-
- Creates trust among investors
and
- Ensures the proper functioning of financial markets.
How does competition impact the financial markets?
- Market Efficiency
-
- Traders must note that competition among market participants is a driving force behind market efficiency.
- Competition leads to fair pricing when:
- Traders compete to exploit market inefficiencies
or
- Seek out arbitrage opportunities.
- This situation ensures that prices reflect all available information accurately.
- Innovation and Adaptation
-
-
- Competition promotes innovation.
- This happens because market participants continually strive to gain a competitive edge by developing new:
- Strategies,
- Products, and
- Technologies.
-
- This development evolves the financial markets.
-
- Also, the new instruments and techniques enhance market efficiency and liquidity.
- Risk and Manipulation
-
- On the negative side, competition introduces risks and vulnerabilities to financial markets.
- Intense competition promotes unethical behavior, such as:
- Market manipulation,
- Insider trading, and
- Spoofing.
- Some participants seek to gain an unfair advantage over others.
- This situation undermines market integrity and erodes investor confidence.
- Consequently, the market gets destabilized.
Visualizing Game Theory in Action with Bookmap

Bookmap is an advanced market analysis tool. It provides traders with modern visualization tools to analyze market dynamics in real-time. Traders often use Bookmap’s heatmap and volume tools to check out:
- How the Prisoner’s Dilemma is unfolding in the market?
- How the traders are operating collectively?
- What kind of strategy is getting followed in the market – cooperative or competitive?
Let’s understand the practical usage of both these modern tools in detail.
How Bookmap’s heatmap helps traders
| Benefits | Explanation |
| Order Flow Visualization |
and
|
| Identifying Cooperative Strategies |
|
| Detecting Competitive Tactics |
|
How does Bookmap’s volume tools benefit traders?
- Volume Profile
-
- Bookmap’s volume profile presents the volume of trade executed at each price level over a specified period.
- Its analysis shows levels where significant buying or selling activity occurred.
- Most traders analyze volume clusters to identify areas of:
- Accumulation
or
- Distribution.
- Market Depth
-
- Traders can analyze market depth data provided by Bookmap to assess the level of liquidity available at various price levels.
- Traders can understand major sentiment shifts by analyzing changes in market depth, such as:
- A sudden increase in buy orders
or
- A large sell order entering the market.
How can you identify collective trader behavior?
| Pattern Recognition | Sentiment Analysis |
|
or
or
|
Strategic Application of Prisoner’s Dilemma in Trading
By understanding the Prisoner’s Dilemma, traders can better formulate strategies that effectively balance cooperation and competition.
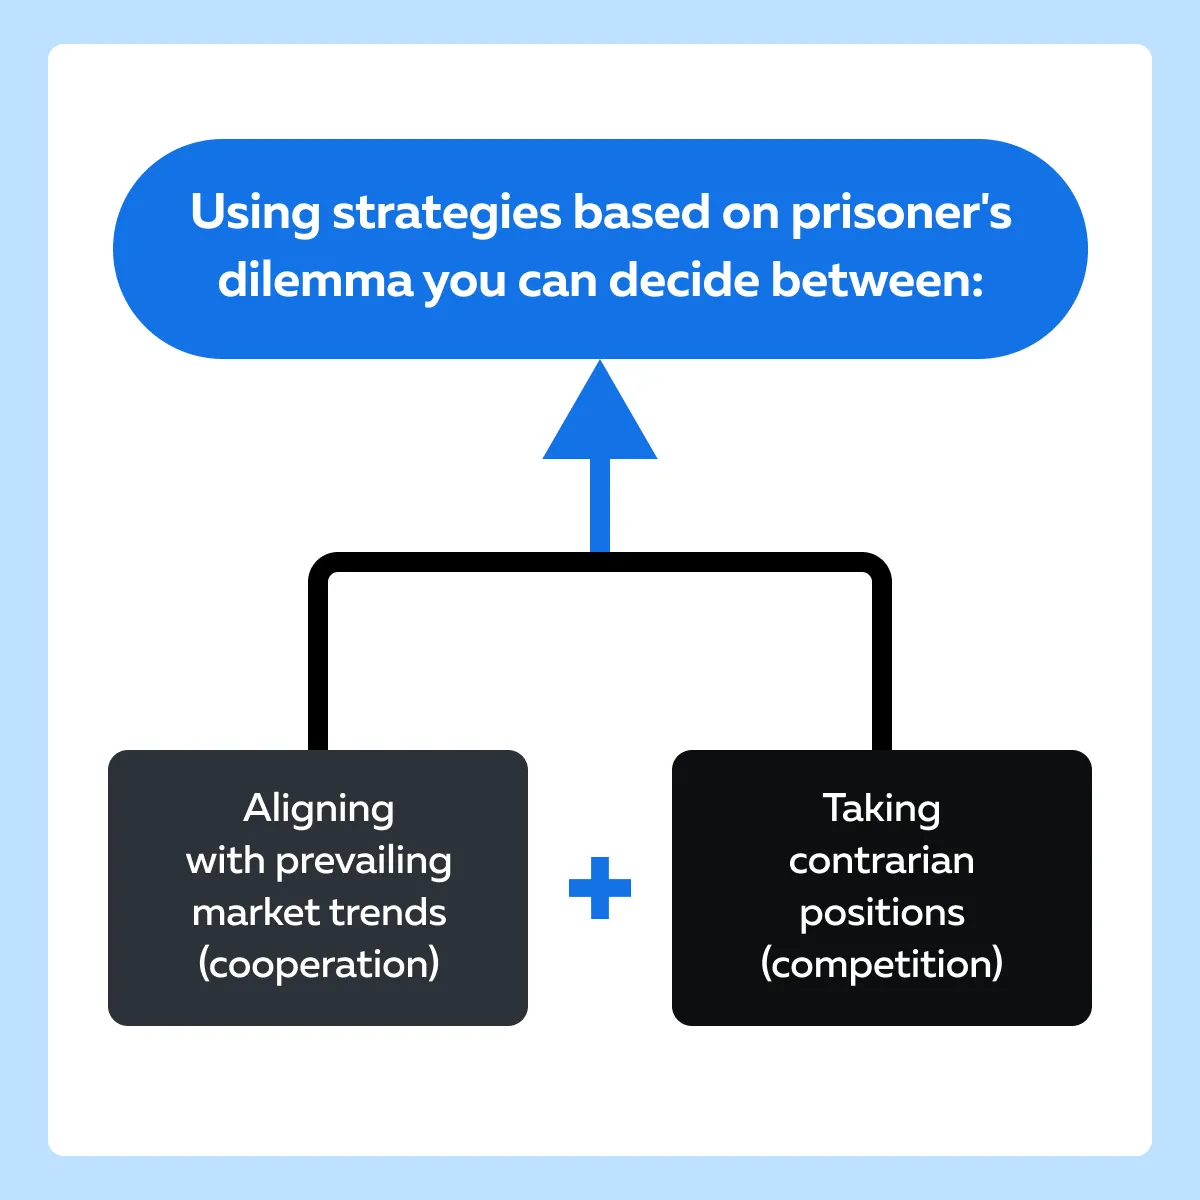
How do you gain a strategic edge?
By formulating strategies based on cooperative vs. competitive interactions, you can better recognize market sentiment. See how:
| Cooperative Behavior | Competitive Behavior |
|
|
Some Popular Strategies Based on Prisoner’s Dilemma
Strategy I: Contrarian Approaches
- Contrarian traders “defect” by selling when the majority are buying.
- This strategy is based on the understanding that excessive cooperation (overbuying) can lead to:
- Overvalued prices
and
- An eventual correction.
- By assessing market sentiment, contrarians can identify overbought conditions.
- They can prepare themselves to sell or short the asset.
How can you implement this strategy?
You can implement contrarian approaches by using tools like Bookmap. To do so, you must observe order flow and volume spikes as they are indicative of market activities. Take a contrarian position (defect) when:
- Market sentiment appears overly optimistic
and
- Liquidity becomes thin at higher prices.
Strategy II: Trend-Following Strategies
- Trend-following traders “cooperate” with the prevailing market direction.
- They purchase assets in an uptrend and initiate sales in a downtrend.
- This strategy is based on the momentum generated by collective trader behavior.
How can you implement this strategy?
You must analyze heatmaps and volume profiles on platforms like Bookmap. This analysis will help you identify strong trends. You can confidently enter long positions when:
- Substantial buying interest is evident
and
- Prices move steadily upward with robust support.
Conversely, you can “short” when you observe a downtrend supported by consistent selling pressure. Further, assessing market sentiment and trader behavior is crucial for deciding trading strategies. It helps traders in:
- Aligning their actions with prevailing trends
or
- Identifying opportunities for contrarian moves.
Some Important Scenarios Based on Market Participant Analysis
To understand the concept better, let’s study some scenarios where traders chose different strategies based on their analysis of other market participants’ likely actions:
Scenario 1: Competitive Strategy – Anticipating a Major Sell-off
The market situation
- Assume a stock has experienced a prolonged uptrend.
- The prices are steadily increasing over several weeks.
- A trader notices signs of weakening momentum, such as:
- Decreasing buy volumes
and
- A higher frequency of large sell orders appearing in the order book.
The trader’s decision
- The trader anticipates a major sell-off.
- They decide to “defect” by setting up short positions.
The trader’s three-fold analysis.
| Market Sentiment | Order Flow and Volume Tools | Probability Assessment |
Despite the uptrend, the trader observes bearish signals like:
|
|
The trader calculates the probability of a reversal based on:
and
|
The trader’s action
- The trader enters short positions just below the resistance levels.
- They expect that once the selling begins, other traders will follow.
- This collective effort will drive the price down rapidly.
The benefit
- The trader acted on the early signals.
- They gained a competitive edge by positioning themselves to profit from the anticipated decline.
Scenario 2: Cooperative Strategy – Responding to a Positive Earnings Announcement
The market situation
- Say a company releases a highly positive earnings report.
- The report exceeds market expectations.
- Immediately after the announcement, there is:
- A visible surge in buy orders
and
- Increased trading volume.
The trader’s decision
- The trader decides to “cooperate”.
- They buy the stock early.
- This way, the trader capitalizes on the collective positive sentiment.
The trader’s three-fold analysis
| Market Sentiment | Order Flow and Volume Tools | Behavioral Assessment |
|
|
|
The trader’s action
- The trader places buy orders immediately after the earnings announcement.
- They align with the cooperative behavior of other market participants.
- By entering early, the trader takes advantage of the:
- Initial surge
and
- Likely a continuation of the uptrend.
- By doing so, the trader rides the wave of collective buying.
What can we infer from both scenarios?
| Competitive Strategy (first scenario) | Cooperative Strategy (second scenario) |
|
|
Enhancing Market Strategy with Visual Analytics

By using advanced market analysis tools like Bookmap, traders gain powerful visual analytics tools, which enable them to assess real-time:
- Market sentiment
and
- Behavior.
This assessment helps traders develop strategies based on hypothetical scenarios derived from the Prisoner’s Dilemma, such as anticipating market reactions to:
- News events
or
- Economic data releases.
How can traders use Bookmap to visualize market sentiment and trader behavior in real time?
Let’s understand through different scenarios:
Scenario I: Following a market dip, Bookmap visualizations show a sudden surge in buy orders
- An increase in buying interest indicates a cooperative response from traders
- These traders believe the asset is undervalued
- They are collectively acting to “buy the dip”
Recognizing this cooperative behavior, a trader decides to enter long positions. They anticipate that the collective buying will drive the price back up.
- The trader uses a heatmap.
- It shows increased liquidity at lower price levels.
- There is a concentration of buy orders that brighten the heatmap.
- Volume bars at these levels indicate significant buying activity.
Based on these signals, the trader places buy orders at or slightly above the current price. Their primary goal is to capitalize on the expected upward momentum.
Scenario II: Detecting Competitive Market Tactics
- After a prolonged uptrend, Bookmap shows large sell orders.
- This appearance suggests potential profit-taking or shorting.
- Also, this pattern indicates a competitive move by some traders to:
- Lock in gains
or
- Bet against the trend.
- The trader anticipates a possible reversal.
- They set up short positions or sell holdings to avoid losses.
How can traders perform scenario-based planning for market reactions?
Traders can enhance their strategies by using scenario-based planning to anticipate market reactions. Visualization tools like Bookmap play a crucial role in this process. They provide real-time insights into:
- Market sentiment
and
- Trader behavior.
Let’s see how:
- Identifying Market Sentiment Before News Events
-
- Before a major news event or data release, traders can observe:
- Order flow
- Before a major news event or data release, traders can observe:
and
- Liquidity levels.
- This will help in gauging market expectations.
- Bookmap’s heatmap and volume tools show where significant buy or sell orders are concentrated.
- This helps traders understand whether the market is preparing for a:
- Bullish (cooperative)
or
- Bearish (competitive) reaction.
- Reacting to News Events
- Immediately following a news release, traders need to quickly assess market reactions to decide on their strategy.
- Bookmap provides real-time data on how buy and sell orders shift.
- This data allows traders to see whether the initial market reaction is:
- Cooperative (following the trend)
or
- Competitive (creating a reversal).
- Planning for Competitive Reactions
- Traders must note that all news events do not lead to straightforward trends.
- Some can even cause competitive behavior.
- In them, traders usually look to:
- Take profits
or
- Reverse positions.
- The Bookmap highlights large sell orders or increased selling pressure at resistance levels.
- This gives a signal of a potential reversal
How Implications of Cooperation vs. Competition Vary Based on Trading Horizons
The impact of cooperative and competitive trading strategies varies significantly depending on the trader’s time horizon. Tools like Bookmap help visualize these differences. They aid traders in making informed decisions tailored to their:
- Specific trading styles
and
- Risk management approaches.
Using Bookmap in Long-Term Cooperative Trends
- Long-term trends often show sustained price movements.
- These movements are supported by consistent buying or selling pressure.
- These trends reflect a broad consensus among market participants.
- This consensus indicates a cooperative environment.
Visualization with Bookmap
| Heatmaps | Volume Profiles |
and
|
|
How do traders use visualization to make strategies?
- Entry Strategies
-
-
- Traders might enter positions at identified support levels where buy interest is consistently strong.
-
- Risk Management
-
-
- Traders place wider stop-loss levels.
- This placement helps in accommodating short-term fluctuations.
-
- Exit Strategies
-
- Traders exit positions gradually.
- They do so when prices approach long-term resistance levels.
- They often use trailing stops to lock in profits while capturing further gains.
Using Bookmap in Short-Term Competitive Spikes
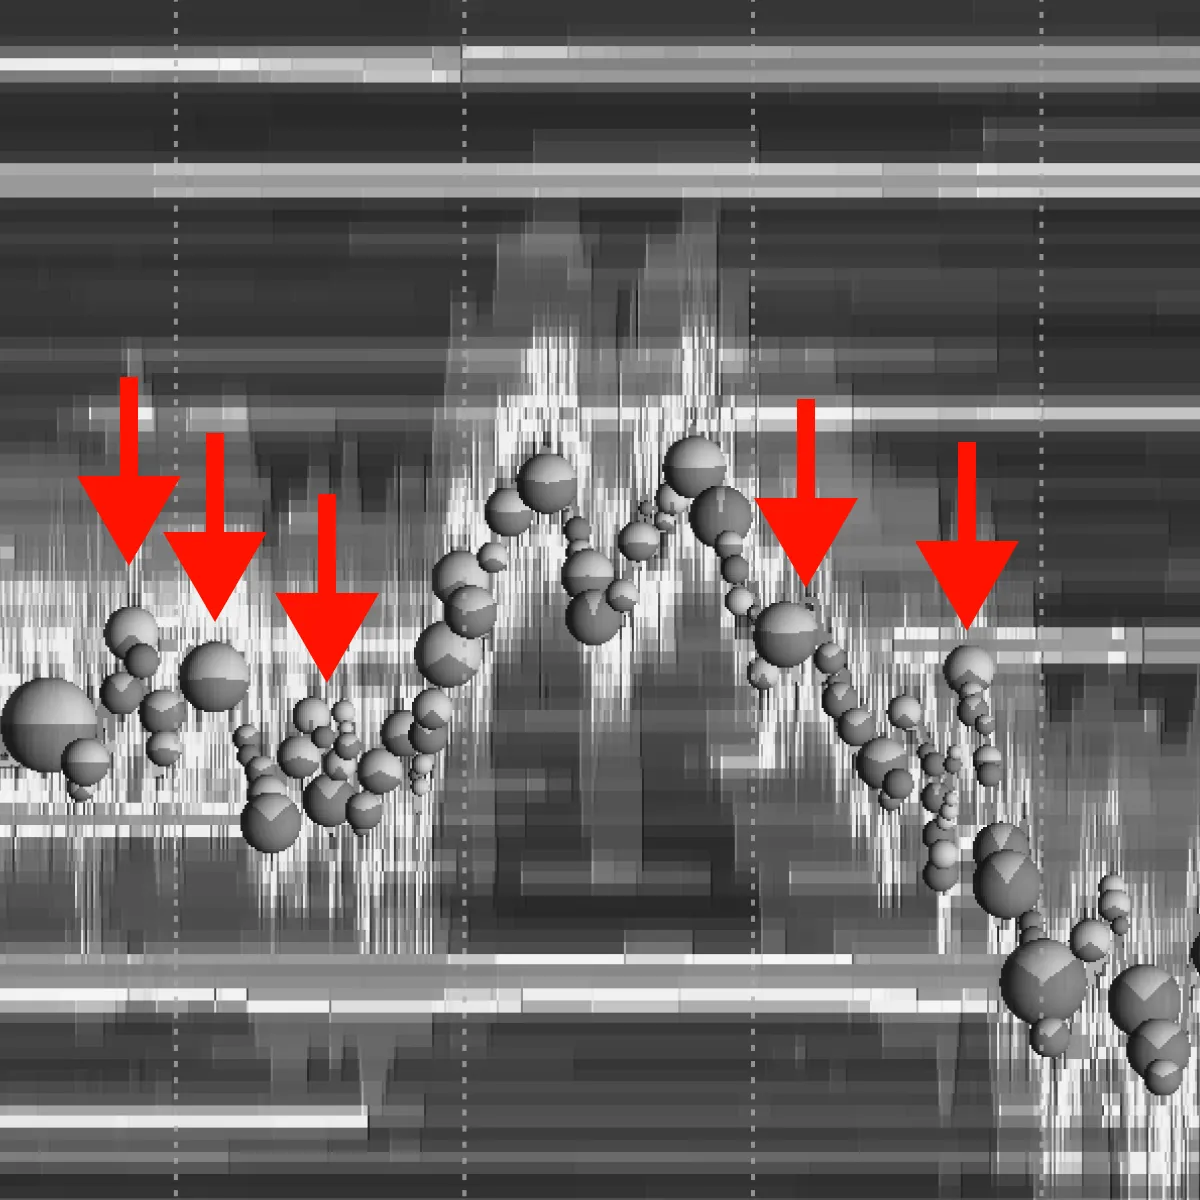
- Short-term competitive spikes are characterized by rapid price movements.
- These movements are driven by sudden influxes of buy or sell orders.
- They often occur due to:
- News events,
- Economic data releases, and
- Large institutional trades.
Visualization with Bookmap
| Order Flow | Volume Bubbles |
|
|
How do traders use visualization to make strategies?
- Entry Strategies
-
- Traders enter quickly.
- They capitalize on the momentum of the spike.
- They either:
- Join the move (cooperative in the short term)
nor
- Bet against it (competitive, anticipating a reversal).
- Risk Management
-
-
- Traders place tight stop-loss levels.
- This placement helps protect against rapid reversals and high volatility.
-
- Exit Strategies
-
- Traders prefer quick profit-taking.
- It is essential to avoid getting caught in subsequent reversals.
How Bookmap Visualizes Long-Term Trend Stability and Short-Term Volatility
| Aspects | Long-Term Trend Stability | Short-Term Volatility |
| Visualization |
|
|
| Strategic Adjustments |
|
|
Conclusion
By understanding the Prisoner’s Dilemma, traders can gain valuable market insights and better understand the other trader’s behavior. Being a classic game theory, it shows the choices that traders face between cooperation and competition. In trading, cooperation can lead to stable trends and mutual benefits, while competition can drive market efficiency but may also introduce volatility and risk.
Using Bookmap, traders can visualize these dynamics in real time. Bookmap’s heatmap and volume tools are instrumental in discerning whether traders are acting cooperatively by following trends or competitively by reversing trends. This visualization aid helps in deciding entry and exit points. Interested in learning more about the intersection of gaming and trading? Check out this blog article here.
Sign Up Now