See soft landing more clearly in real time.
Compare plans to access deeper market visibility for soft landing.
Education
May 6, 2025
SHARE
Recession, Soft Landing, or Boom? The Market’s Next Big Move Could Surprise You

As we approach 2025, traders and investors are asking the big question: Will we see a recession, a soft landing, or an unexpected boom? The answer lies in key economic indicators, market trends, and Federal Reserve policies on inflation and interest rates.
So, how can you anticipate a likely market move? In this article, we’ll understand the possible market outcomes and how traders can prepare for each scenario. You’ll see how to track GDP growth, the job market, and credit conditions. Plus, you will learn why real-time order flow is crucial for spotting major moves before they hit the headlines.
Read this article till the end to gain the insights you need to deal with the stock market forecast for 2025 with confidence.
Three Possible Market Outcomes: Recession, Soft Landing, or Boom?
The current economy is sending mixed signals. Yes, some signs point to slower growth, while others show strength. Currently, the big question is, what will happen next? Will there be a recession, a soft landing, or even a boom?
The Federal Reserve’s decisions on interest rates will play a huge role in the direction the economy takes. Also, by looking at past market cycles, we can understand what might come next. Let’s study these three possible scenarios and what they mean for the economic outlook in 2025:
Scenario 1: A Full Recession – Are We Already in One?
A recession occurs when the economy slows down for a long time. Check out the graphic below to see its key warning signs:

During a recession, people and businesses tend to cut back on spending because banks usually tighten lending, making it harder to get loans. Historically, stock markets typically take a downturn when recessions hit.
That said, some sectors tend to hold up better. Commonly, these include the following:
- Utilities,
- Consumer staples, and
- Gold.
They often perform well because people still need essentials, no matter how bad the economy gets. Besides, gold is traditionally a safe-haven asset for investors during economic uncertainty. Investors also move their money into bonds and commodities as safer alternatives.
For you as a trader, these key indicators of a full-blown recession are noteworthy:
and
- A sudden lack of liquidity in major stocks.
During such times, major investors shift their money into safer assets. You can easily track their movements using our market analysis tool, Bookmap. Be aware that the overall economic outlook for 2025 will depend on whether these warning signs continue to build.
Scenario 2: A Soft Landing – Can the Fed Pull It Off?

A soft landing happens when the Federal Reserve slows inflation without causing a major recession. This move allows the economy to cool off just enough to control rising prices! In such a scenario:
- GDP growth stays positive,
and
- Unemployment remains low.
There have been multiple occasions when central banks successfully managed this balance, avoiding a severe downturn. If the Fed achieves this, specific sectors will benefit. These are:
| Aspects | Growth stocks | Consumer discretionary stocks |
| Meaning | Growth stocks, especially in AI and tech, can do well when interest rates are stable. | Consumer discretionary stocks like Nike and Amazon could also gain. |
| Reason for rise | These companies rely on steady borrowing costs. | People feel confident enough to keep spending. |
As a trader, you can interpret the following as the key signs of a soft landing:
- Flattening bond yields, which suggests interest rates are stabilizing,
and
- A shift in order flow toward risk-on assets indicates increased investor confidence and willingness to take on more risk.
Using Bookmap’s liquidity indicators, you can easily track these trends. Remember that if the economic outlook for 2025 remains steady, markets could see moderate but stable growth. Prepare for 2025’s economic uncertainty with real-time volume and order flow analysis on Bookmap.
Scenario 3: The Market Boom – Could It Happen?

A market boom could happen if:
- The Federal Reserve cuts interest rates earlier than expected,
or
- The economy grows faster than predicted.
Please note that if businesses and consumers stay strong despite previous worries, the economic outlook for 2025 could turn unexpectedly positive.
One major factor this hinges on is the trillions of sidelined cash waiting to be deployed. If investors feel confident, this money could be reinvested in stocks, triggering a major price rally.
In this scenario, the following sectors would benefit the most:
- High-beta tech stocks, like AI and semiconductor companies, thrive in fast-growing markets.
- Crypto assets and speculative growth stocks (as risk appetite increases)
- Small-cap stocks, which have underperformed, could see significant gains if confidence returns.
As a trader, you should watch for key signals of a boom. A major clue is the massive buy-side liquidity appearing on Bookmap’s heatmap. It shows that big investors are accumulating stocks. Also, breakouts in leading economic indicators (like housing starts and industrial production) could confirm a strengthening economy. If these trends play out, market trends 2025 could shift toward a strong bull run.
Key Economic Indicators to Watch in 2025
To understand where the economy is heading, you should monitor specific key indicators. The signals below can help you determine whether we’re heading for a recession, a soft landing, or even a market boom:
1. GDP Growth Rate
GDP (Gross Domestic Product) measures the total economic output. If GDP growth slows down, it could hint at a looming recession.
Please note that a stable GDP suggests a soft landing, meaning the economy cools without crashing. If the GDP rises strongly, it may signal a boom with:
- Strong corporate profits,
and
- Higher stock prices.
2. Inflation Data (CPI/PPI)
Inflation affects how the Federal Reserve sets interest rates. Check the graphic below to know how it is measured:

The Fed may keep rates elevated if inflation stays high, making borrowing expensive. But if inflation drops, the Fed may consider rate cuts, boosting market trends in 2025.
3. Job Market (NFP, Unemployment Rate)
The job market is a major signal of economic health. Non-Farm Payrolls (NFP) measure monthly job gains, while the unemployment rate tracks job losses.
If layoffs rise, it’s a sign of a recession. But if hiring remains steady, it suggests a soft landing. Strong job growth can fuel consumer spending and support a market boom.
4. Yield Curve Inversions
The yield curve shows the difference between short-term and long-term bond yields. When short-term bonds pay higher interest rates than long-term ones, it’s termed an inversion, a historic warning of recessions.
Remember that a deep yield curve inversion in 2025 would forecast trouble for the stock market. It will suggest investors are expecting a downturn.
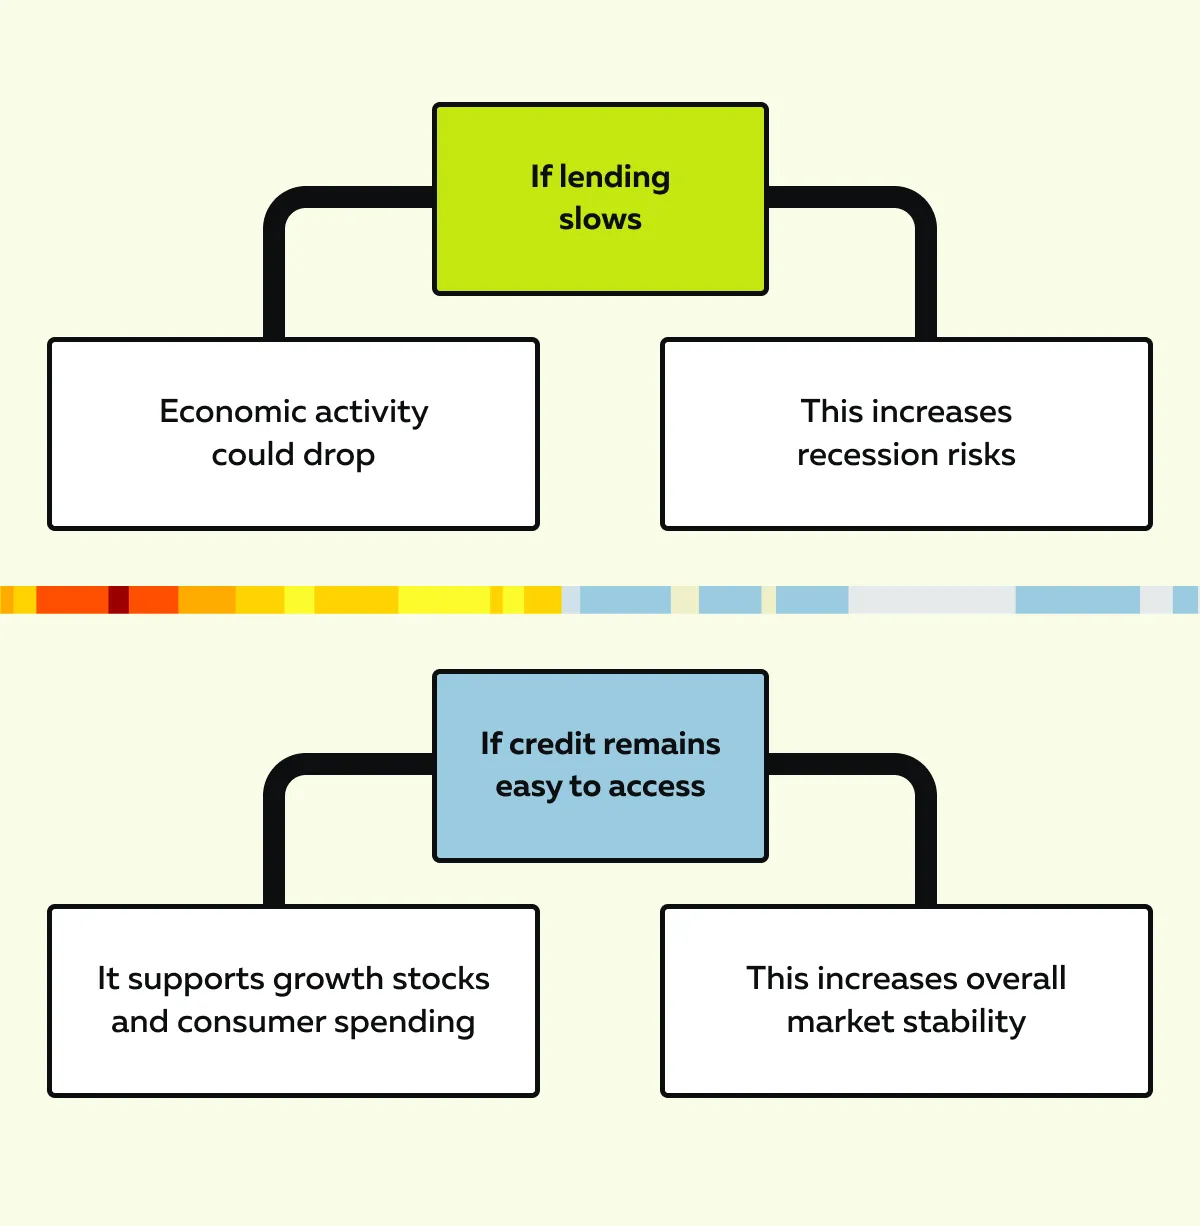
5. Credit Markets
Banks and lenders play a key role in economic growth. If credit markets tighten, it could be a warning sign of economic stress. That’s because businesses and consumers rely on loans to expand and spend. Let’s learn through the graphic below and see how it operates:
By tracking these economic indicators, you can get a clearer picture of where the economy is headed and how you can position your investments as per 2025’s market trends. Stay ahead of market sentiment by using Bookmap’s order flow tools to analyze institutional buying and selling patterns.
How Traders Can Position Themselves for Any Scenario
The economic outlook for 2025 is still uncertain. However, you, as a trader, can prepare by adjusting your strategies based on different possible outcomes:
- Recession,
- Soft landing,
and
- Market boom.
Each scenario requires a different approach to managing risk and finding opportunities in the stock market forecast. Let’s see how:
- Recession: Defensive Positions & Safe-Haven Assets
If the economy weakens:
- GDP growth slows,
and
- Unemployment rises.
The contraction in GDP and employment creates a recession. In this case, you should focus on defensive sectors and assets that hold value during downturns:
| Defensive stocks | Safe-haven assets |
|
|
Additionally, liquidity traps (stocks with low trading activity) should be avoided. That’s because they can be hard to sell in a downturn. You can also use options strategies like protective puts to hedge against falling prices.
- Soft Landing: Sector Rotation & Trend-Following
If the Federal Reserve manages to control inflation without causing a recession, the market could see moderate growth. In this case, you should focus on sector rotation. You should try to move money into industries that benefit from stable interest rates:
- Growth stocks, particularly in AI, technology, and semiconductors, often do well in this environment.
- Cyclical sectors, such as consumer discretionary (Nike, Amazon) and industrials, could also gain as spending remains steady.
Also, you can employ trend-following strategies, riding price momentum in strong-performing stocks. They can work well as long as market trends remain positive.
Additionally, look for bond yields flattening, where short and long-term interest rates are similar. That’s because it can signal stability and help risk assets perform better.
- Market Boom: High-Beta Momentum & Breakout Trading

Please note that a market boom could unfold if:
- Interest rates are cut earlier than expected,
or
- Economic growth accelerates.
If this happens, it would create strong upside potential for high-risk, high-reward trades. In such an environment, you can focus on high-beta stocks, like:
- Speculative tech,
- AI,
- Crypto, and
- Small-cap stocks.
When it comes to strategies, you can focus on both momentum trading and breakout trading. They are closely linked to high-beta stocks like AI, tech, and small caps. This is because they are more sensitive to market movements. Let’s understand the strategies in detail:
| Momentum trading | Breakout trading |
|
|
Both these strategies are ideal in high-volatility environments where high-beta stocks lead the charge. Additionally, you can utilize our real-time market analysis tool, Bookmap’s order flow indicators, to track where institutional money is flowing. Such activity usually signals profitable buying opportunities.
Why Tracking Real-Time Order Flow Is Critical?

In trading, understanding real-time order flow can give you a competitive edge. That’s because you can reveal market moves before they hit the news. You can predict market trends in 2025 by watching how large investors, also known as smart money, are positioned. This awareness will help you anticipate whether it’s a recession, a soft landing, or a boom.
1. Hidden Liquidity Can Signal Market Shifts Early
Price movements alone don’t tell the whole story. Sometimes, large institutions place hidden buy or sell orders that don’t immediately affect prices but signal future moves.
By tracking liquidity, you can spot major shifts before headlines confirm them. Let’s see:
- If liquidity suddenly dries up, it could indicate upcoming market volatility.
- If large buy orders appear despite recession fears, institutions may be preparing for a rally.
2. Use Bookmap’s Heatmap for Accumulation & Distribution Zones
Using Bookmap’s heatmap tool, you can see where big orders are sitting, revealing:

By analyzing these areas, you can better predict stock market trends and avoid getting caught on the wrong side of a trade.
For more clarity, let’s study an example:
- Let’s assume that news headlines report an incoming recession.
- As a result, retail investors panic and sell their stocks.
- However, real-time liquidity flows show institutions are buying instead of selling.
- Now, this could mean:
- Smart money expects a soft landing or a boom instead of a deep recession.
- The stock market forecast might not be as bad as it seems.
- Traders who follow the order flow on Bookmap position themselves for a potential rally before prices rise.
Thus, by using real-time order flow, you don’t have to wait for lagging economic data.
Conclusion
The economic outlook for 2025 is uncertain. The market is possibly heading toward a recession, a soft landing, or even a boom. As a trader, you must stay flexible and decide on strategies based on market trends and stock market forecasts. Instead of relying on news headlines, you should ideally track real-time order flow to see where the smart money is moving.
You can easily do so by using the tools at your disposal on our real-time market analysis tool, Bookmap. Its heatmap allows you to spot hidden liquidity, identify accumulation and distribution zones, and react to market shifts before they become apparent. Use Bookmap’s real-time market data to track shifts in liquidity as traders react to economic news.
Sign Up Now