See vix more clearly in real time.
Compare plans to access deeper market visibility for vix.
Education
July 18, 2024
SHARE
Visual Strategies for Trading Volatility Index (VIX) Movements
In the world of trading, the common adage we have often heard people saying is that financial markets are volatile. Market volatility is akin to sea winds that can either fill our sails or capsize our boats. So, the key to harnessing this powerful force lies in understanding and adeptly trading the Volatility Index (VIX), also known as the ‘fear index.’
Through this article, we will learn VIX trading strategies. Starting with the explanation of the Volatility Index, we will gradually explore factors that influence VIX fluctuations, from economic announcements to geopolitical events.
Through detailed examples and step-by-step setups, we will understand how to identify key levels, spot reversal patterns, and adjust position sizes based on VIX volatility levels. Additionally, we’ll see the importance of integrating comprehensive data visualization tools in understanding and trading market volatility. Let’s get started.
What is the Volatility Index (VIX)?
The Volatility Index (VIX) operates as a real-time market index that gauges the market’s projected volatility for the coming 30 days. This index was introduced by the Chicago Board Options Exchange (CBOE) in 1993. The VIX is often referred to as the “fear gauge” or “fear index” because it is a measure of:
- Market risk
and
- Investor sentiment.
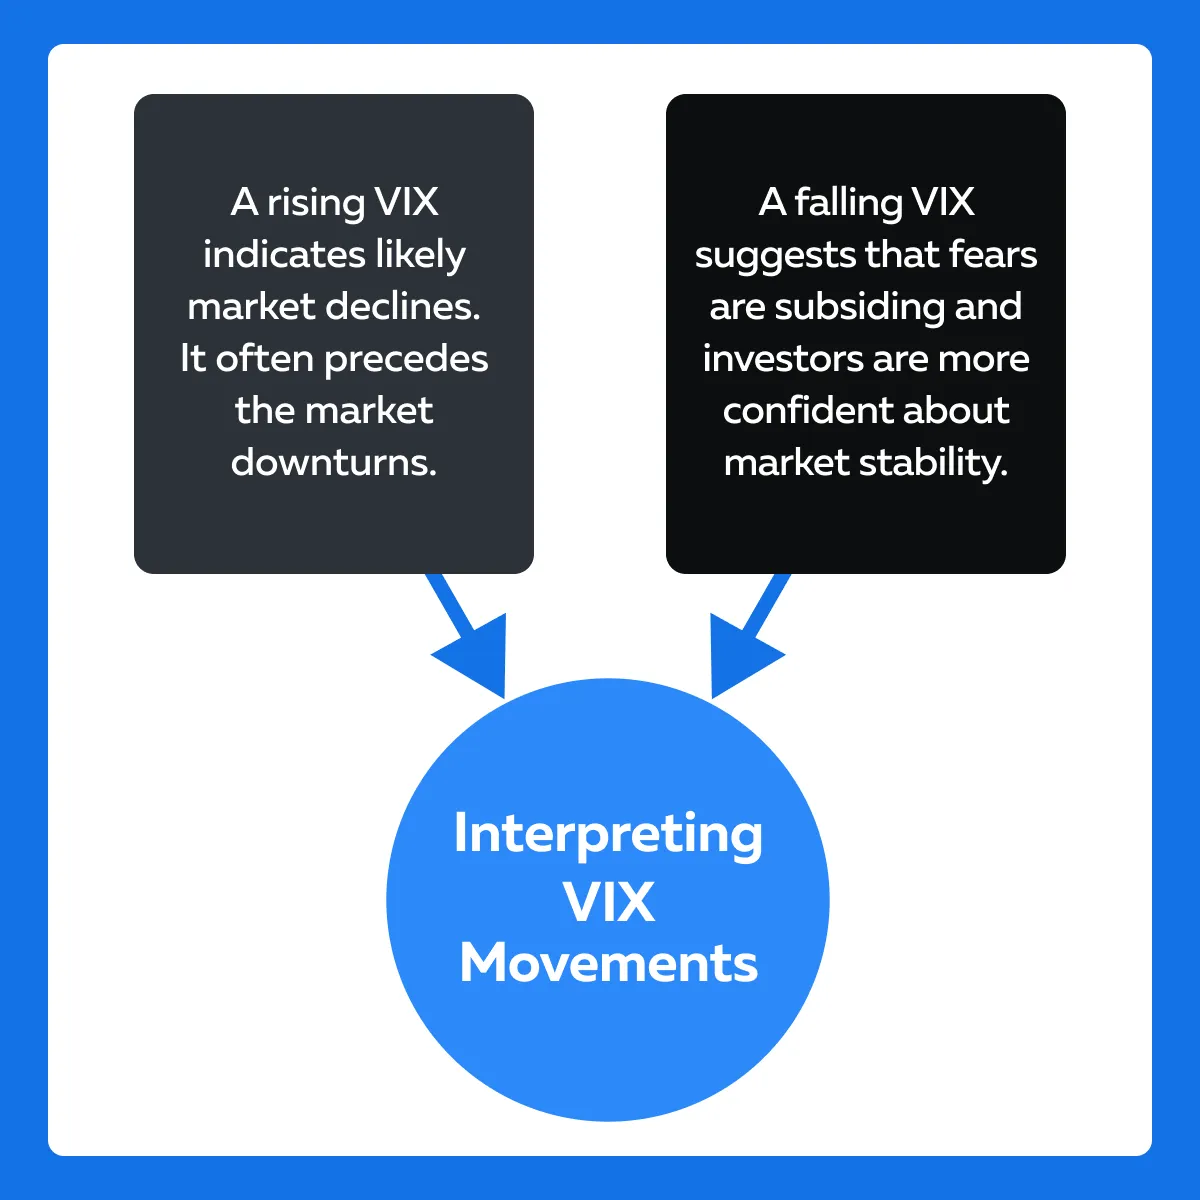
Interpreting VIX Movements
Have a look at the following chart to understand what a rising VIX and a falling VIX signify and their implications.
How does VIX help traders?
| VIX as a Tool to Measure Expected Volatility | VIX as an Indicator of Market Sentiment |
|
|
What are the different VIX Levels?
- During stable periods, the VIX usually hovers between 10 and 20.
- This range reflects moderate investor expectations for market movement.
- However, during periods of financial stress or economic uncertainty, the VIX spikes.
- For example,
- During the 2008 financial crisis,
- The VIX soared to over 80.
- It was caused by a widespread panic and uncertainty that had spread in the markets.
- Similarly, during the COVID-19 pandemic in early 2020,
- VIX reached around 82.7.
- This period also reflected extreme uncertainty and fear in the markets.
- During the 2008 financial crisis,
Understanding VIX Fluctuations
The VIX is influenced by a variety of factors. Usually, all these factors affect:
- Market sentiment
and
- Expectations of future volatility.
Let’s have a look at the top three drivers of VIX fluctuations:
Factor I: Economic Announcements
- Interest Rate Decisions
-
-
- Announcements from central banks about interest rate changes significantly impact the VIX.
- For example,
- An unexpected rate hike increases market uncertainty.
- It causes the VIX to rise.
-
- Employment Data
-
-
- Monthly reports, such as the U.S. non-farm payrolls can cause VIX fluctuations.
- Better-than-expected employment data lowers the VIX, while disappointing data can increase it.
-
- GDP Reports
-
- Economic growth figures usually influence market sentiment.
- Strong GDP growth reduces the VIX, whereas weak growth drives the VIX up.
Factor II: Geopolitical Events
- Wars and Conflicts
-
-
- Geopolitical tensions, such as military conflicts or terrorist attacks, lead to a spike in the VIX as investors react to increased global instability.
-
- Trade Disputes
-
- Trade tensions between major economies, such as the U.S.-China trade war, create uncertainty about future market conditions.
- These disputes increase the VIX levels.
Factor III: Market Sentiment Shifts
- Earnings Reports
-
-
- Corporate earnings announcements can trigger significant stock market movements.
- Disappointing earnings from major companies often cause a rise in the VIX.
-
- Financial Crises
-
-
- Periods of financial instability, such as the 2008 global financial crisis, are associated with substantial spikes in the VIX due to heightened fear and uncertainty.
-
- Market Corrections
-
- Sharp declines in the stock market often cause a surge in options trading as investors hedge investments to seek protection.
- This again drives up implied volatility and the VIX.
Some Notable VIX Spikes and Their Causes
| Event | Explanation | VIX Movement | Explanation |
| 2008 Financial Crisis | The collapse of Lehman Brothers and the ensuing global financial meltdown. | The VIX spiked to over 80 in October 2008 as panic spread across financial markets. |
|
| COVID-19 Pandemic (2020): | The rapid spread of COVID-19 and the implementation of global lockdowns | The VIX reached around 82.7 in March 2020 as markets reacted to the unprecedented economic shutdown and health crisis. |
|
| U.S.-China Trade War (2018): | Escalating trade tensions between the U.S. and China, including tariffs and retaliatory measures | The VIX saw multiple spikes throughout 2018 as news about trade negotiations and tariffs emerged. |
and
|
How to Visualize VIX for Effective Trading
Traders who visualize the Volatility Index (VIX) can better anticipate and respond to market changes. Advanced market analysis tools like Bookmap offer a dynamic and detailed view of VIX price movements. Using them, traders can gain valuable insights into:
- Market Activity
and
- Volatility.
Let’s See How You Can Use Bookmap’s Real-Time Heatmaps for Analysis
| Aspects | Traders Can Have a Dynamic View of Price Movements | Traders Can Easily Gauge Market Activity Using Colors |
| What to do? |
|
|
| How does it benefit traders? |
|
|
How can you customize Bookmap for VIX Trading?
Traders can customize Bookmap to set specific thresholds for volatility alerts based on VIX levels. For example,
- Say you want to get notified when the VIX surpasses a certain level indicating increased market fear or uncertainty.
- You can make this configuration in the Bookmap settings.
Additionally, you can even tailor these alerts as per your strategy. You can decide whether the alert is to:
- Make entry into the market,
- Exit positions,
or
- Adjust risk management practices.
Furthermore, Bookmap allows traders to overlay multiple data sources, such as:
- The VIX
and
- Correlated assets like S&P 500 index futures.
This simultaneous tracking enables traders to see how changes in the VIX are impacting related markets. By observing correlations, traders can make more informed decisions. For example,
- A spike in the VIX often corresponds with a drop in S&P 500 futures.
- This relationship shows rising market fear.
How Can You Set a 14-Day Moving Average (MA) and MACD for Effective VIX Tracking?
Let’s understand both the set-ups in detail:
- A) Setting up 14-Day Moving Average + VIX
- Step I: Set Up Your Charting Platform
- Use a charting platform that supports technical indicators such as Bookmap.
- Load the VIX index chart on your platform.
- Step II: Apply the 14-day Moving Average
- The 14-day MA helps smooth out the price data.
- It highlights the trend over approximately two weeks.
- Step III: Application:
- Locate the moving average indicator in your platform’s technical analysis tools.
- Set the period to 14 days.
- Apply the indicator to the VIX chart.
- Step IV: Interpretation
- The 14-day MA provides a baseline for understanding the general direction of the VIX.
- When the VIX is above the 14-day MA, it indicates a trend of increasing volatility.
- Conversely, when the VIX is below the 14-day MA, it indicates a trend of decreasing volatility.
- B) Setting up MACD + VIX
- Locate the MACD indicator in your platform’s technical analysis tools.
- Use the standard settings:
- 12-day EMA (Exponential Moving Average) for the short-term,
- 26-day EMA for the long-term, and
- 9-day EMA for the signal line.
- Apply the indicator to the VIX chart.
- The MACD line crossing above the signal line indicates an increase in volatility.
- The MACD line crossing below the signal line suggests a decrease in volatility.
Practical Strategies for Trading VIX
Traders must note that trading the VIX requires a deep understanding of market sentiment and volatility. By using enhanced visualization tools like Bookmap, traders identify trading opportunities easily. Let’s see how using some proven strategies:
Strategy I: Trading VIX Breakouts and Breakdowns
| Breakouts | Breakdowns |
|
|
How to set up and execute in Bookmap?
- Identify Key Levels
-
-
- Use Bookmap’s historical data and real-time heatmaps to identify resistance and support levels.
- These are areas where the VIX has previously reversed direction.
- Enhanced visualization helps pinpoint these levels with greater accuracy.
- That’s because it shows areas where heavy trading activity has occurred.
-
- Set Up Alerts
-
-
- Configure alerts in Bookmap for when the VIX approaches and breaks through identified resistance or support levels.
- Alerts can be set based on price levels or volume thresholds.
- This set-up ensures that traders are notified of significant movements.
-
- Confirm Movements
-
- Wait for a confirmed breakout or breakdown beyond the threshold levels.
- Confirmation can be achieved through:
- Sustained movement above or below the levels
and
- Increased trading volume.
- Enter the trade once the breakout or breakdown is confirmed.
- For breakouts, consider going long on VIX-related instruments, and
- For breakdowns, consider short positions.
- Exit Strategy
-
- Set predefined exit points.
- Alternatively, you can use trailing stops to lock in profits while managing risks.
- Monitor the heatmap for any signs of reversal, such as decreasing volume at the new levels.
- These signs indicate a false breakout or breakdown.
Strategy II: Spotting Classic Reversal Patterns
See the graphic below to understand some common patterns:
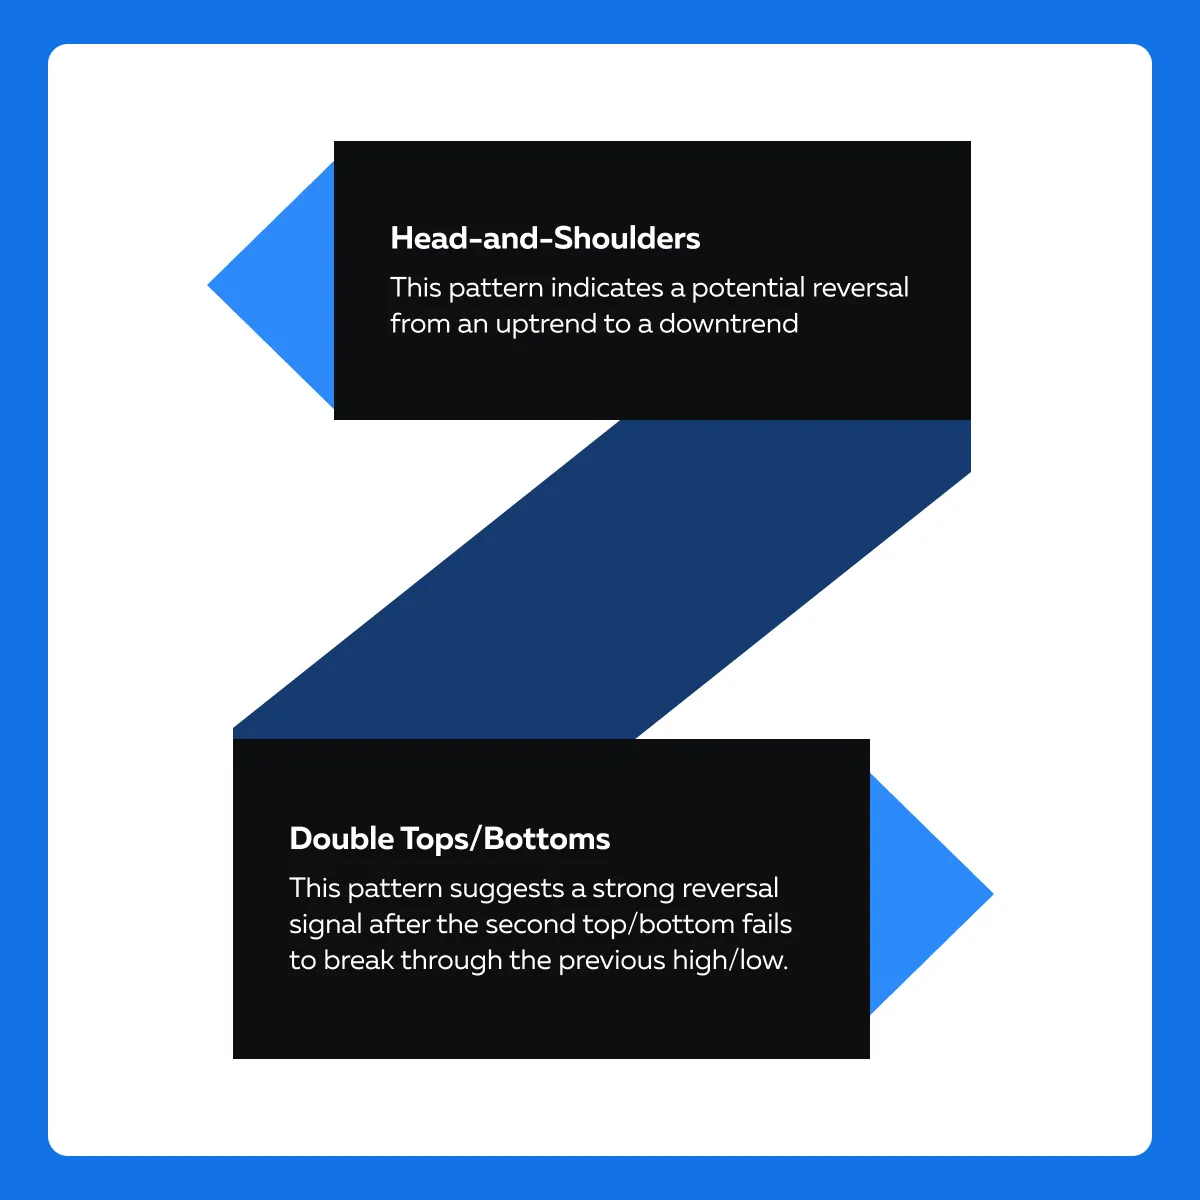
How to spot and confirm patterns in Bookmap?
- Use Bookmap to visualize these patterns in the VIX.
- The heatmap can highlight areas where significant trading activity forms these patterns.
- Combine this visual analysis with historical data to validate the patterns.
- Use volume indicators to corroborate the patterns.
- For a head-and-shoulders pattern, look for decreasing volume on the second and third peaks.
- For double tops/bottoms, confirm with increased volume on the breakout from the neckline.
- Enhance pattern recognition with sentiment analysis tools.
- Track news sentiment and social media trends.
- This tracking helps in gauging overall market sentiment.
- It even provides additional confirmation for the pattern.
For more in-depth strategies, visit Trading in Volatile Times – Tips and Strategies.
How Can You Adjust Position Sizes and Stop-Loss Settings in Response to VIX Volatility Levels?
| Technique I: Volatility-Adjusted Strategies | Technique II: Hedging with VIX Options |
|
|
Example Scenarios Using VIX Heatmaps for Trading
Scenario I: Pre-Fed Announcement Trades
The Scenario
- Ahead of a scheduled Federal Reserve (Fed) announcement, traders expect increased market volatility
- That’s due to uncertainty around potential changes in interest rates.
Using Heatmaps to Spot Activity
- Observation Period
-
-
- Traders monitor VIX futures heatmaps in the days leading up to the Fed announcement.
- They observe an increase in the intensity of trading activity.
- This increase is indicated by brighter colors on the heatmap.
- These colors show a buildup in positions.
-
- Key Level Identification
-
- Enhanced visualization tools help identify key resistance levels
- These are the levels where the majority of buy orders are clustered.
- These levels indicate potential breakouts if the announcement triggers significant market reactions.
Setting Up Trades
- Entry Point
-
-
- As the Fed announcement approaches, traders set alerts for breakouts above identified resistance levels in the VIX.
- Upon receiving an alert that the VIX has surpassed this level with increased volume, traders enter long positions in VIX futures or related instruments
-
- Confirming Movement
-
- Bookmap’s heatmaps show sustained trading activity above the resistance level.
- This activity confirms the breakout.
Profit Realization
- Following the Fed’s announcement, market volatility spikes as expected
- The VIX futures move sharply higher.
- Traders benefit from their long positions.
- Traders monitor the heatmap for signs of:
- Decreasing intensity or
- Volume at new highs to determine exit points.
- They lock in profits before volatility potentially subsides.
The Outcome
- Traders successfully capitalize on anticipated volatility spikes by using Bookmap’s heatmaps.
- Using it, they were able to spot pre-announcement trading activity and confirm breakouts.
Scenario II: Earnings Season Volatility
The Scenario
- During earnings season, companies report quarterly results.
- This announcement often leads to significant market volatility.
- Traders aim to take advantage of this by identifying unusual order flows in VIX futures.
Monitoring Order Flows
- Earnings Anticipation
-
-
- Traders use Bookmap to monitor VIX futures heatmaps throughout the earnings season.
- They specifically look for unusual spikes in order flow and trading intensity ahead of major earnings releases.
- These spikes are signaled by bright clusters of buy and sell orders.
-
- Analyzing Patterns
-
- Traders observe unusual activity patterns, such as:
- Large buy orders or
- Sudden shifts in volume.
- These patterns show that market participants are positioned for expected volatility from upcoming earnings reports.
- Traders observe unusual activity patterns, such as:
Setting Up Trades
- Identifying Unusual Activity
-
-
- Traders notice an increase in buy orders in VIX futures.
- This increase suggests expectations of high volatility.
-
- Entry Point
-
- Based on this insight, traders enter long positions in VIX futures or related options.
- They expect the VIX to rise as earnings reports lead to increased market swings.
Volume and Sentiment Analysis
- Confirming Trends
-
-
- As earnings reports begin to come out, traders use Bookmap to continuously monitor heatmaps for confirmation of their strategy.
- Increasing volume and sustained high-intensity order flow in VIX futures validate their expectations of heightened volatility.
-
- Sentiment Indicators
-
- They also corroborate this with sentiment analysis from news and social media.
- This corroboration further supports their trades.
Profit Realization
- Post-Earnings Reaction
-
-
- As expected, the market reacts strongly to earnings reports.
- This event causes a surge in the VIX.
- Traders benefit from their long positions as the volatility index climbs.
-
- Exit Strategy
-
- Traders set trailing stops.
- They monitor heatmaps for signs of decreasing volume.
- This way they can secure profits before the market stabilizes.
The Outcome
- Traders effectively profit from the volatility spikes during earnings season by:
- Identifying unusual order flows
and
- Confirming their expectations with:
- Real-time data
and
- Sentiment analysis.
Conclusion
Using visual strategies to trade VIX movements offers several key benefits. It provides a clear and immediate understanding of market volatility by highlighting real-time data and trading activity. Tools like Bookmap help traders identify crucial resistance and support levels. They even detect unusual order flows and volume spikes that signal potential changes in volatility.
Also, by integrating comprehensive data visualization tools, traders can streamline the process of tracking market sentiment and anticipating shifts. By combining indicators like the 14-day moving average and MACD with real-time heatmaps, traders can better confirm trends and avoid false signals. This combination improves the accuracy of trading strategies.
By incorporating these tools and strategies, traders can better manage risk and maximize profit opportunities in volatile markets. For more insights on the importance of volatility in trading, read this blog article here.
Sign Up Now