
Our 4th of July Sale is Live
Offer Valid July 4 – July 11
Get 50% off Global+ AND data for 3 months—or save 30% on Global+ for the full year
Claim Your DealReady to see the market clearly?
Sign up now and make smarter trades today
Education
September 21, 2024
SHARE
Volume Profile & Order Flow: Tools for Deep Market Insight

In today’s trading world, making informed decisions is more important than ever. To do this, traders often turn to powerful tools like Volume Profile and Order Flow analysis. These tools shed light on what’s happening behind the scenes in the market.
Let’s dive into the essence of Volume Profile and Order Flow and see their transformative impact on trading strategies.
Understanding Volume Profile
Volume Profile is an advanced market analysis technique that allows traders to visualize the distribution of trading volume across various price levels over a specific time period.
A careful analysis helps traders gain valuable insights into the supply and demand dynamics in the market, helping them pinpoint:
- Key levels of support and resistance
- Potential price reversal points, and
- Zones of high trading activity
Volume Profile isn’t a solo act; it is often used in conjunction with price charts to enhance trading decisions and gain a better understanding of market behavior.
Market Profile vs. Volume Profile
Market Profile and Volume Profile are both used to analyze market structure, but they focus on different elements:
- Market Profile visualizes the distribution of trades over time, often using a TPO (Time Price Opportunity) chart to show where price spent the most time during a trading session.
- Volume Profile, in contrast, focuses solely on volume traded at different price levels, regardless of time, offering insights into liquidity and key trading zones.
Key Differences Between Market Profile and Volume Profile
| Feature | Market Profile | Volume Profile |
|---|---|---|
| Focus | Time-based price distribution | Volume-based price distribution |
| Key Tool | TPO Chart | Volume Footprint Chart |
| Best For | Identifying value areas based on time | Spotting high and low volume zones |
| Common Use Case | Analyzing auction market theory | Finding liquidity pools and trade execution zones |
While Market Profile emphasizes where price has spent the most time, Volume Profile identifies areas where significant trading activity has taken place, making it an essential tool for understanding order flow and liquidity zones.
What is the Difference Between Market Profile and Volume Profile?
Market Profile and Volume Profile, while related, focus on different aspects of market analysis. While both methods provide insights into market dynamics, Volume Profile focuses exclusively on the relationship between price and trading volume.
Market Profile focuses on the time at which trades occur. It creates a visual representation of the price distribution based on periods, usually within a single trading day.
On the other hand, Volume Profile emphasizes the volume traded at different price levels, regardless of the timeframe.
How Do Traders Incorporate Volume Profile in Market Analysis?
Volume Profile is a powerful tool for traders to gain insights into market behavior. It’s often considered a valuable addition to a trader’s toolkit when combined with other technical and fundamental analysis methods.
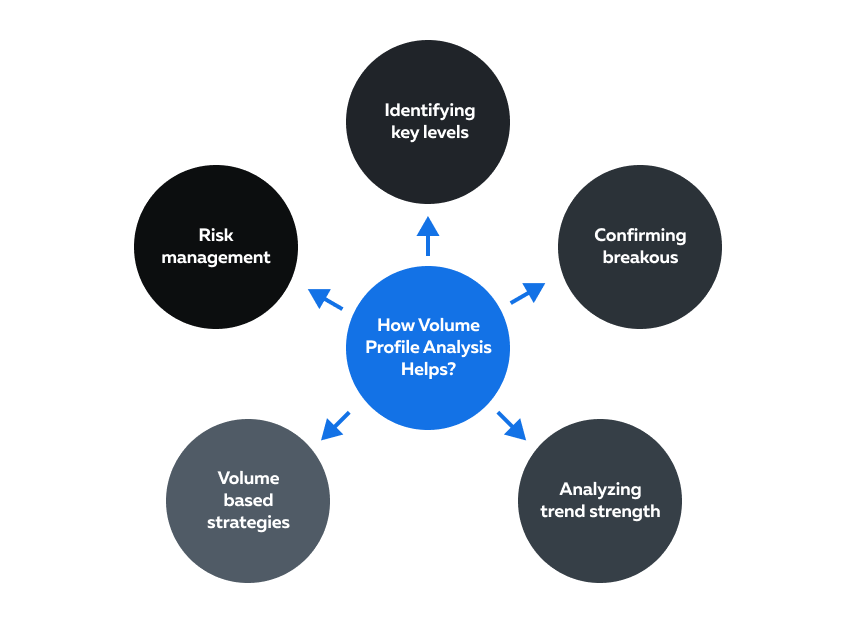
Traders incorporate Volume Profile into their analysis in several ways:
-
Identifying Key Levels:
-
Traders use Volume Profile to pinpoint significant support and resistance levels based on high-volume nodes.
-
These levels can offer valuable insights into potential price obstacles and reversals.
-
-
Confirming Breakouts:
-
Volume Profile can help confirm the strength of a breakout.
-
A breakout accompanied by high volume is often seen as more valid and likely to lead to a sustained price move.
-
-
Analyzing Trend Strength:
-
Traders assess trend strength by observing changes in volume distribution alongside price trends.
-
Consistent volume supporting a trend reinforces its potential for long-term sustainability.
-
-
Developing Volume-Based Strategies:
-
Traders can develop trading strategies that utilize Volume Profile, such as:
-
Trading bounces off high-volume nodes or,
-
Breakouts from low-volume areas.
-
-
-
Implementing Risk Management:
-
Understanding volume distribution can assist in setting stop-loss levels.
-
Additionally, it helps in identifying potential areas of low risk where price is less likely to retrace.
-
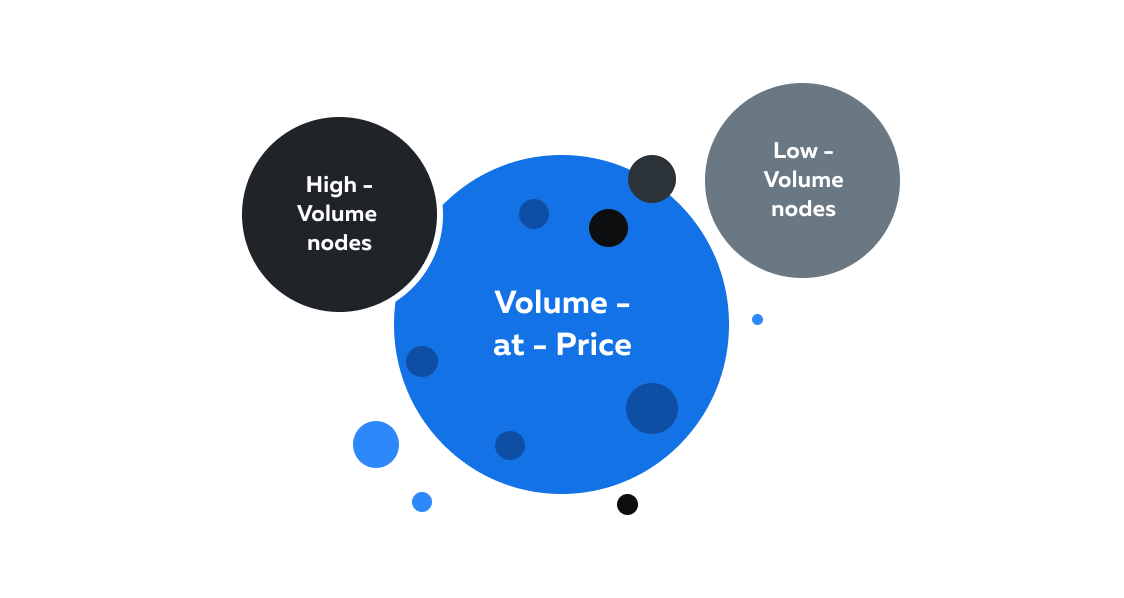
Key Components of Volume Profile
The Volume Profile technique comprises several key components that collectively offer a detailed perspective on:
-
Market sentiment
-
Key levels of interest
-
Potential turning points
Let’s delve into these components, unraveling their significance for traders navigating financial markets.
|
Component |
Meaning |
Practical Application |
|
Volume-at-Price |
|
Through analysis of volume distribution across different price levels, traders can identify significant price levels where:
|
|
High-Volume Nodes |
|
|
|
Low-Volume Nodes |
|
|
How to Leverage Bookmap for Effective Volume Profile Analysis
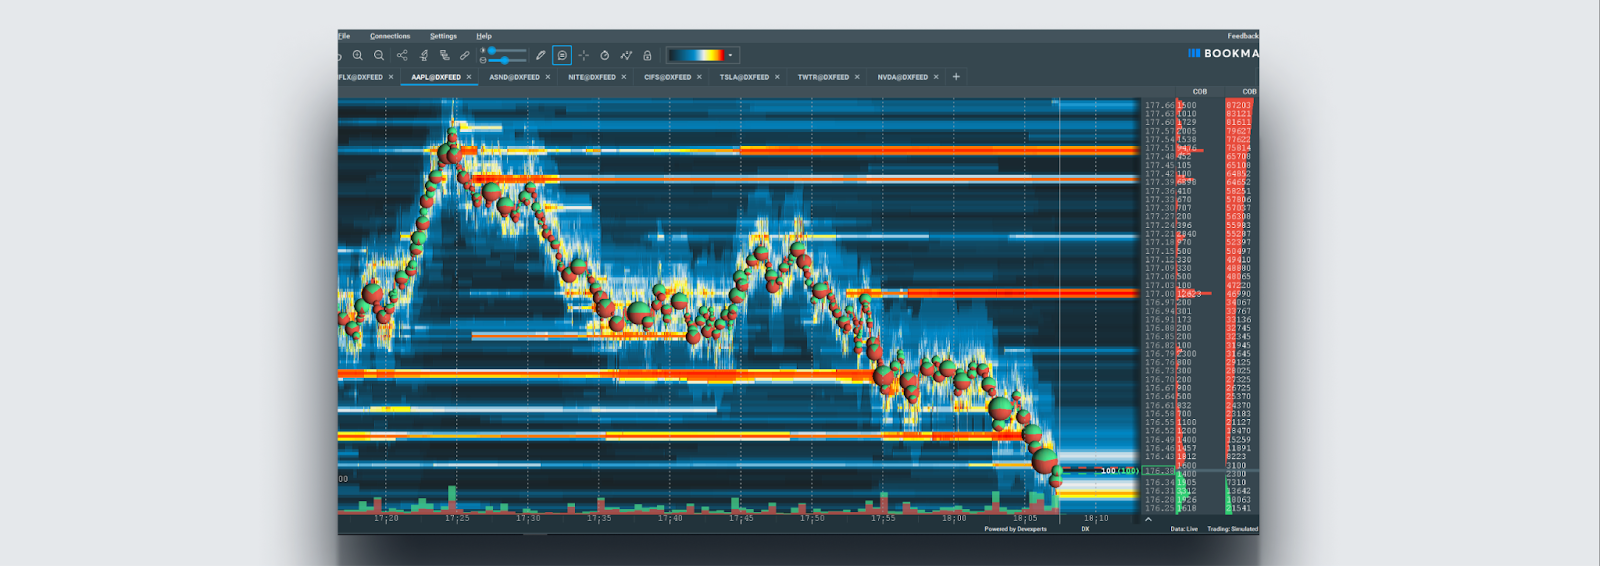
Bookmap is a market visualization trading tool. It provides traders with a real-time, dynamic, and highly visual representation of market activities making it easier to understand the dynamics of supply and demand. Additionally, the platform is capable of:
-
Displaying limit orders
-
Showcasing evolving volume transactions, and
-
Illustrating the auction process in the order flow
The Practical Application of Volume Profile With Bookmap
-
-
Visualizing Order Flow:
- Bookmap allows traders to see the incoming buy and sell orders as they are executed; granting traders a backstage pass into the market’s pulse.
-
This allows them to witness the live interaction between buyers and sellers.
-
This viewpoint spills the beans on how orders align and how the market crowd reacts at various price levels.
-
-
Depicting Limit Orders:
-
Using Bookmap, traders can observe the limit orders placed in the order book and how they interact with the executed market orders.
-
This provides crucial insights into the levels where traders are willing to transact at specific prices.
-
Traders use this information to identify areas of potential support and resistance.
-
-
Dynamic Volume Profile:
-
Instead of showing historical volume at fixed price levels, Bookmap displays the precise volume of transactions as they occur in real time.
-
This means that traders can see volume building up and fading away as the market moves.
-
It gives a more accurate representation of the evolving volume profile.
-
-
Identifying Key Levels:
-
Using Bookmap, the high-volume areas and low-volume areas are instantly recognizable.
-
This real-time visualization of data helps traders in:
-
Spotting changes in volume distribution as market sentiment shifts.
-
Identifying potential support and resistance levels for making trading decisions.
-
-
-
Confirming Breakouts and Reversals:
-
Bookmap facilitates traders in observing:
-
how volume responds to price fluctuations
-
whether a breakout is backed by strong volume
-
whether a reversal is occurring due to a significant shift in trading activity
-
-
Reliable answers (which can be found by using Bookmap) to these questions help traders confirm the breakouts and reversals.
-
-
Scalping and Short-Term Trading:
-
Scalpers and short-term traders use Bookmap’s real-time data representation to spot sudden spikes in volume and gauge rapid price movements.
-
This helps them capitalize on quick opportunities that arise due to the fluid order flow.
-
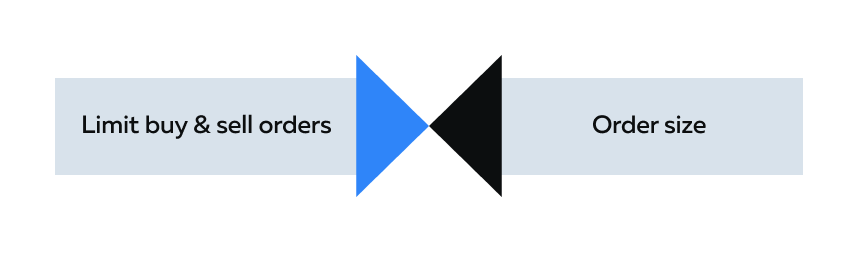
Grasping Order Flow
Order flow refers to the real-time stream of buy and sell orders entering the market. It’s the dynamic interaction between these orders that drives price fluctuations. Two key elements of order flow are:
|
Components |
Meaning |
Indication |
|
Limit Buy and Sell Orders |
|
|
|
Order Size |
Order size refers to the number of units or contracts in a particular buy or sell order. |
|
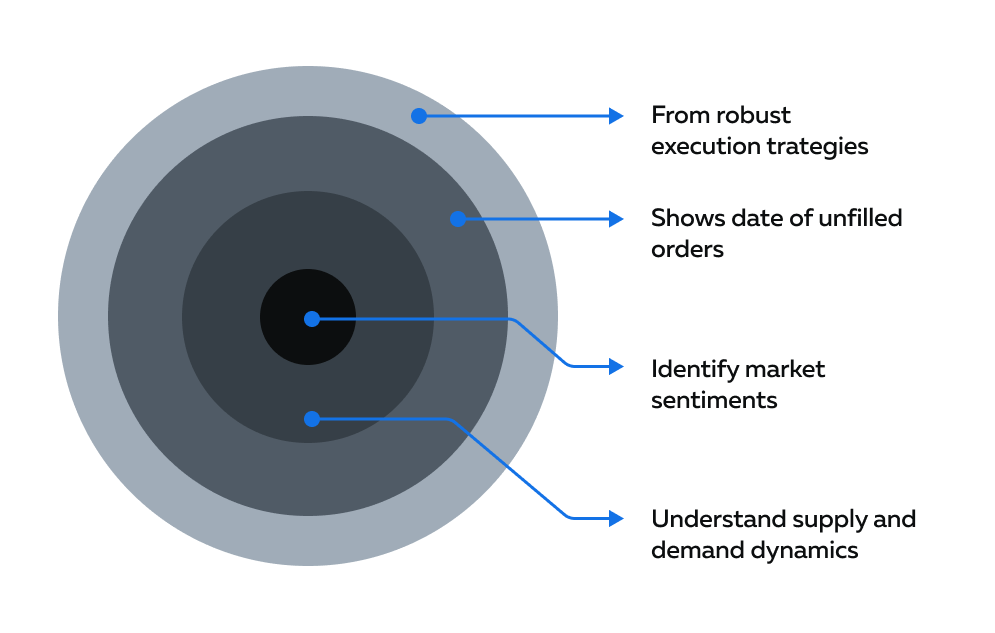
What Insights Do Traders Gain from Order Flow Analysis?
A comprehensive understanding of the order flow analysis offers insights into market participants’ behaviors and strategies. This is how traders leverage this technique:
-
Identify Market Sentiments:
-
A rapid influx of buy orders indicates bullish sentiment.
-
Conversely, an uptick in sell orders suggests a bearish sentiment.
-
-
Understand Supply and Demand Dynamics:
-
Areas with a cluster of limit buy orders act as support levels.
-
Whereas areas with limit sell orders may act as resistance.
-
-
Get Data About Unfilled Orders:
-
Unfilled limit orders in the order book signal potential price turning points.
-
These levels represent areas where participants expect the price to reverse.
-
-
Craft Robust Execution Strategies:
-
Observing the speed at which orders are executed can reveal:
-
High-frequency trading strategies
-
Scalping or algorithmic trading patterns.
-
-
Most traders use this understanding to form robust trading strategies.
-
How Does Bookmap Enhance Order Flow Analysis?
Order flow analysis focuses on the detailed flow of buy and sell orders. Bookmap significantly enhances order flow analysis in the following ways:
|
The Benefit |
The Meaning |
How Does it Help Traders? |
|
Real-time Visualization |
|
|
|
Historical Analysis |
Traders can analyze both current and historical order flow data.
|
This allows traders to understand how order flow dynamics have influenced price movements in the past. |
|
Heatmap Visualization |
Bookmap uses a heatmap-style display to show areas of high trading activity. |
At a glance, traders can identify zones of intense buying or selling, which can be pivotal for making informed decisions.
|
|
Depth of Market |
Traders can view the depth of the market (DOM) to see the volume and order sizes at various price levels.
|
This depth helps traders anticipate potential price movements, giving them an edge in formulating strategies. |
Merging Volume Profile with Order Flow: A Comprehensive Insight
Volume Profile and Order Flow are powerful standalone market analysis tools. When used in tandem, they equip traders with an enriched understanding of market dynamics. Here, we’ll dissect the similarities and differences between them:
|
Similarities |
Differences |
|
|
|
|
|
|
Which Provides a Clearer Picture?
The choice between Volume Profile and Order Flow depends on the trader’s preferences and trading style. Some traders may find Volume Profile sufficient for their analysis, as it helps identify significant price levels and understand market behavior over a specific time frame.
Others may prefer the immediacy and detailed information provided by Order Flow, which offers insights into real-time supply and demand.
The Combined Usage:
-
Many experienced traders find that using both Volume Profile and Order Flow together provides a more comprehensive view of market activity.
-
By integrating information from both methods, traders can gain a deeper understanding of:
-
Price levels
-
Market sentiments, and
-
Potential turning points.
-
How Does Bookmap Contribute?
Bookmap offers tools that comprehensively visualize both Volume Profile and Order Flow comprehensively. Its heatmap feature helps traders identify areas of high liquidity and order concentration, reflecting the essence of Order Flow.
Simultaneously, Bookmap’s volume dots provide insights into the traded volume at specific price levels, corresponding to the principles of Volume Profile. Whether a trader leans more toward Volume Profile or Order Flow – Bookmap serves as a versatile platform that accommodates both approaches.
Ready to master volume profile and order flow? Bookmap makes it simple. Sign up now and upgrade your trading game.
Conclusion
Volume Profile and Order Flow are paramount tools that grant traders a profound understanding of the market. While Volume Profile meticulously examines volume distribution, assisting in the identification of pivotal support and resistance zones, Order Flow provides a real-time lens into the ebb and flow of buy and sell orders, illustrating the nuances of supply and demand.
Bookmap as a trading tool visualizes both concepts, showcasing limit orders, and executed trades. It offers an edge by displaying current and historical data, aiding breakout confirmation, sentiment analysis, and trend assessment.
In short, combining Volume Profile and Order Flow gives traders a clear view of the market, helping them navigate the ups and downs of buying and selling with confidence.

Interpreting Volume and Order Flow: A Comparative Analysis
In the ever-changing stock market, fortunes favor those who seize market opportunities. Through comprehensive market research, investors can identify undervalued securities and sectors that have the potential for immense growth.
The interpretation of “volume” and “order flows” helps participants to identify emerging trends, spot institutional activities, and gauge market sentiments. Additionally, it equips traders to evaluate support and resistance levels, as well as gauge market liquidity.
Let’s dive in to understand the intricacies of trading volume and order flow. Equipped with this knowledge, we’ll explore how successful traders and investors leverage these insights to create effective trading strategies.
The Importance of Trading Volume: Insights for Better Trading Decisions
The interpretation of trading volumes helps the stock market participants understand the dynamics of trading a particular security. This understanding helps in making informed decisions while also spotting potential stock market imbalances.
Market imbalance occurs when there is a disparity in the buying and selling interest of a particular security, which often causes price distortions. Such imbalances are usually due to:
- Shifts in market sentiments
- Market orders placed by large institutions, and
- Unexpected news events
Let’s look at an example to understand market imbalances:
On a particular trading day, the shares of Company ABC opened at $50 apiece. After two hours, the company’s quarterly earnings report beats all the market expectations.
This leads to a sudden change in the market sentiments. Most retail and institutional investors and/or traders start placing large buying orders. The trading volume of the stock surges and puts upward pressure on the current market price (CMP).
The limited number of sellers causes the CMP to inflate, leading to “price distortion”. The caused the stock price of Company ABC to exceed the fundamental value.
Interpreting trading volumes, the market participants recognize the unsustainable CMP and anticipate a correction. Thereby, they accordingly form trading strategies, say, by taking short positions.
What Is Trading Volume?
Trading volume represents the total number of shares or contracts traded for a particular security in a given time frame, which is usually one trading day.
For Example:
On a particular trading day, Company XYZ, a listed entity actively trading on the New York Stock Exchange (NYSE), showed the following data:
- Opening Price: $120
- Closing Price: $125
- High: $132
- Low: $118
- Volume: 1,000,000 shares
In this context, the provided data signifies that throughout the trading day, a total of 1,000,000 shares were exchanged between buyers and sellers at various price points. This demonstrates how trading volume captures the extent of market activity and engagement in terms of shares bought and sold during a specific period.
Understanding trading volume is essential as it offers insights into the level of interest, liquidity, and participation in the market, all of which play a pivotal role in comprehending price movements and making informed trading decisions.
How Do Traders Use Volume In Market Analysis?
Most stock market traders analyze the dynamics of trading volume to understand the market imbalances, sentiments, and volatility. It often acts as an efficient technical indicator and helps in forming effective trading strategies. It helps traders in the following ways:
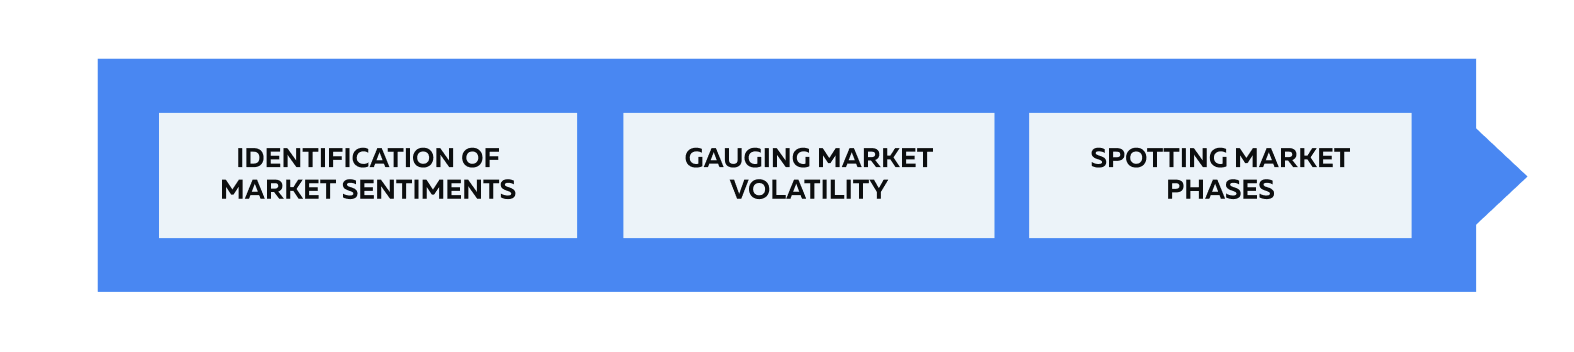
1. Identification Of Market Sentiments:
An analysis of trading volumes helps to identify the prevailing market sentiments in the following manner:
| Bullish Sentiment | Bearish Sentiment |
| The trading volume of a stock increases. | The trading volume of the stock decreases. |
| There is a sudden influx of “buy orders”. | There is a sudden influx of “sell orders”. |
| Most traders attempt to buy the stock at a higher price. | Most traders attempt to sell the stock at a lower price. |
| The price of the stock increases sharply. | The price of the stock decreases sharply. |
2. Gauging Market Volatility:
If there is the presence of high trading volumes during volatile trading days, it indicates:
- Presence of a major market-moving news or event
- Strong potential for major price swings
- Increased market uncertainty
- A strong market interest
3. Spotting Market Phases:
As suggested by the popular Wyckoff method, the prices in a typical stock market move through four different phases, which are Accumulation, Mark-up, Distribution, and Downturn. A deeper analysis of trading volumes helps the traders to identify the current market phase:
| The Four Market Phases | The Behavior of Trading Volume | The Effect on Stock Price |
| Accumulation | Relatively low trading volumes compared to other phases | Price moves upward due to buying pressure |
| Mark-up | Trading volumes start to increase | Price keeps increasing and reaches its peak due to continued buying interest |
| Distribution | A significant increase in the trading volumes | Price shows a minor decline due to the initiation of selling pressure |
| Downturn | High trading volumes remain consistent | Price declines significantly due to a greater number of sell orders and limited buy orders |
Decoding Order Flow
Trading volumes act as an important technical indicator and play a crucial role in determining market moves. However, many traders don’t limit themselves to just one method; instead, they utilize various approaches.
By decoding “order flows”, traders can understand the reason behind short-term movements in the market price. This allows them to discern the market participants’ true intentions at the different price levels and gain insights into the dynamic interplay of demand and supply. Let’s closely examine order flow and grasp how it shapes well-informed trading decisions.
What is Order Flow?
Order flow refers to the cumulative number of trades placed by various market participants at different prices and quantities for a specific security. In the stock market, traders and investors execute transactions using different types of market orders, including:
- Buy Order:
A buy order is executed immediately at the best available “ask price.” For instance, if John wants to buy 175 shares of Apple Inc., his order will be fulfilled promptly at the prevailing ask price of $192 per share.
- Limit Order:
A limit order can be further divided into:
| Limit Buy Order | Limit Sell Order |
| This type of order is placed to buy at a particular price or any lower price. | This type of order is placed to sell at a particular price or any higher price. |
For example,
|
For example,
|
- Sell Order:
A sell order involves an immediate sale executed at the best available “bid price.” For instance, if John wants to sell 175 shares of Apple Inc., his order will be swiftly fulfilled at the prevailing bid price of $195 per share.
The Role Of Order Flow In Trading Decisions
One of the primary objectives of order flow analysis is to enable traders to predict future fluctuations in stock prices. Traders widely use it to make price and/or trend projections in the following manner:

- Recognizing Momentum:
The rapid execution of market orders establishes market momentum, indicating a “sense of urgency” among traders to open or close positions in anticipation of emerging market trends. Analyzing order flow can help understand momentum shifts and anticipate potential trend reversals or continuation patterns.
- Identifying Support And Resistance Levels:
A significant number of buy orders placed at a specific price establish the “support price” for that particular security, indicating that stock prices won’t fall below this level. Conversely, a significant number of sell orders at a specific price establish a “resistance level,” showing that the stock price won’t move upward beyond this level.
- Analyzing Market Liquidity:
The presence of high trading volumes, profound order depth, and narrower bid-ask spreads indicate a highly liquid market. In contrast, shallower order depth and tighter bid-ask spreads reveal a less liquid market with the possibility of even market buy and sell orders remaining pending.
Volume Vs. Order Flow: A Comparative Analysis
The formulation of an effective trading strategy not only helps in objective decision-making but also maximizes profit potential. An assessment of “Trading Volumes” and “Order Flows” aids in identifying clear market entry and exit points, contributing to a robust trading strategy.
While both the terms are related to each other, they offer unique perspectives and assist traders differently. Let’s delve into a more comprehensive comparison by examining the table below:
| Parameter | Trading Volume | Order Flow |
| What does it mean? | Represents the total number of shares or contracts traded for a particular security in a given period (say one trading day) | Represents the real-time flow of different types of market orders placed in respect of a particular security |
| Type of Data Used | Historical data | Spontaneous live data |
| Timing of Calculation | At the end of a trading period | Calculated in real-time as orders get placed |
| Majorly Used For: |
|
|
Synergies Between Trading Volume and Order Flow
Trading volumes and order flows are often used together by most market participants to gain complementary perspectives and make accurate market predictions. This powerful combination works in tandem, offering the following benefits:
- Identification of market sentiments
- Determination of support and resistance levels
- Spotting market trends and reversals
- Assessment of market liquidity
- Identification of short-term trading opportunities
This collaborative use of trading volumes and order flows enhances traders’ ability to grasp the intricate movements of the market, providing a well-rounded perspective that aids in informed decision-making and effective strategy development.
Leveraging Trading Tools for Volume and Order Flow Analysis
Interpretation and analysis of volume and order flow data provide valuable insights and enhance traders’ understanding of market dynamics. Trading tools, such as Bookmap, make this process easier by offering advanced features and visualizations.
Intelligently designed by experts, Bookmap’s Volume Dots, Heatmap, and Volume Bars aid traders in the following ways:
- Volume Dots:
- display real-time volume data on the price chart
- help in gaining an understanding of the supply and demand dynamics at a specific price level
- identify significant areas of liquidity
- Heatmap:
- offers a graphical representation of order flow data
- color-codes different price levels based on traded volume and order flow activity
- Volume Bars:
- show the volume traded at each price level
- help traders identify price areas at which substantial trading is happening
By utilizing Bookmap’s Volume Dots, Heatmap, and Volume Bars, traders can gain deeper insights into market activity and trends.
Conclusion
The analysis of trading volumes and order flow equips traders and investors with the tools needed to create effective trading strategies, enhancing their ability to achieve successful outcomes in the market. By harnessing the combined power of these tools, traders can identify emerging trends, evaluate support and resistance levels, gauge market liquidity, and assess momentum, among other insights.
Bookmap’s cutting-edge trading tools further streamline this analysis, providing intuitive visualizations and a host of advanced features that simplify the process and enhance traders’ decision-making capabilities.
Ready to elevate your trading with advanced insights into volume and order flow? Sign up for Bookmap and take the first step towards enhanced market understanding today.