See data more clearly in real time.
Compare plans to access deeper market visibility for data.
Education
April 8, 2024
Updated
SHARE
Revealing Hidden Market Secrets: The Power of Alternative Data in Forecasting Trends
 In the world of financial markets, predicting price movements plays a major role in executing profitable trades. While traditional data holds its relevance, alternative data can truly augment your predictive abilities.
Through this article, we will understand the meaning of alternative data and how it goes beyond traditional financial data to provide unique insights into market trends and consumer behavior. From sentiment analysis on social media to satellite imagery tracking economic activity, we will explore the diverse range of alternative data sources available to traders.
Also, we will highlight the significance of validating, interpreting, and incorporating data into existing trading strategies. Through real-world examples and actionable advice, Bookmap strives to assist traders in enhancing their trading performance and securing better investment outcomes. Let’s get started.
What are Alternative Data Sources?
Alternative data sources are non-traditional datasets that provide unique insights into various aspects of the:
- Economy,
- Markets, and
- Consumer behavior.
These sources go beyond the conventional financial data typically used in investment analysis and trading. Let’s observe some popular alternative data sources:
- Sentiment Analysis from Social Media Platforms
-
-
- Social media platforms like X (formerly Twitter), Facebook, and Reddit offer a wealth of real-time information about:
- Public sentiment,
- Consumer preferences, and
- Emerging trends.
- Most participants in financial markets analyze the language, tone, and volume of social media posts.
- This analysis helps in:
- Gauging market sentiment and
- Anticipating shifts in consumer behavior.
- For example,
- Hedge funds and trading firms use sentiment analysis.
- They track mentions of specific stocks or products on social media platforms.
- This tracking helps them identify:
- Potential market-moving events or
- Sentiment shifts.
- Social media platforms like X (formerly Twitter), Facebook, and Reddit offer a wealth of real-time information about:
-
- Satellite Imagery for Tracking Economic Activity
-
-
- Satellite imagery offers visual insights into factors like:
- Shipping traffic,
- Construction activity, and
- Crop yields.
- Primarily, analysts use satellite data to track the movement of goods.
- Also, it is widely used to monitor:
- The expansion or contraction of industrial facilities and
- The health of agricultural sectors.
- For instance,
- Investors use satellite imagery of parking lots at retail stores to estimate foot traffic and sales figures.
- This analysis provides them with early indicators of company performance.
- Satellite imagery offers visual insights into factors like:
-
- Web Scraping
-
- Web scraping refers to the process of extracting valuable information from online sources like websites, forums, and online databases.
- Mostly, this technique is used to gather information on:
- Pricing trends,
- Product availability,
- Customer reviews, and
- Competitor activities.
- Investment firms utilize web scraping to monitor price changes and identify emerging market trends.
Some Real-World Examples of Successful Applications
- In 2018, a study by the National Bureau of Economic Research found that analyzing sentiment on X (formerly Twitter) could forecast stock market movements up to six days in advance with an accuracy of 87%.
- Hedge funds like Two Sigma and Citadel incorporate satellite imagery into their investment strategies to gain insights into sectors, such as agriculture, energy, and retail.
- Retail analytics firms like Thasos Group use anonymized location data from mobile devices to track foot traffic at stores.
- Investors anticipated a significant investment by Warren Buffett’s Berkshire Hathaway in Occidental Petroleum by observing corporate jet movements.
- Investors monitored online sentiment around GameStop stocks and explored profitable outcomes.
Social Media Sentiment Analysis
Sentiment analysis on social media platforms like Twitter and Reddit offers valuable real-time insights into:
- Market sentiment,
- Consumer behavior, and
- Emerging trends.
Also known as opinion mining, this technique analyzes text data to discern the sentiment it coveys, whether positive, negative, or neutral. In the context of social media, sentiment analysis involves analyzing:
- Posts,
- Comments, and
- Discussions.
The primary goal is to gauge public sentiment. Sentiment analysis algorithms play a crucial role in this process.
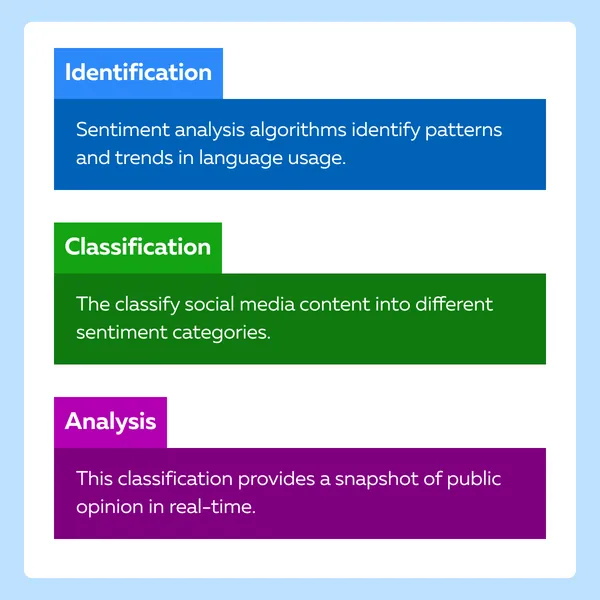
How to Analyze Social Media Data?
Analysts extract actionable insights from social media data by using several tools and techniques. Let’s study some popular ones:
- Natural Language Processing (NLP)
- NLP techniques are used to preprocess and analyze textual data from social media platforms.
- This includes tasks such as:
- Tokenization,
- Lemmatization, and
- Part-of-speech tagging.
- Machine Learning Algorithms
- Supervised and unsupervised machine learning algorithms are used, such as:
- Support vector machines (SVM) and
- Recurrent neural networks (RNNs).
- These algorithms can be trained to classify social media posts based on sentiment.
- Supervised and unsupervised machine learning algorithms are used, such as:
- Sentiment Lexicons
- Analysts use lexicons or dictionaries containing words and phrases associated with different sentiment categories (positive, negative, neutral).
- This association helps in the assignment of sentiment scores to social media content.
- Topic Modeling:
- Techniques like Latent Dirichlet Allocation (LDA) can be used to identify topics and themes within social media discussions.
- This identification allows analysts to focus on specific areas of interest.
Some Real-world Examples of Social Media Sentiment Analysis
| GameStop (GME) and AMC Entertainment (AMC) | Hedge Fund Tracking |
|
|
Satellite Imagery and Geospatial Data

Satellite imagery and geospatial data play a crucial role in forecasting trends. They provide crucial data about various industries, such as:
- Agriculture,
- Transportation, and
- Real estate.
Let’s go deeper and understand how satellite data reveals valuable information in these sectors:
A) Agriculture
| Crop Monitoring | Weather Patterns | Supply Chain Optimization |
|
|
|
B) Transportation
| Traffic Monitoring | Asset Tracking | Environmental Impact Assessment |
|
|
|
C) Real Estate
| Urban Development | Property Assessment | Disaster Risk Management |
|
|
|
Web Scraping and Big Data Analytics

Web scraping and big data analytics play a crucial role in gathering and analyzing vast amounts of online data. They provide valuable insights into:
- Financial markets,
- Consumer behavior patterns, and
- Market trends.
Both these techniques are often used in conjunction. Let’s first understand them individually:
- Web Scraping
-
-
- By using automated tools or scripts, web scraping is used to extract data from:
- Websites,
- Forums,
- Social media platforms, and
- Other online sources.
- HTML parsing and web crawling are some commonly used techniques.
- By using automated tools or scripts, web scraping is used to extract data from:
-
- Big Data Analytics
-
- Big data analytics entails processing, analyzing, and interpreting large volumes of data.
- It helps uncover patterns and trends that are not easily visible with traditional data analysis techniques.
- Techniques, such as machine learning, natural language processing, and predictive modeling are commonly employed.
- Big data analytics enables organizations to make informed, data-driven decisions.
How Web Scraping and Big Data Analytics Work Together
Let’s understand their combined usage across multiple verticals:
| Application Areas | Explanation |
| Financial Data Extraction |
|
| Consumer Behavior Analysis |
|
| Market Trend Forecasting |
|
Strategies for Leveraging Alternative Data
Utilizing alternative data for trading analysis offers traders unique insights and significantly improves their trading outcomes. The integration of alternative data yields various proven benefits:
- Traders gain a broader understanding of market dynamics.
- They uncover trading opportunities not evident from conventional data sources.
- Alternative data provides early indicators of:
- Market trends,
- Sentiment shifts, and
- Emerging risks.
- Merging alternative data with traditional analysis improves risk-adjusted returns and enhances portfolio diversification.
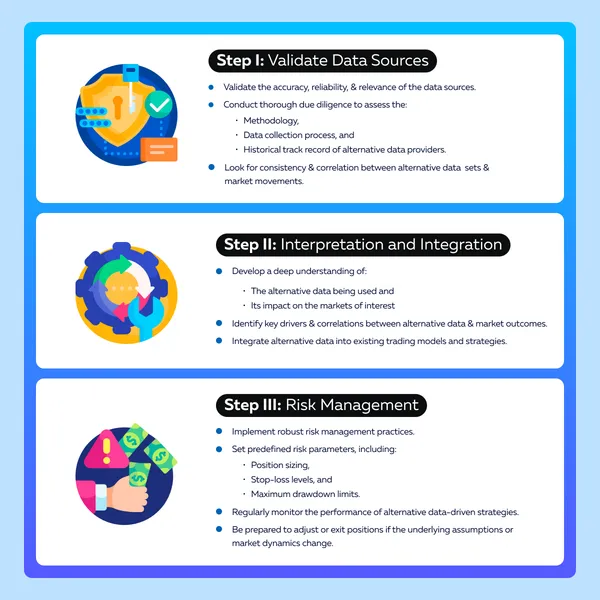
Step-by-step Integration Guide
Traders can integrate alternative data in the following manner:
Quantitative Modeling and Predictive Analytics
Most traders prefer using quantitative modeling and predictive analytics techniques to extract relevant information from alternative data sources. Let’s delve deeper:
| What is the technique? | What is it used for? | How do traders use it? |
| Quantitative Modeling | Quantitative models use mathematical and statistical algorithms to:
Some common examples include:
|
Traders can incorporate alternative data sources alongside traditional financial data. They can refer to:
|
| Predictive Analytics | Predictive analytics involves analyzing historical data to identify patterns and trends that can be used to forecast future outcomes. This technique is particularly effective in discerning complex patterns and relationships in large datasets. | Traders can use predictive analytics techniques to:
|
Some Examples of Quantitative Models and Algorithms
- Sentiment Analysis Models
-
-
- Traders use sentiment analysis models to analyze:
- Social media sentiment and
- News sentiment.
- This analysis enables them to predict market movements.
- Traders use sentiment analysis models to analyze:
-
- Algorithmic Trading Strategies
- Algorithmic trading strategies use quantitative models and algorithms employed to automate the execution of trades based on predefined rules and criteria.
- In them, traders incorporate alternative data inputs, such as:
- Market sentiment indicators,
- Technical indicators, and
- Fundamental data.
- Some examples of algorithmic trading strategies include:
- Trend-following strategies,
- Mean-reversion strategies, and
- Statistical arbitrage strategies.
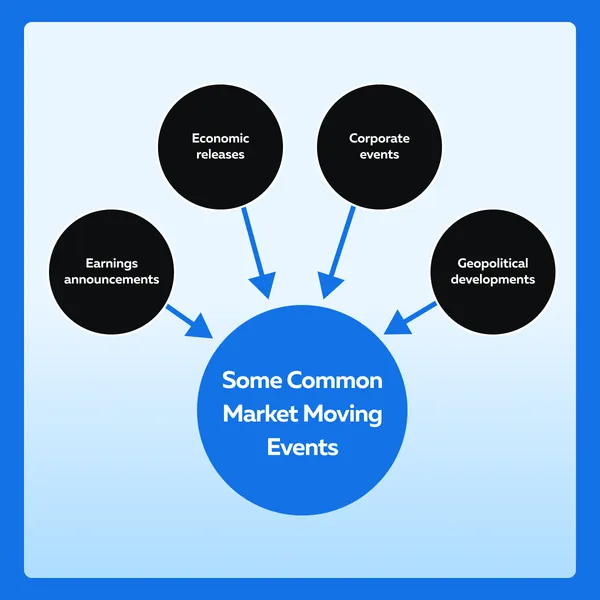
Event-Driven Trading Strategies
Event-driven trading strategies are based on market-moving events. Traders identify trading opportunities using real-time data signals and news sentiment analysis. Let’s understand how it happens:
Step I: Use Real-Time Data Signals
- Traders use real-time data signals, such as:
- Price movements,
- Trading volume, and
- Analyzing these signals helps traders identify market trends and lucrative trading opportunities.
Step II: News Sentiment Analysis
- Traders perform news sentiment analysis using natural language processing techniques.
- This analysis helps to:
- Gauge market sentiment and
- Anticipate market reactions to news events.
- Also, traders can spot trading opportunities based on the sentiment surrounding specific events or developments.
The Future of Alternative Data in Trading: Opportunities & Caution
Alternative data offers traders a plethora of opportunities to gain a competitive edge. However, alongside its potential lies a critical need for caution and thorough validation. Let’s delve into both aspects:
Opportunities
- Competitive Edge
-
-
- Alternative data provides traders with insights into:
- Market dynamics
- Consumer behavior, and
- Economic trends.
- These insights are unique and are mostly not captured by traditional financial data.
- Alternative data provides traders with insights into:
-
- Technological Advancements
-
-
- Several emerging technologies are revolutionizing the acquisition, processing, and analysis of alternative data.
- These advancements primarily include:
- Artificial intelligence (AI),
- Machine learning (ML), and
- Natural language processing (NLP).
- These techniques enable traders to extract actionable insights from vast amounts of data more efficiently and accurately.
-
- Diversification and Innovation
-
- Alternative data allows traders to diversify their sources of information.
- It helps them design innovative trading strategies that go beyond traditional market analysis.
Challenges and Caution
- Data Quality and Bias
-
-
- Alternative data sources may vary in quality, accuracy, and reliability.
- Sometimes, this variation poses challenges in data validation and interpretation.
-
- Data from social media platforms may be subject to bias and manipulation.
-
-
- That’s largely because these platforms are:
- Controlled by corporations and
- Influenced by user behavior and algorithms.
- That’s largely because these platforms are:
-
- Mixed Signals and Noise
-
-
- Alternative data can sometimes generate mixed signals or noise.
- This makes it challenging for traders to distinguish between:
- Meaningful insights and
- Irrelevant information.
-
- Risk Mitigation and Validation
-
- Thorough validation and analysis are essential to identify and mitigate the risks associated with alternative data sources.
- Traders should:
- Conduct rigorous due diligence,
- Perform backtesting and sensitivity analysis, and
- Implement robust risk management practices.
- They must ensure that they are making informed decisions based on comprehensive and reliable data.
Conclusion
Alternative data is becoming increasingly important for traders to understand and predict market trends. By tapping into unconventional sources like social media sentiment, satellite imagery, and web scraping, traders can gain valuable insights that extend beyond traditional financial data.
While alternative data offers opportunities for innovation and competitive advantage, exercising caution is imperative. Traders must validate the accuracy and reliability of alternative data sources, as they may contain biases or noise.
To fully capitalize on these data, traders must explore and investigate various alternative data sources. Also, they must leverage technological advancements and analytical techniques. Dive deeper into the efficient market hypothesis and its implications for trading strategies with Bookmap’s comprehensive guide. Read more here.
Sign Up Now