See charts more clearly in real time.
Compare plans to access deeper market visibility for charts.
Trading Basics
February 21, 2026
Updated
SHARE
The Best Day Trading Charts: A Brief Guide
Interested in day trading? It’s a dynamic venture that demands quick thinking and precise decision-making. In the trading world, where experienced players make strategic moves, having the right tools is essential.
Charts are one of these vital tools, forming the backbone of your day trading strategy. They help you understand price patterns, spot trends, and identify support and resistance levels—essential for wise decision-making in this complex field. And that’s where Bookmap comes in, providing real-time visuals of order book data, so you can see where buyers and sellers are concentrated and how they interact.
Table of Contents
- Best Footprint Charts
- Order Flow Charts
- How to Read Footprint Charts
- Best Software for Footprint Analysis
- Market Microstructure Tools
- Bar & Candlestick Charts
- Matching Charts to Trading Style
Let’s delve deeper into the best day trading charts and explore how you can attain a competitive edge.
Watch: How to Navigate Time Frames in Trading Charts
Understanding how to adjust time frames is critical when working with any trading chart. This short walkthrough shows how different time compressions change what you see in the market and how traders adapt their analysis accordingly.
Best Footprint Charts
Footprint charts are one of the most detailed tools available to day traders. Instead of showing only price, they display executed volume at each price level, helping traders understand where aggressive buyers and sellers are active.
These charts are particularly useful for:
- Identifying strong buying or selling pressure
- Spotting potential reversals or continuation
- Understanding how price reacts at key levels
Bid-Ask Volume Profiles
Footprint charts rely on bid-ask data to show where trades are executed.
This allows traders to:
- See whether volume is hitting the bid or the ask
- Identify aggressive participation
- Evaluate the strength behind price moves
Order Flow Charts
Order flow charts focus on how orders interact in real time rather than just displaying price history.
These include:
- Footprint charts
- Volume profile
- Depth of market (DOM)
- Heatmaps
Order Flow Trading
Order flow analysis helps traders understand how buying and selling activity drives price. For a deeper breakdown of how this applies in real trading scenarios, see order flow trading strategies:
https://bookmap.com/en/content/order-flow-strategies
These tools help traders identify:
- Whether moves are driven by aggressive participants
- Where liquidity is positioned
- Whether breakouts are likely to hold
How to Read Footprint Charts
Reading footprint charts involves understanding how volume behaves at each price level.
Traders focus on:
- Imbalances between buyers and sellers
- Areas where volume increases without price movement
- Reactions at key levels
For a step-by-step breakdown, see how to read footprint charts:
https://bookmap.com/knowledgebase/docs/Addons-Footprint
Footprint Chart Imbalances
Imbalances occur when buying or selling pressure dominates at a specific price. These often signal continuation or exhaustion.
For comparison of how different tools display this, see:
https://bookmap.com/blog/comparing-bookmap-to-dom-footprint-and-volume-profile
Delta Footprint Trading Strategies
Delta measures the difference between buying and selling volume.
Traders use delta to:
- Confirm momentum
- Spot divergence between price and volume
- Identify potential reversals
Best Software for Footprint Analysis
The effectiveness of footprint charts depends heavily on the quality of the data and visualization.
When choosing software, traders should consider:
- Access to real-time data
- Ability to view full market depth
- Clear visualization of volume and liquidity
- Historical replay capabilities
Platforms differ significantly in how they present this information. Some focus on overlays, while others focus on visualizing actual order book activity.
Choosing the Right Day Trading Charts for Your Trading Style
No single chart type is ideal for every trader. The best choice depends on your timeframe, market, and trading objectives.
Short-term scalpers often prefer:
- Tick charts
- 1-minute candlestick charts
- Footprint charts
- Order flow visualizations
Momentum traders frequently use:
- 5-minute candlestick charts
- Volume Profile
- VWAP overlays
- Relative volume indicators
Swing traders may focus more on:
- 4-hour charts
- Daily candlestick charts
- Weekly support and resistance levels
Many traders combine multiple chart types to gain different perspectives on the same market. For example, a trader may use a daily chart to identify trend direction while using a 5-minute chart for execution timing.
Market Microstructure Tools
Understanding market microstructure helps traders interpret what they see on charts.
This includes:
- How orders are matched
- How liquidity is added and removed
- How price moves between levels
For a deeper explanation, see market microstructure tools and concepts:
https://bookmap.com/blog/what-is-financial-market-microstructure
These concepts are essential when working with order flow and advanced chart types.
Essential Day Trading Charts
Day trading is a high-stakes game that requires sharp thinking and precise decision-making. In a world where big players manipulate and maneuver, the right tools can make or break your success. Footprint and Volume Profile charts are two such tools. They provide insights into trading activity and price distribution helping traders gain a significant edge in the market.
While footprint and volume profile charts provide deeper insight into trading activity, they are most effective when combined with real-time data. Without live execution data, traders may miss key shifts in participation and liquidity.
Footprint and Volume Profile Charts
Let’s dive in and understand how these charts can improve your trading.
a) Footprint Charts:
Footprint charts (also known as Market Profile charts) are a visual representation of trading activity within specific price levels over a given period.
How Footprint Charts Help Day Traders
-
Price Discovery:
-
Footprint charts reveal where buying and selling activity is concentrated at different price levels.
-
This helps traders identify areas of price discovery.
-
-
-
Volume Analysis:
-
These charts provide information about the volume traded at each price level.
-
This allows traders to test the strength of support and resistance levels.
-
-
Market Imbalance:
-
Footprint charts highlight at what price level aggressive buyers or sellers are entering the market.
-
This helps traders spot potential trend reversals or breakout opportunities.
-
b) Volume Profile Charts:
Volume Profile charts focus primarily on volume traded at specific price levels over a given time frame. They create a histogram that represents the volume distribution across different price levels.
How Volume Profile Charts Help Day Traders
-
Price Acceptance:
-
Volume profile charts help traders identify price levels where the market has accepted a particular price as fair.
-
-
Point of Control (POC):
-
These charts help traders gauge the POC, which is the price level with the highest traded volume.
-
Most day traders consider it a critical reference point for potential support or resistance.
-
-
Value Area:
-
This is a range of prices where a significant portion of trading has occurred.
-
Day traders use it to identify price ranges with high trading activity.
-
How Are They Related to Day Trading?
Both Footprint and Volume Profile charts provide insights into market dynamics that are crucial for day traders. They help in:
-
Making informed decisions as they show where trading activity is concentrated.
-
Managing risk as traders use them to understand the distribution of trading activity and volume.
-
Spotting trends as footprint and volume profile charts reveal potential trend reversals or trend continuation patterns.
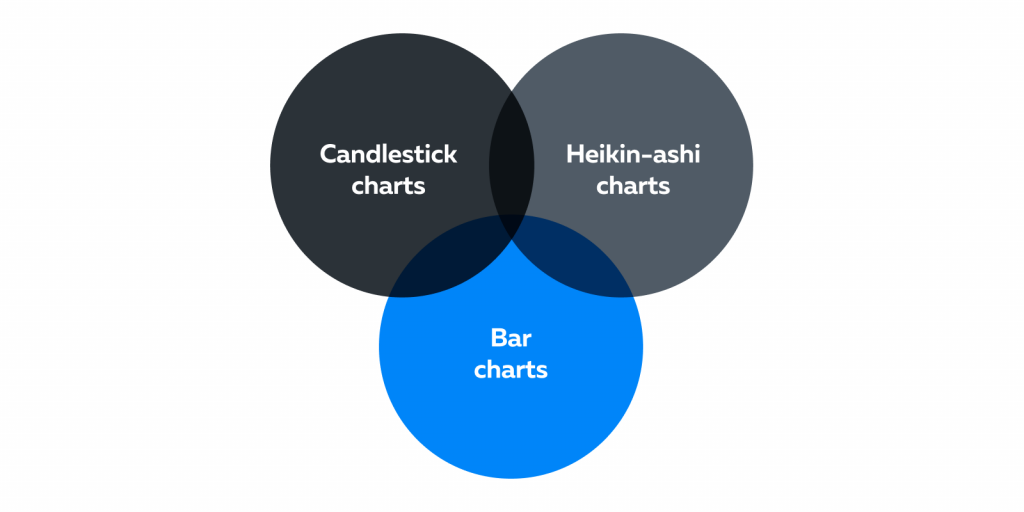
Bar Data Charts (Bar Charts, Candlestick Charts, Heikin-Ashi Charts)
Bar Data charts are commonly used in trading and technical analysis. They aggregate data over specific periods, which may not necessarily be based on time. In this category, we include candlestick and Heikin-Ashi charts due to their shared characteristics related to bar data representation.
The Concept of Bar Data Charts Explained
Bar Data charts represent price and trading data by forming bars or candles, each of which summarizes the price action during a predefined time or volume interval. Unlike time-based charts, where each bar represents a fixed amount of time (e.g., one minute or one hour), bar data charts can have:
-
Bars of varying time lengths or,
-
Be based on a certain volume of trades.
Volume-Based Bars
-
Some bar data charts are based on volume periods rather than time.
-
In other words, a new bar is formed after a specific volume of trades has occurred, regardless of the time it takes to reach that volume.
-
This approach is particularly useful for traders who want to gauge market activity based on the number of trades executed.
The Benefits for Traders (Especially Volume-Centric Traders)
Bar Data charts offer several advantages for traders. Read the table below for a comprehensive understanding:
|
Benefits |
Meaning |
Practical Usage |
|
Establish Price & Volume Relationship |
These charts provide a clear view of how price movements correlate with trading volume. |
|
|
Identify Price Support and Resistance Levels |
Traders can identify support and resistance levels easily on these charts, as price levels with significant trading volume tend to act as barriers.
|
|
|
Trend Analysis |
Bar data charts are useful for trend analysis, helping traders spot potential reversals or confirmations of existing trends based on volume-based patterns. |
|
Candlestick and Heikin-Ashi Charts
Candlestick and Heikin-Ashi charts provide unique visualizations, aiding traders in the analysis of price dynamics and the identification of:
-
Key price levels
-
Trends
-
Potential reversals
By understanding these chart types, traders can enhance their ability to make informed trading decisions in various market conditions.
Let us understand them individually.
-
-
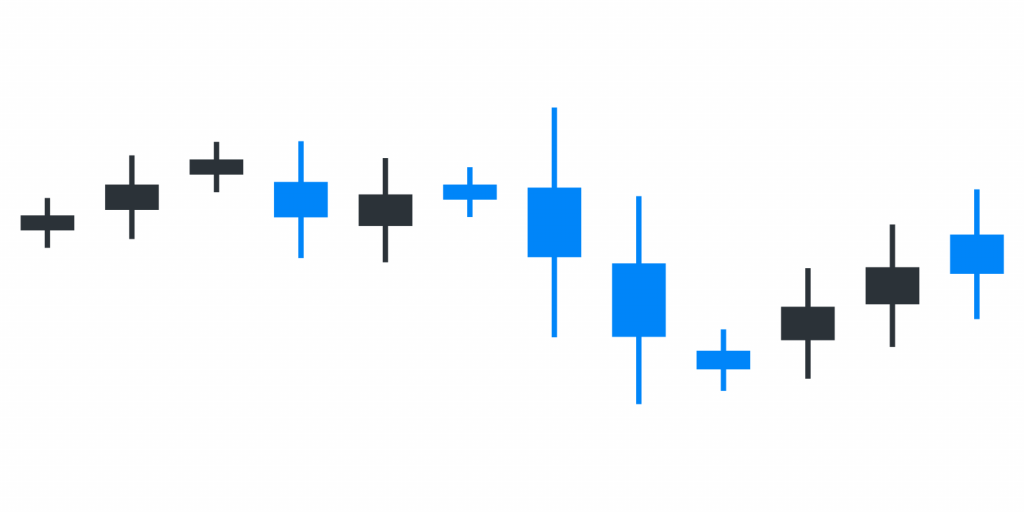
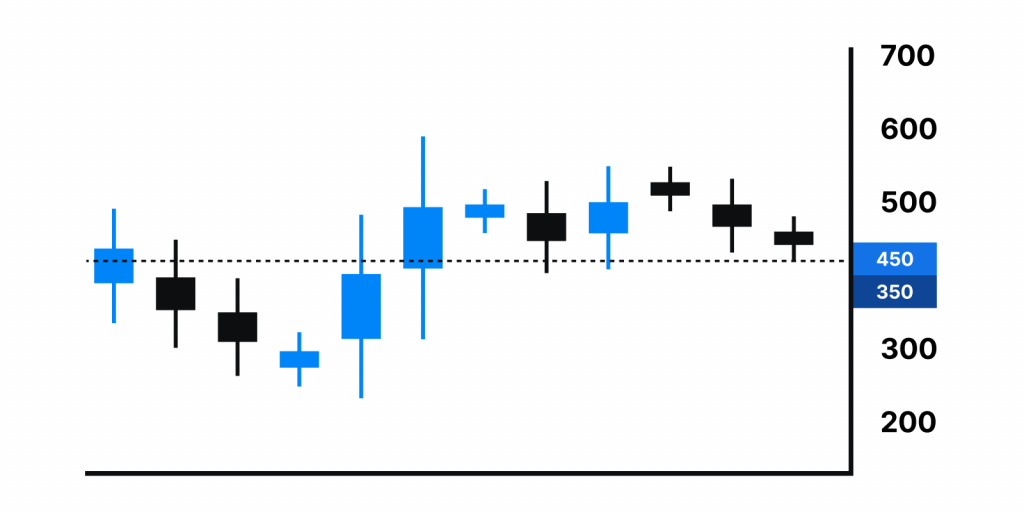
Candlestick Charts:
-
-
provide richer insights compared to traditional bar charts
-
highlight the opening and closing prices for each period, which are represented by the “body” of the candle
-
display high and low prices through the “wick” or “shadow”
-
-
Heikin-Ashi Charts:
-
-
employ a modified formula to smooth out price movements, making trends and reversals more apparent
-
are the preferred choice for traders seeking a clearer representation of market trends
Time-Based Candles vs Tick-Based Charts
One of the most common decisions traders face is whether to use time-based candles or tick-based charts.
Time-based charts create a new candle after a fixed period, such as:
- 1 minute
- 5 minutes
- 15 minutes
- 1 hour
Tick charts create a new bar after a specified number of trades occur, regardless of how much time passes.
Many active traders prefer tick charts during periods of high activity because they can provide a more detailed view of market participation. Time-based charts remain popular because they are widely available and easier for beginners to interpret.
Last Trade / Best Bid and Offer
Last Trade and Best Bid and offer data are crucial tools for day traders. They provide real-time information about the most recent transaction prices and the current state of supply and demand for an asset. This data enables traders to:
-
assess market sentiment
-
execute trades at optimal entry and exit points
Understanding the significance of these tools:
|
Last Trade |
Best Bid & Offer (BBO):
|
|
|
Meaning |
|
|
|
Benefits |
|
|
|
|
|
|
|
Pros and Cons of Different Chart Types
The choice of chart type depends on several factors:
-
Your skill level
-
Your trading style
-
Your analysis needs
Beginners should start with simpler charts to build a solid understanding of price movements, while advanced traders can explore more complex chart types for deeper market insights.
Real-Time Data and Chart Accuracy
Regardless of chart type, the quality of market data has a direct impact on chart accuracy.
Day traders typically rely on:
- Real-time market data
- Low-latency price updates
- Reliable exchange connectivity
- Accurate volume reporting
Delayed or incomplete data can lead to missed opportunities and inaccurate analysis, particularly for short-term traders who rely on rapid changes in liquidity and order flow.
Depth of Information vs. Clarity
When selecting chart types, there’s often a trade-off between the depth of information they provide and the clarity of that information. Let’s explore this concept:
Depth of Information
The more detailed the information is, the better your decision-making will be. It is a plain and simple belief, widely followed in the stock market. A chart or tool with a greater depth of information provides more detailed insights into:
-
Price movements
-
Market dynamics
-
Trading patterns
Most day traders prefer the following tools for gaining in-depth information:
|
Chart |
Benefits |
Negatives |
|
Candlestick Charts |
|
|
|
Heikin-Ashi Charts |
|
|
|
Footprint & Volume Profile Charts |
|
|
Clarity
Clear data visualizations are user-friendly, facilitating:
-
Insights extraction
-
Pattern identification
-
Information comprehension
Most day traders prefer the following tools for gaining clarity in their trading decisions:
|
Chart |
Benefits |
Negatives |
|
Line Charts |
|
|
|
Bar Charts |
|
|
|
Renko Charts |
|
|
Suitability for Trading Styles
Different trading styles, such as scalping, swing trading, and position trading, require specific chart types that align with their objectives and timeframes. Let’s explore which charts are better suited for each trading style.
a) Scalpers
-
Scalpers are traders who aim to profit from very short-term price movements, often holding positions for minutes or even seconds.
-
For scalping, chart types that provide quick and precise information are preferred.
Preferred Charts:
|
Chart |
Explanation |
|
Tick Charts |
|
|
1-Minute Candlestick Charts |
|
Note: Bookmap’s heatmap provides a visual representation of market depth, showing where buyers and sellers are concentrated in real-time. Scalpers can quickly assess liquidity levels to make rapid trading decisions.
b) Swing Traders
-
Swing traders aim to capture medium-term price movements over several days or weeks.
Preferred Charts:
|
Chart |
Explanation |
|
Candlestick Charts |
|
|
Footprint Charts |
|
Note: Bookmap also offers swing traders Historical Depth Data & Iceberg Detection. Swing traders can analyze how the order book evolves over time to identify recurring patterns and potential support/resistance levels. And the Iceberg Detector helps identify hidden large orders, which can be crucial for swing traders looking for support/resistance zones.
c) Position Traders
-
Position traders hold trades for much longer periods, from weeks to months or even years.
-
They require chart types that provide a long-term perspective with less noise.
Preferred Charts:
|
Chart |
Explanation |
|
Weekly or Monthly Line Charts |
|
|
Renko Charts |
|
How Bookmap Revolutionizes Day Trading Visualization
Bookmap’s real-time market dynamics visualization capabilities help day traders gain a competitive advantage. It transforms the way traders perceive and respond to market data, offering a dynamic, visual representation of live order book data, trade executions, and liquidity levels. Here’s how Bookmap’s real-time market visualization capabilities are reshaping day trading:
Real-time Market Dynamics
Bookmap revolutionizes the way day traders perceive and respond to market data, allowing them to make more informed trading decisions. With greater emphasis on real-time market visualization, Bookmap stands out by providing traders with a unique, real-time view of market dynamics.
Unlike traditional charts that display historical price data, Bookmap offers a dynamic, visual representation of live order book data and trade executions.
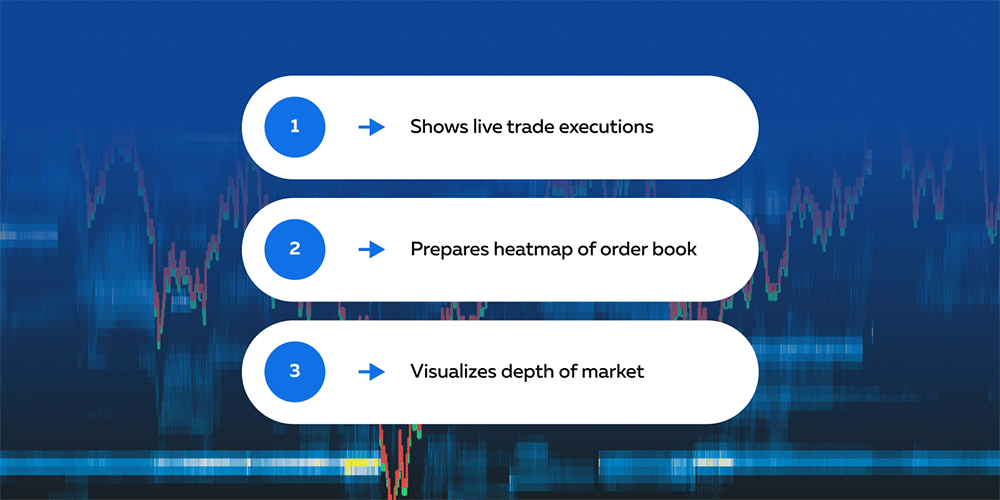
Let’s understand how Bookmap’s real-time visualization is a game-changer:
-
Live Trade Executions:
-
Bookmap displays trades as they occur.
-
These are represented as dots or bubbles on the chart, with colors indicating buy or sell activity.
-
Traders can witness the precise moment when trades are executed.
-
-
-
Order Book Heatmap:
-
Bookmap’s heatmap visualizes the depth of the market, showing:
-
Areas of high liquidity (congestion) and
-
Low liquidity (gaps).
-
-
This information helps traders identify critical support and resistance levels in real-time.
-
-
Depth of Market (DOM) Visualization:
-
The DOM ladder within Bookmap offers a clear view of limit order levels, allowing traders to see where buying and selling interest is concentrated.
-
This transparency is invaluable for understanding market sentiment.
-
The Heatmap and Volume Dots
Bookmap offers two distinctive features that significantly enhance a trader’s understanding of market dynamics: the Heatmap and Volume Dots.
These tools provide real-time insights into order flow and volume distribution, offering traders a unique advantage in their decision-making process. See how:
|
Aspects |
Heatmap |
Volume Dots |
|
What does it mean? |
|
|
|
How is it used? |
|
|
|
How does it help day traders? |
|
|
|
|
|
A sudden surge in dark blue (high liquidity) on the heatmap may indicate a breakout level.
|
Seeing a cluster of red dots followed by a cluster of green dots might signal a short-term reversal.
|
Order Flow: Understanding Market Pulse
Understanding order flow is essential for grasping the dynamics of buying and selling activity within the market. Bookmap’s Market Pulse feature takes this understanding to the next level by providing real-time visualization of order flow. It offers:
-
Visualizing Order Flow:
-
Bookmap displays the order flow on its intuitive chart, offering traders a dynamic view of market activity.
-
It shows individual trades, their sizes, and their prices as they occur.
-
-
Market Depth Analysis:
-
The Depth of Market (DOM) ladder within Bookmap displays limit order levels, revealing where buyers and sellers are concentrated.
-
This allows traders to anticipate potential support and resistance levels based on order book dynamics.
-
-
Market Sentiment Insights:
-
By observing the order flow, traders can gauge market sentiment.
-
For instance, a surge in buy orders may indicate bullish sentiment, while an increase in sell orders could suggest bearish sentiment.
-
Market Pulse Feature:
Bookmap’s Market Pulse feature provides traders with an additional layer of information. It quantifies market activity in real-time, offering insights into market conditions.
|
Benefits |
Explanation |
Practical Usage |
|
Gauging Strength |
|
|
|
Consolidation vs. Momentum |
|
|
Conclusion
Choosing the right chart depends on how you trade and what information you rely on. Simpler charts can help identify trends, while more advanced tools reveal the underlying activity driving those moves.
Platforms that provide real-time visibility into liquidity and execution allow traders to better understand market behavior and react with more precision.
For beginners, simpler charts like Line Charts and basic Bar Charts provide a clear and manageable view of price movements, helping them build a foundational understanding. On the other hand, advanced traders may benefit from the depth of information provided by Candlestick Charts, Heikin-Ashi Charts, Footprint Charts, and Volume Profile Charts, allowing for more in-depth analysis and strategy refinement. Trading styles, such as scalping, swing trading, or position trading, further influence the choice of chart type.
Bookmap’s real-time market visualization tools (including heatmap and volume dots) provide insights into order flow, liquidity, and market sentiment. These tools empower traders to make well-informed decisions, adapt to changing market conditions, and anticipate shifts in supply and demand dynamics.
Ready to elevate your day trading with advanced visualization tools? Dive into the world of Bookmap and experience trading insights like never before. Start Your Bookmap Journey Today!
FAQ
Are you looking for a tutorial or specific software recommendations?
Some traders are focused on learning how charts work, while others are looking for tools to apply them in live markets. Beginners may benefit from structured tutorials, while more experienced traders often prioritize platforms with real-time data and deeper visualization.
Which asset class are you planning to trade with these charts?
Chart selection can vary depending on the market:
- Futures traders often rely on order flow and footprint charts
- Stock traders may combine candlesticks with volume analysis
- Crypto traders often use a mix of both depending on liquidity
What are the best free chart platforms for day trading?
Many platforms offer free charting tools, though features and market data availability vary. Traders should evaluate chart quality, available indicators, supported markets, and whether real-time data is included.
How do you configure chart layouts for multitasking?
Many active traders use multiple monitors or split-screen layouts that combine higher-timeframe charts, execution charts, watchlists, and market depth tools. The ideal layout depends on the trader’s strategy and the number of markets being monitored.
What volume profiles should be overlaid on intraday charts?
Many traders use session-based Volume Profiles to identify areas of heavy participation, value areas, and potential support or resistance levels. The specific settings often vary depending on the instrument being traded.
How often should traders refresh data feeds during active market hours?
Real-time platforms update continuously and generally do not require manual refreshing. Active traders typically prioritize stable connectivity and reliable data delivery rather than manual refresh intervals.
Do you prefer viewing time-based candles or tick-based bars?
Time-based charts provide consistency and are widely used across markets. Tick-based charts focus on trading activity and can offer additional detail during periods of elevated volume.
Are you analyzing charts for equities, futures, or crypto?
Different markets often favor different charting approaches. Futures traders frequently use order flow and footprint tools, while equity and crypto traders may combine traditional charting with volume and liquidity analysis.
Do you need standalone software recommendations or browser-based tools?
Some traders prefer browser-based solutions for accessibility, while others choose desktop platforms for advanced charting, customization, and real-time market analysis features.
Are you focused on macro daily perspectives or micro-second order flow?
Longer-term traders often focus on daily and weekly charts, while active day traders may rely on tick-by-tick execution data, order flow, and market depth visualizations.
Sign Up Now