See technical analysis more clearly in real time.
Compare plans to access deeper market visibility for technical analysis.
Education
December 4, 2024
SHARE
The Role of Technical Analysis in Trading: Understanding Chart Patterns and Indicators
Technical analysis has proved its value time and again. It is one of the
most powerful tools at traders’ disposal and can even turn ordinary
individuals into seasoned market professionals. Do you also wish for
financial success?
This articl is for novice and new investors who want to join the ranks of
master traders. It focuses on how price patterns and trendlines reveal the
psychology of traders. This knowledge will help you trade more effectively.
You will also understand the significance of chart patterns, like the Head
and Shoulders, and reveal the potent “Double Top” and “Double Bottom”
formations that can predict trend changes. Let’s begin.
What is Technical Analysis?
Technical analysis is a method to evaluate and forecast the future price
movements of financial assets, such as stocks, currencies, commodities, and
cryptocurrencies. It is based on price action and primarily focuses on
studying historical price patterns, trends, and chart formations.
How do Traders Perform Technical Analysis?
-
Traders try to identify potential future price movements by
analyzing various chart patterns, like:-
Head and shoulders
-
Double tops and bottoms, and
-
Candlestick patterns
-
-
Traders also analyze volume data to understand the strength of price
movements and confirm potential trend reversals.
Technical Analysis vs. Fundamental Analysis
Technical analysis strikingly differs from fundamental analysis. Let’s
understand it through this table:
|
Parameters |
Technical Analysis |
Fundamental Analysis |
|
Scope |
|
|
|
Data Source |
|
|
|
Time Horizon |
|
|
|
Usage |
|
|
Chart Patterns – The Footprints of Market Psychology
Chart patterns are visual representations of historical price movements in
financial markets. They serve as a reflection of the collective trading
psychology of market participants. Let’s understand how chart patterns
represent this psychology:
-
Chart patterns often form at key psychological levels, such as
support and resistance.-
A support level shows confidence that the price will not fall
below a certain point. -
A resistance level signals pessimism that the price may not rise
above a certain limit.
-
-
Chart patterns, such as reversal patterns, emerge when market
sentiment begins to shift.-
An uptrend reflects optimism and confidence in the market.
-
A downtrend represents fear and pessimism.
-
Head and Shoulders – A Reversal Pattern
The “Head and Shoulders” pattern is a kind of reversal pattern that
indicates a possible reversal from an uptrend to a downtrend. Traders use
this pattern to anticipate price movements.
How to Use This Pattern
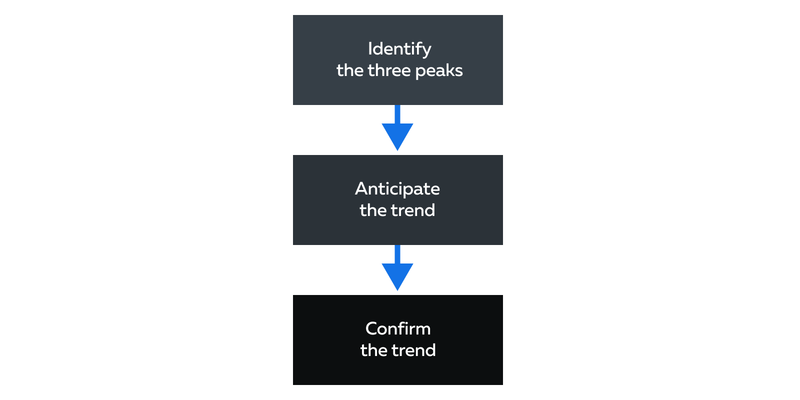
The usage of the heads and shoulders pattern can be divided into three
phases:
-
Phase I – Identification:
-
Traders look for the formation of three peaks in the price
chart:-
A higher peak in the middle (the “head”) and
-
Two lower peaks on either side (the “shoulders”).
-
-
-
Phase II – Anticipation:
-
The first shoulder represents the end of the current uptrend.
-
The head has a higher peak, indicating a potential last push by
the bulls. -
The second shoulder marks a return to the previous peak level.
It suggests a weakening of buying pressure.
-
-
Phase III – Confirmation:
-
Traders wait for a critical price level called the “neckline” to
be broken. -
This neckline connects the low points between the two shoulders.
-
A break below the neckline serves as confirmation that the:
-
The uptrend is likely reversing.
-
The downtrend may be underway.
-
-
Double Top and Bottom: Warning Signs of Trend Changes
The Double Top and Double Bottom patterns are used to identify potential
trend reversals. The former suggests a shift in market sentiment from
bullish to bearish, whereas the latter implies a reversal from a downtrend
to an uptrend. Let’s understand further:
How These Patterns are Formed
|
Double Top |
Double Bottom |
|
|
|
|
Why is it Important to Wait for Confirmation?
In Double Top and Double Bottom patterns, the breakout or breakdown beyond
the neckline serves as a confirmation signal. Without confirmation, it’s
possible that:
-
The pattern may not lead to a trend reversal.
-
Price movements continue in the previous direction.
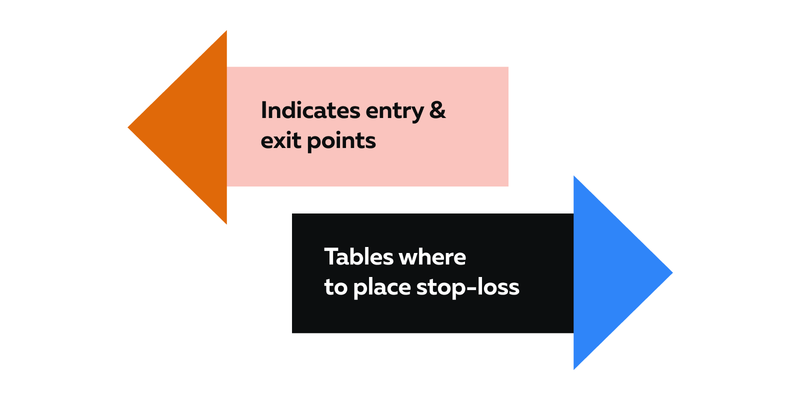
How These Patterns Help Traders
-
Determination of Entry and Exit Points
-
Traders use Double Top and Double Bottom patterns to identify
potential entry and exit points. -
For instance, in a Double Top pattern:
-
An entry short position may be considered upon the breakdown
below the neckline. -
A profit-taking or exit point can be determined based on the
pattern’s height.
-
-
-
Helps in Risk Management:
-
Placing stop-loss orders above the second peak (Double Top) or
below the second trough (Double Bottom) helps manage risk. -
This safeguards traders in case the pattern is invalidated, and
the price reverses unexpectedly.
-
Trendlines: Connecting the Dots for Market Direction
Trendlines visually represent the market direction and show the prevailing
direction of price on a price chart. These lines connect significant price
points (usually highs or lows), thereby helping traders:
-
Identify trends and potential areas of support and resistance
-
Analyze market behavior
-
Make trading decisions
How Trendlines Help Traders
|
Uses |
Explanation |
Practical Usage |
|
Identification of Trends |
Trendlines help traders identify the direction of a |
|
|
Determines Support & Resistance Levels |
Traders use trendlines to make informed decisions |
|
|
Pattern Recognition |
Trendlines confirm the validity of patterns identified |
An ascending trendline provides validation for an |
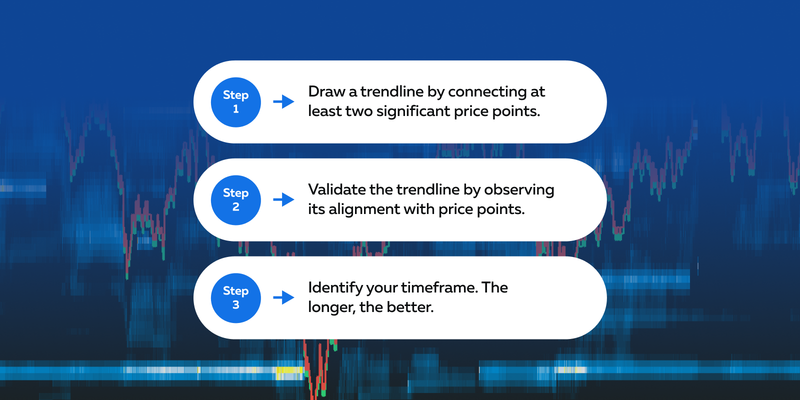
Drawing Trendlines: Rules and Common Mistakes
As discussed above, trendlines aid traders in identifying trends, support,
and resistance. Let’s learn how to draw a trendline:
-
Step 1: Connect Price Points
-
To draw a trendline, connect at least two significant price
points. -
For an ascending (uptrend) trendline, connect higher lows.
-
For a descending (downtrend) trendline, connect lower highs.
-
-
Step 2: Validate Trendlines
-
Valid trendlines are more reliable indicators of support and
resistance. -
The more times the trendline touches or aligns with price
points, the more valid it is considered.
-
-
Step 3: Decide Timeframe
-
Trendlines can be drawn on various timeframes, from intraday to
long-term charts. -
Longer timeframes typically hold more significance.
-
What are Some Common Pitfalls to Avoid?
-
Overfitting:
-
Drawing too many trendlines on a chart can lead to overfitting.
-
Avoid excessive trendlines by focusing on the most prominent and
well-confirmed ones.
-
-
Ignoring Volume:
-
Trendlines don’t take trading volume into account.
-
High trading volume can confirm or invalidate trendline breaks,
so it’s essential to consider volume alongside trendlines.
-
-
Relying Solely on Trendlines:
-
While trendlines are valuable, they should be used in
conjunction with other technical and fundamental analysis tools. -
Relying solely on trendlines can lead to incomplete or incorrect
trading decisions.
-
Understanding Support and Resistance Through Trendlines
Let’s begin by understanding the meaning of support and resistance levels
through the table below:
|
Parameters |
Support Level |
Resistance Level |
|
Meaning |
Support is a price level at which an asset tends to find |
Resistance is a price level at which an asset tends to |
|
Indication |
It represents a zone where demand outweighs supply. |
It represents a zone where supply exceeds demand. |
|
Price Action |
Increased buying pressure causes a price bounce or |
Increased selling pressure causes a price pullback or |
How do Trendlines Help Establish Support and Resistance?
Trendlines play a crucial role in establishing critical support and
resistance levels. Let’s see some general rules:
-
In an uptrend, an ascending trendline serves as a support level.
Traders draw an ascending trendline by connecting the higher lows on
a price chart. -
In a downtrend, a descending trendline can act as a resistance
level. Traders draw a descending trendline by connecting the lower
highs on a price chart.
Conclusion
Mastering technical analysis is essential for informed trading decisions in
financial markets. It is a fact that markets change, and new patterns emerge
continuously in the wake of shifting economic conditions. Thus, traders must
follow an adaptive approach and stay updated.
Additionally, it’s crucial to combine technical analysis with other forms of
analysis, manage risks, and understand the dynamic relationship between
potential rewards and inherent risks.
Usage of advanced market analysis tools like Bookmap can help you visualize
the market and make more disciplined trading decisions. Are you eager to see
how technical analysis pairs with other methods? Dive into our guide on
Technical Analysis vs. Order Flow
to get the complete picture.
Sign Up Now