See time frame more clearly in real time.
Compare plans to access deeper market visibility for time frame.
Crypto
August 9, 2024
SHARE
Trading Fractals: The Power of Multi-time Frame Analysis with Bookmap
By Owain Higham
Fractals are mathematical patterns that repeat and look similar at different scales. These kinds of patterns can be seen all over nature, a forest being a very common example of a fractal pattern. Within each trees’ cluster of branches seems to sit a mini forest, each branch similar to the whole tree. Going even deeper, the leaves on any individual branch remind onlookers of the trees once again, its veins painting the picture of tree branches.

Fig 1 – Each branch on a tree looks like it’s own smaller tree, connected to the whole.
Mathematician Benoit Mandelbrot originally discovered the phenomenon in geometry, but he eventually applied the concept to financial markets in his 2004 book The (Mis)Behaviour of Markets. Since financial markets are not actually a random walk like traditional economy theory posits, it means that returns distributions are not independent across time frames, and thus individual assets share interconnected patterns at even the most granular levels.
A potential explanation of this phenomena is that emotions are the same across all timeframes. When the reactions on a lower time frame cascade and impact the order flow of the more longer-term focused participants, it can trigger a broader trend. Of course, that is not always the exact scenario that will play out, as markets can move for many different reasons. But the concept of fractals is perfect for trading, because it can help to improve your trading strategy, both reducing risk and increasing your returns if applied correctly.
Trends Within Trends
If you show two different traders the same instrument, you will get two different opinions. This is of course what creates a market in the first place, every transaction requiring both a buyer and a seller. But they can also differ in opinion not just because of their strategies, but because of the different time scales they are looking at.
During any trend, there will naturally be pullbacks. This is when there is a pause in price movement before a continuation. During an uptrend, for example, you would see this as prices printing a higher low on the chart. If you were to zoom into a smaller scale, though, those down moves will look like downtrends on the lower time frame: the lower lows being what eventually create the longer term trends’ higher low.
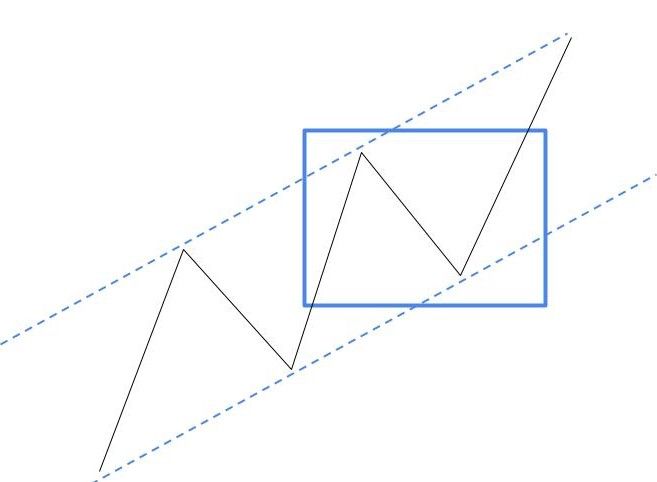
Fig 2 – An example of how a pullback during an uptrend might look like.
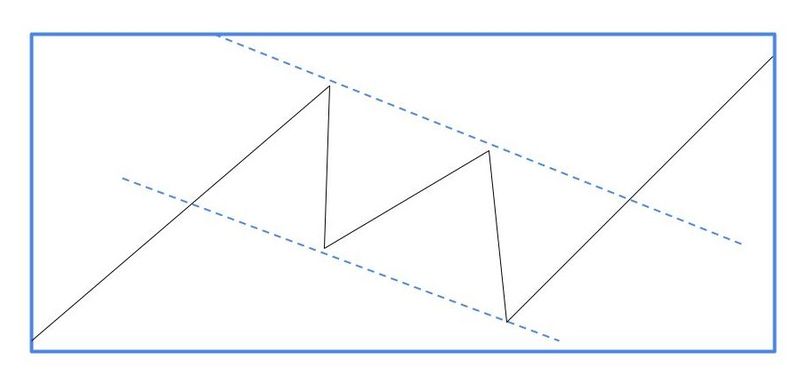
Fig 3 – Zoomed in, the same pullback looks like a downtrend.
The pullbacks within a trend looking like a trend in the opposite direction when zoomed in is just one example of a fractal pattern. Fractals can also be the exact same pattern in the same direction, just at a lower level.
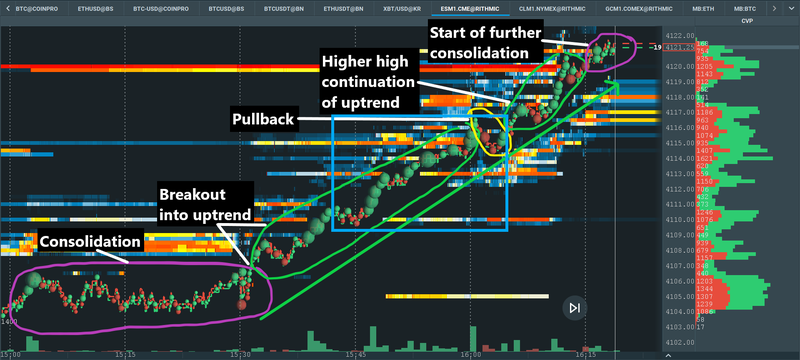
Fig 4 – Looking at real markets, here we see a 1 hour pattern of an uptrend on the ES.
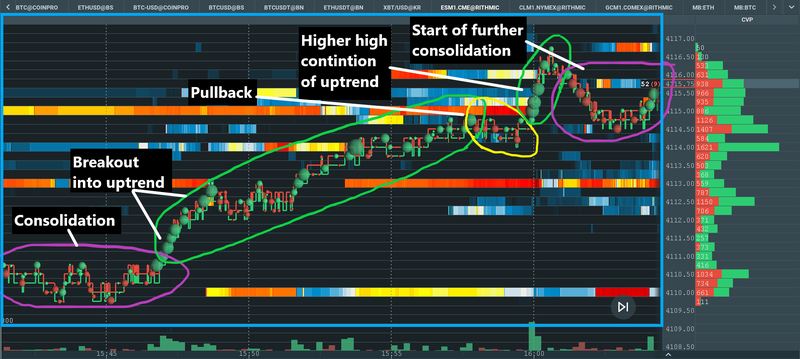
Fig 5 – Zooming into the blue rectangle, we see a 20 minute self-similar uptrend pattern within the same 1 hour uptrend on the ES.
In a nutshell, fractals are simply any similar-looking order flow behaviors that connect across time frames.
Improving Risk/Reward: Following The Trend
Imagine the market you are trading is down double figures on the day. That would be a memorable trading session for day traders, and could be potentially catastrophic if they are caught on the wrong side and have poor risk management skills. But that exact same move for a swing trader would just be another manageable fluctuation in the market, and could possibly even go unnoticed within the context of a greater portfolio. In some sense, trading vastly different time frames across the same instrument is almost like trading a completely different asset—that’s how different the order flow behavior can seem. But when viewing the moves across different time frames as fractal patterns, it is possible to see how they are interconnected.
Seeing the mini-trends within a larger trend can open up another world, and using multi-time frame analysis allows you greater control over your entries and exits. If you first identify the direction on a higher time frame, you can then zoom in and look for a higher probability setup. This doesn’t necessarily mean you always have to follow a trend, since that could mean that the higher probability setup on a shorter time frame could only appear at worse prices (e.g. higher prices in an uptrend). Yet you can’t just enter blindly based on the higher time frame trend either, since your risk won’t be well-defined and you will have to use a wider stop and hence smaller position size. The alternative is to zoom in and have a closer look at the moves within the trend.
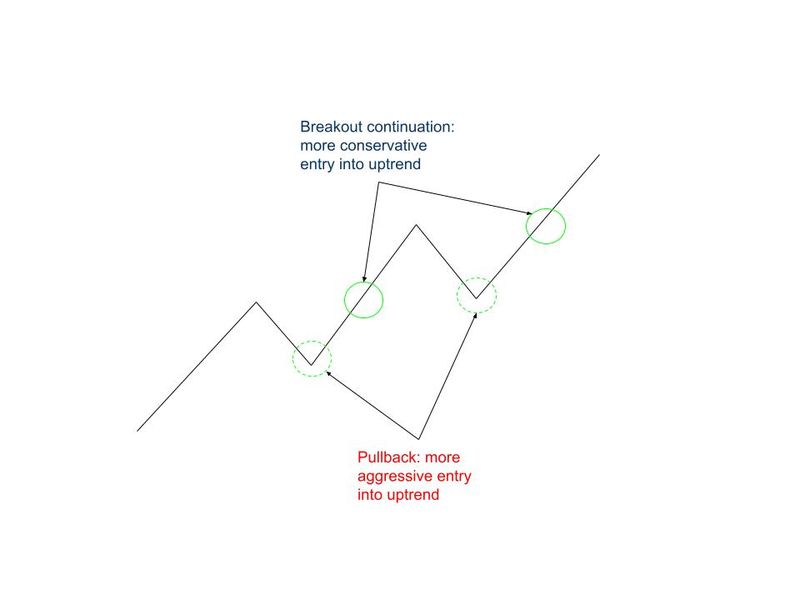
Fig 6 – The two potential entry types: on pullbacks within the greater uptrend, or on a breakout with the printing of a higher high.
There are essentially two ways to join an uptrend as shown above: buying on the pullback or buying on continuation.
Usually, trading on pullbacks is considered a more conservative entry point than breakouts. But in this scenario, buying on pullbacks is considered to be the more aggressive approach, because entry would be taken against the underlying uptrend. Whereas trading on a continuation is more conservative, as you would be entering the trade when the lower time frame aligns with the higher time frame trend.
Let’s have a look at the most aggressive approach on a real chart.
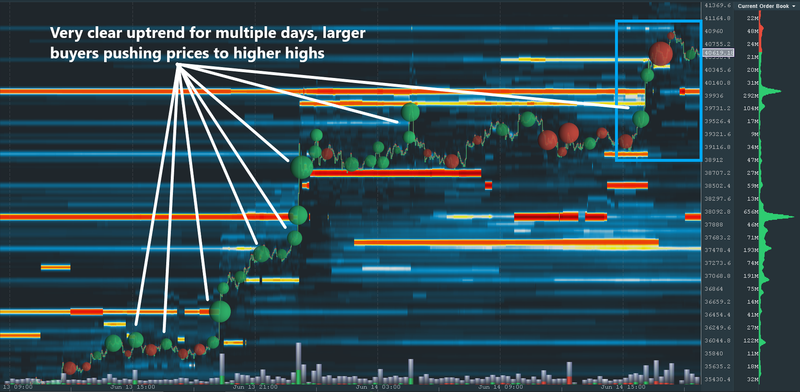
Fig 6 – Bookmap web allows you to view the historical data of crypto pairs as far back as 1 month on a single chart. Here is a view of a BTCUSD uptrend across multiple days.
In figure 6, we can see how prices have been clearly moving higher for days, with lots of strong buying.
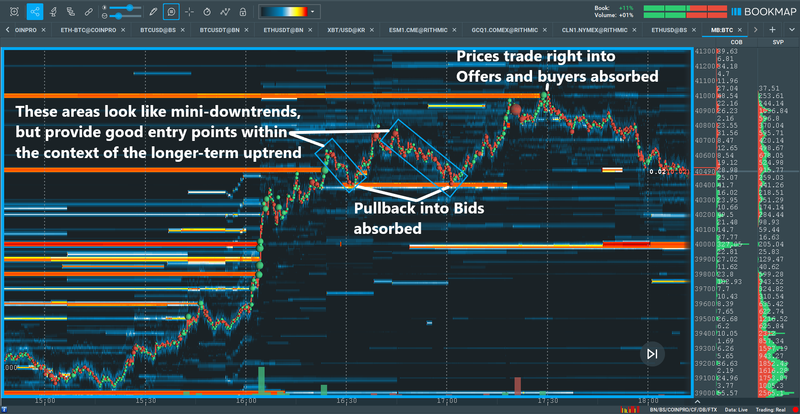
Fig 7 – Looking at a synthetic Multibook instrument of BTCUSD and zooming into the larger blue rectangle, we see the mini-downtrends in the smaller rectangles providing good entry points to get long within the context of the longer-term uptrend.
Zooming in, prices were printing lower lows on the lower time frame. But with the context of the broader multi-day uptrend in mind, a trader can confidently trade against that temporary counter-momentum for a good risk/reward entry point.
Let’s have a look at another bullish example with BTCUSD using Multibook, an addon that displays the order flow and liquidity across exchanges on a single chart.
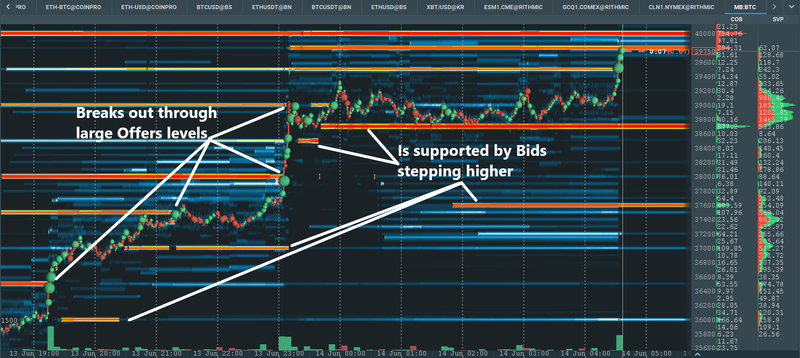
Fig 8 – Multibook of BTCUSD, pair breaking out higher and being supported by Bids progressively stepping higher.
Looking at a Multibook of BTCUSD above, we can see how prices on a higher time frame are consistently printing higher highs, ploughing through large Offers levels as Bids come in progressively higher to support the move.
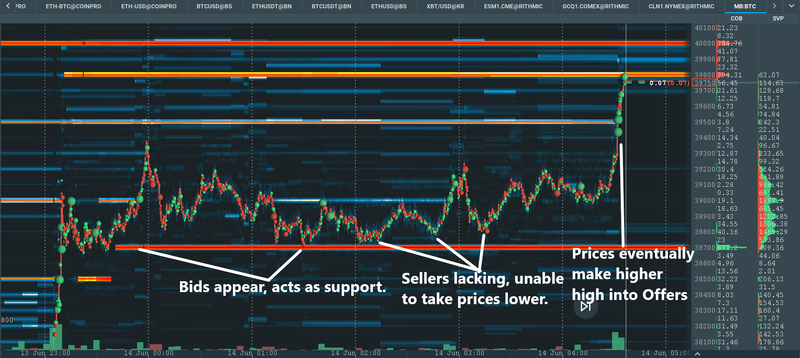
Fig 9 – Zoomed in, we can see how the relatively new Bids level supports price and how sellers are unable to take us lower. Hence, we have only one direction to go – higher into the Offers.
Trading this uptrend by zooming in on a lower time frame and buying right at the Bids would be similar to the first, more aggressive approach as described earlier. This is because on this lower time frame, the momentum seems to be stalling and the pair is printing lower highs and lower lows (until the big breakout after, but that’s in hindsight). But since we have the context of the higher time frame and know that this uptrend is strong, we can have confidence in the Bids supporting prices, placing our protective Stop behind the level and targeting a break higher for a juicy risk/reward ratio on the trade.
The more conservative approach would be to wait for higher highs on this lower time frame, trying to get in on momentum for a break higher. The downside to this approach is that you would be trading close to some light Offers, which could temporarily stall prices and knock you out of the trade for a small loss before prices eventually break out.
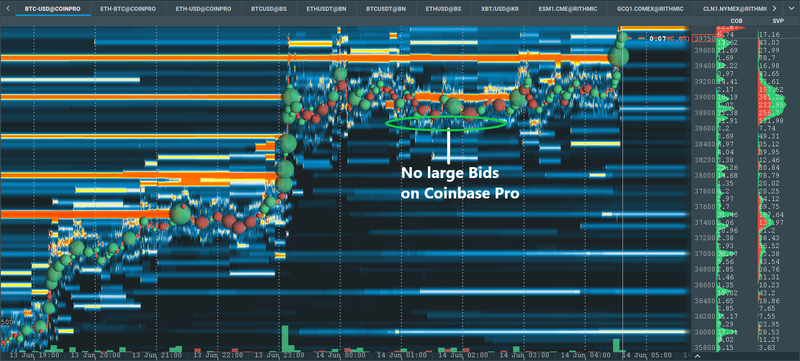
Fig 10 – Viewing the same move on just the Coinbase Pro exchange misses the potential entry signal, highlighting the advantages captured by the multi-exchange view of Multibook.
Either way, viewing not just more time frames but also more exchanges can give you extra context and greater insight into market participant’s trading patterns. Multibook works not only with cryptocurrencies, but with futures and stocks too. And when it comes to trading fractals, that extra bit of information could make all the difference.
Improving Risk/Reward: Playing The Reversal
Multi-time frame analysis isn’t only for following broader trends, though. A trader could also look for reversals, identifying large support/resistance zones or areas where momentum looks to be fizzling out, and then going down to a lower time frame to gain conviction on the trade.
With this in mind, the more aggressive approach would be identifying a large support/resistance level and/or stalling momentum on a higher time frame, and trading off a lower time frame support/resistance level or the breakout of a range. This approach means you are going with the immediate momentum, which the trader is hoping will crossover into the higher time frame as the market reacts to the large resistance level.
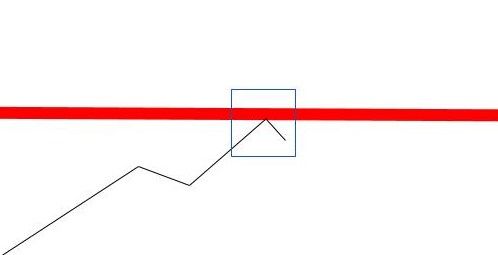
Fig 11 – Hypothetical view of how prices might look trading into a resistance level of large Offers.
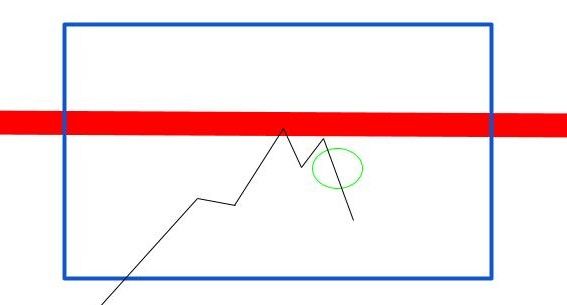
Fig 12 – Zooming in, we see a rejection after testing the Offers resulting in prices failing to make a higher high, and soon after printing a lower low.
Using a lower time frame to fine tune your entry point can greatly increase the risk/reward ratio for the trade. The higher time frame might just look like prices are temporarily stalling, but zooming in and entering on the break of a lower low gives you the opportunity of potentially catching a reversal at a very good price. Let’s see an example on a real chart.
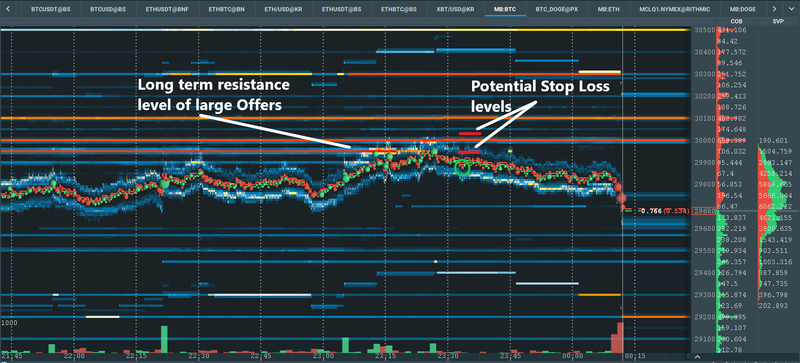
Fig 13 – Synthetic Multibook of BTCUSD.
In figure 13, we see how buyers pushed prices into a long term resistance level of large Offers. The level was tested multiple times, and on the last attempt the level was completely consumed. However, the buyers lacked momentum to continue pushing higher and prices dropped. The green circle shows the area of entry for trading with this kind of approach, where prices print a lower low.
There are essentially two options for getting out if the trade fails, and that is putting your stop just above the lower high (more aggressive), or putting it behind the Offers/resistance (decreasing the max position size you can use). If you prefer to average in and out of positions, you could have a stop for one portion of the trade at the more aggressive lower high, and close the rest of the position if prices break the resistance level. It all depends on your particular style of trading.
In this case, the red lines show areas that would make sense for buy stop loss placement. The slightly lower stop loss would be just above the lower high, and the second would be behind the remaining large Offers at 30,000.
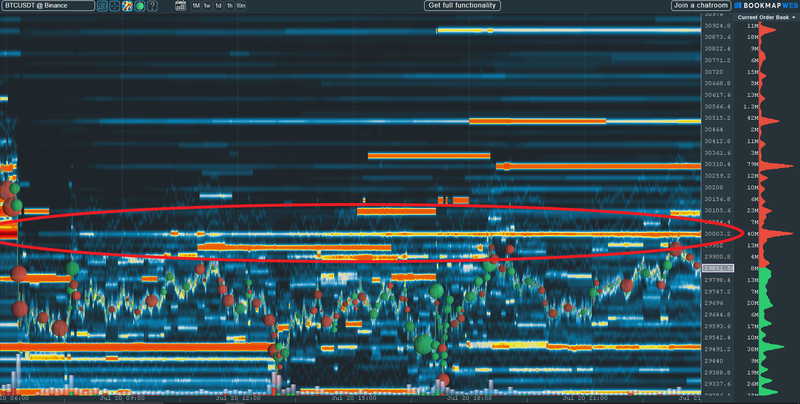
Fig 14 – Long term view of the above trade. Traders front run the confluence of large Offers, support-turned-resistance, and a psychological round number.
Explore Fractals Further
This article only scratches the surface of using fractals in trading. There are countless approaches to using them in trading strategies. At Bookmap, we are always discussing interesting topics like this in our community.
Why not join in on the conversation on the Bookmap forum and Discord chatroom? The Bookmap community is free and open to all, and is a great place to communicate with, and learn from, other like-minded traders.
Sign Up Now