See order flow more clearly in real time.
Compare plans to access deeper market visibility for order flow.
Education
December 26, 2025
SHARE
Trading Tariff News with Order Flow: Reading Market Reactions in Real Time
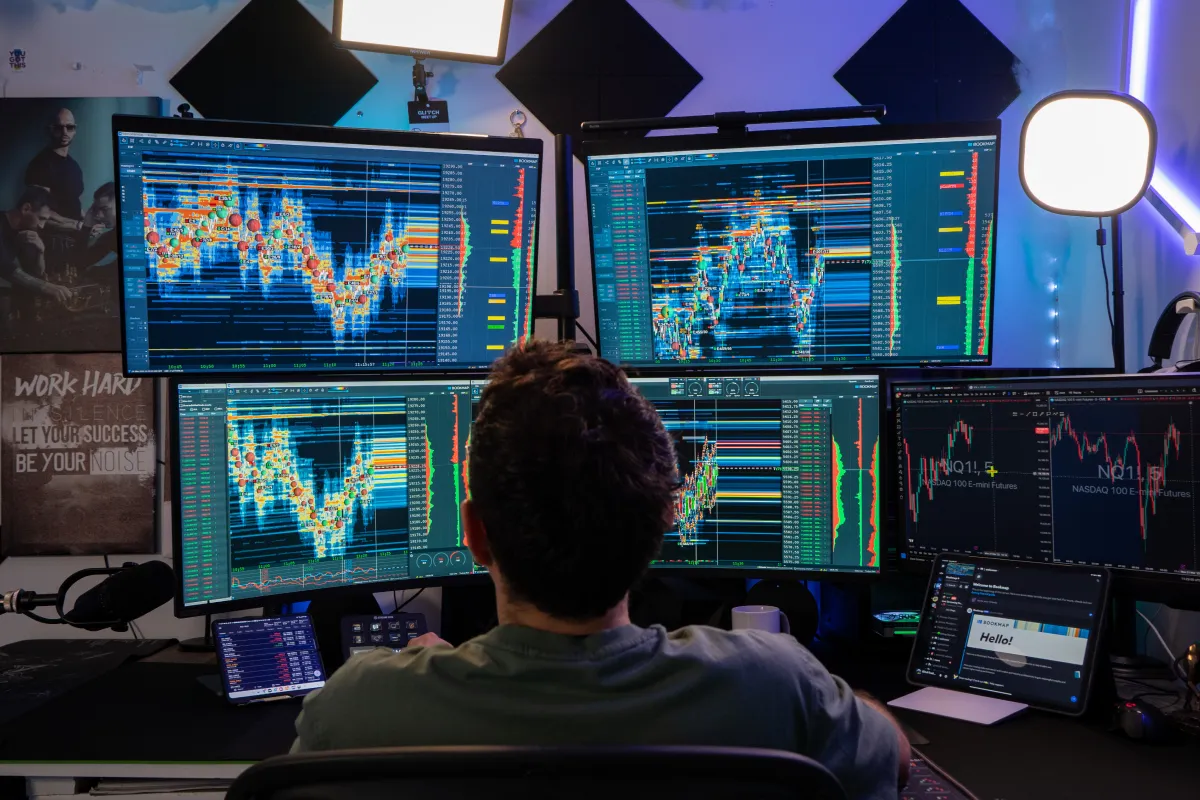
Did you know? When tariff headlines hit, the market can explode in seconds. Yes, that’s because during these times, algorithms jump in and traders chase the move. The result? Before most people can even react, the opportunity is already gone, or the price starts reversing. That’s what makes news trading so tricky.
So, how can it be made easy? Stop guessing what the headline will say. Instead, you should try to understand how the market will respond to the moment new information appears. This estimation can be made by tracking order flow, which gives you that inside view. Order flow shows you when liquidity disappears, when large players are absorbing, and where traders are getting trapped.
Want to learn how to approach tariff-related news step by step? Read this article to understand how to prepare before the release, read the chaos right after the headline, and identify when volatility turns into a structured opportunity.
Why Tariff News Creates Extreme Order Flow
Tariffs change real economics. Tariffs affect companies’:
- Costs,
- Supply chains, and
- Export/import volumes.
All these factors change profits and expected cash flows. As a result, the price levels that looked “fair” suddenly aren’t. This information is more than just a headline, as it alters how participants perceive and value assets.
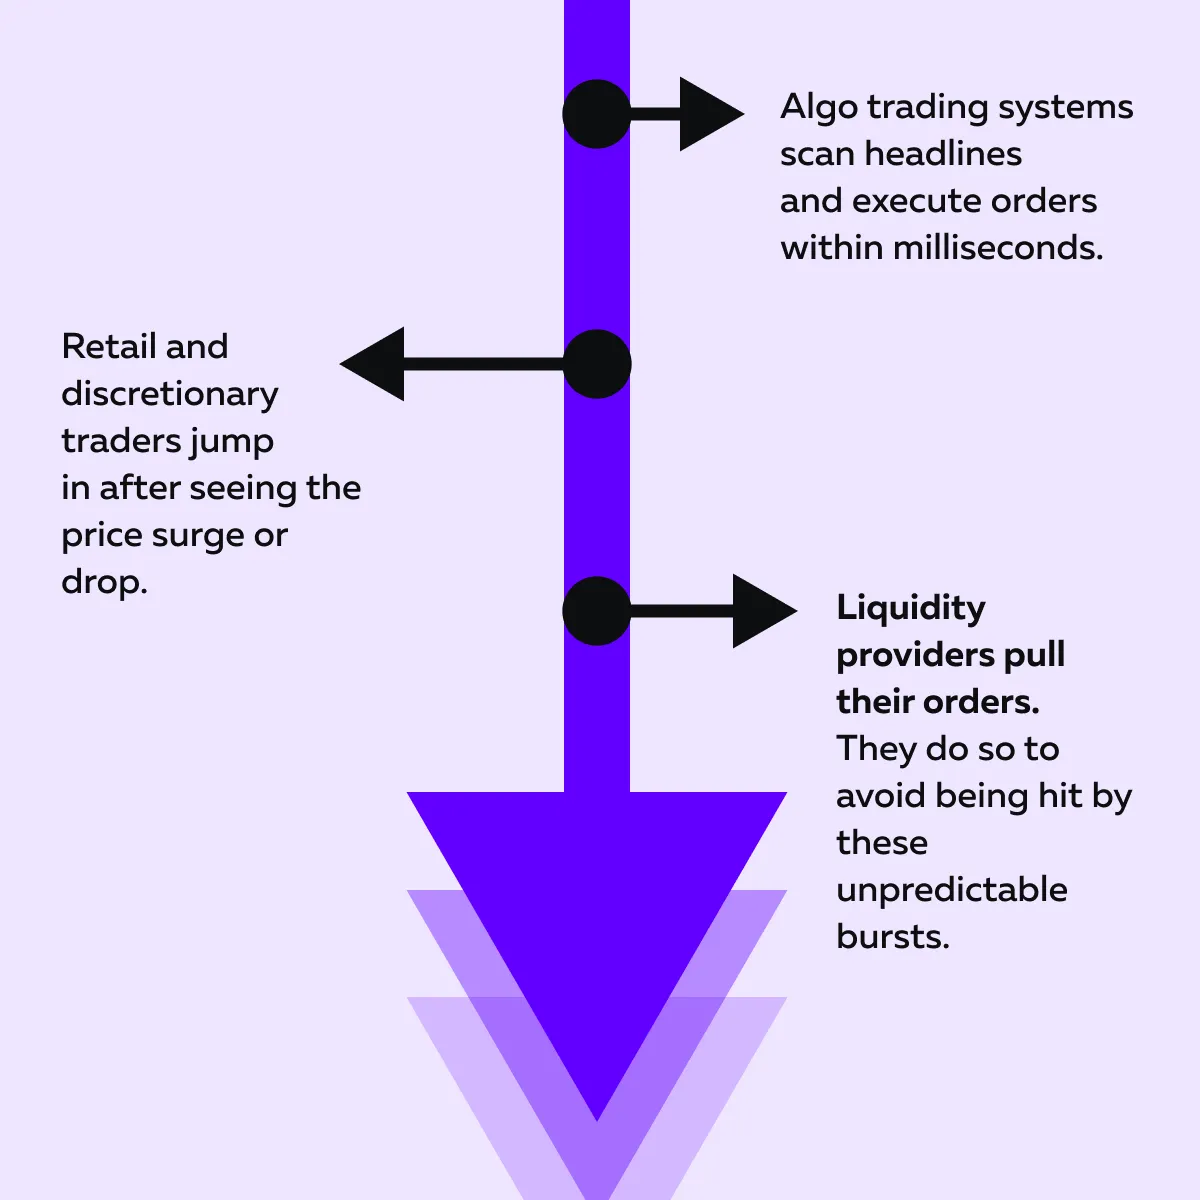
In response to this information, several major players react instantly. Most institutional desks, hedge funds, and algos monitor news and risk models 24/7. When tariff news drops, they often reposition immediately as follows:
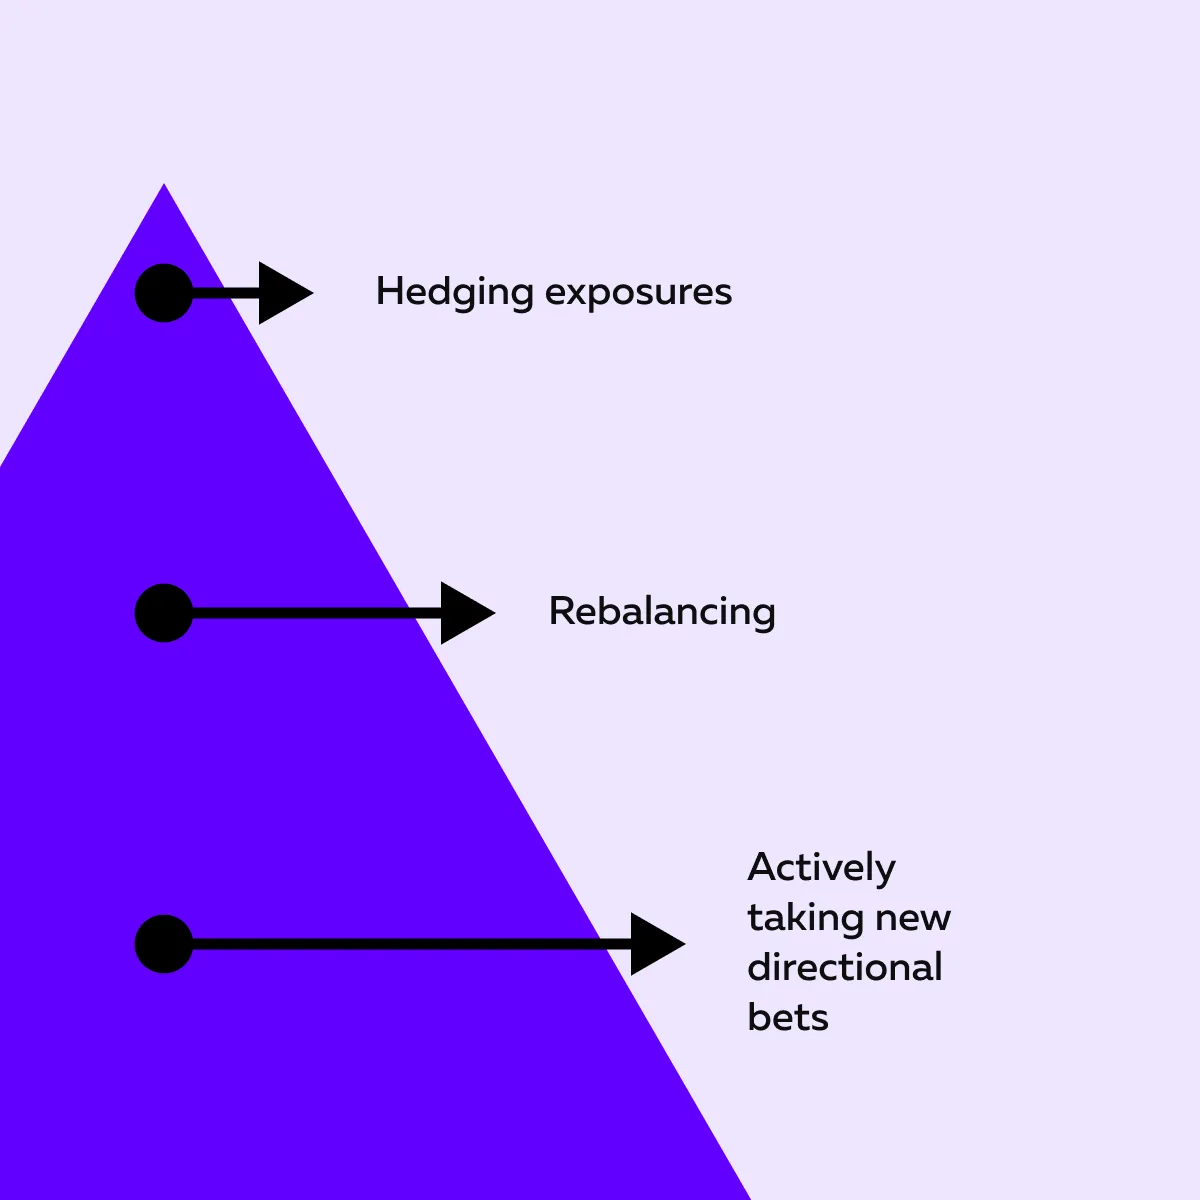
The impact? Such concentrated and rapid activity creates extreme order flow.
How Does Order Flow Actually Show That Happening?
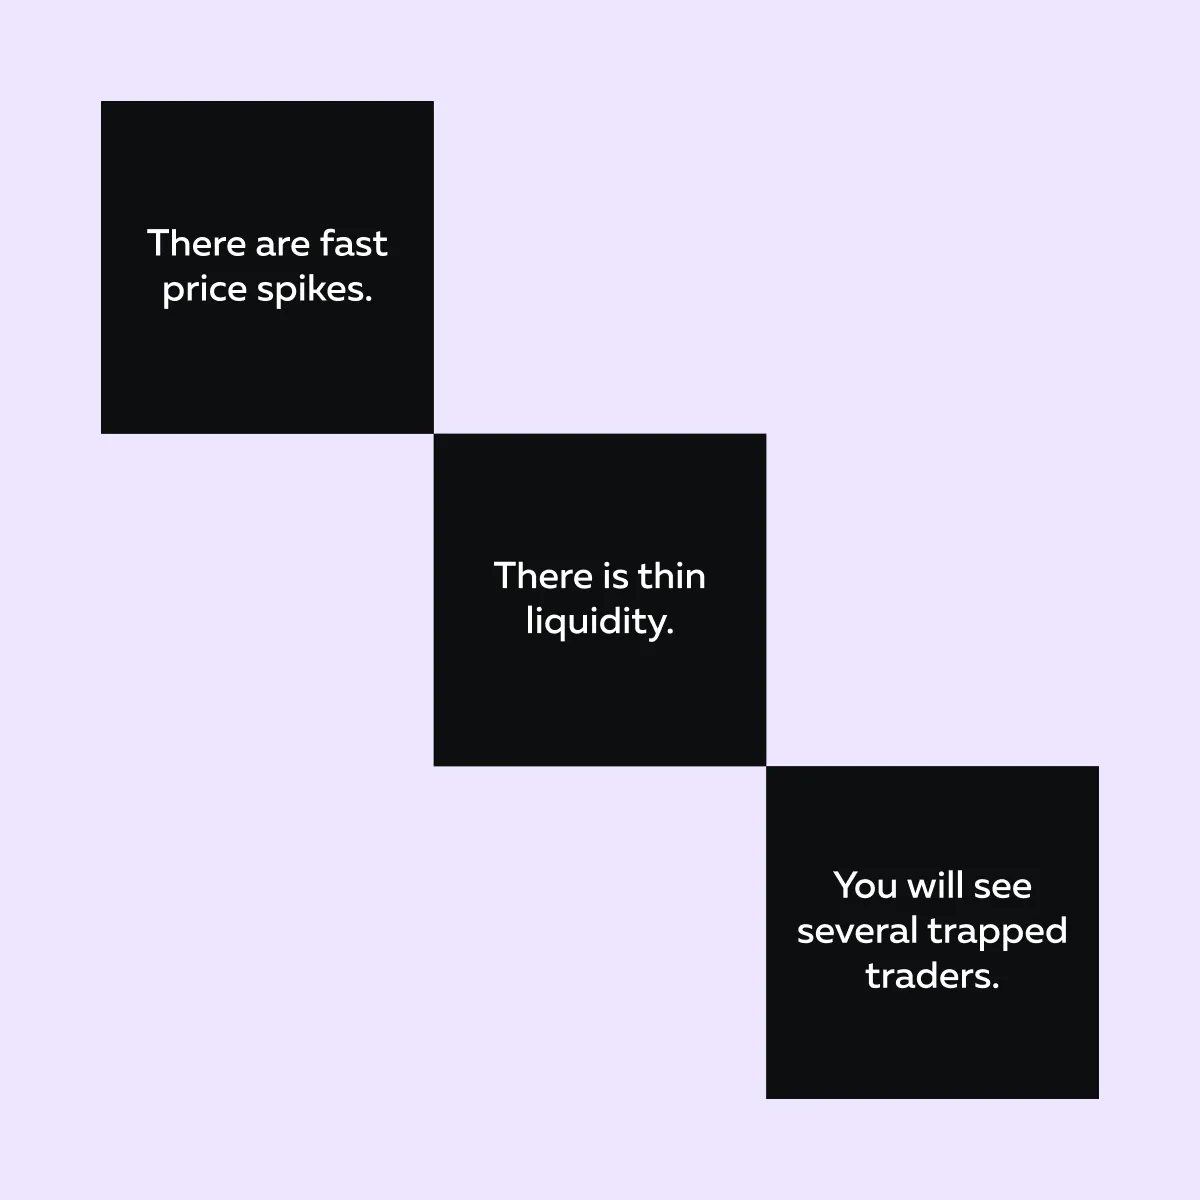
Be aware that liquidity tends to thin out before major announcements. Market makers and passive liquidity providers pull back to avoid being picked off. Additionally:
- The order book displays fewer resting limit orders (a thin book) around the current price.
- Aggressive bursts of market buy and sell orders hit the tape.
- Absorption zones form as large players seek to avoid moving the market, place icebergs, or post visible orders that absorb the order flow.
Bookmap’s heatmaps show these as “concentrated liquidity areas”. In these areas, aggressive order flow either slows or reverses. Now, this signals that someone is “taking” the other side of the trade.
Tom B. took an example to explain this scenario in his session. Let’s study it:
- A positive tariff rumor causes ES futures to spike upward.
- But liquidity above the spike is thin.
- There are a few resting bids and asks.
- Thus, the initial spike is easy to create.
Now, as the price reaches that thin area, big players first remove liquidity by pulling resting offers and then place absorption limits or iceberg orders. Bookmap users watching the heatmap notice the gap between aggressive prints and real resting liquidity. This observation provides them with an early indication that the move may lack follow-through.
- When those absorption limits hold, the price reverses sharply.
- That reversal signals to traders that the spike is more a result of noise than conviction.
Trade news reactions by reading liquidity, not headlines → Compare Packages.
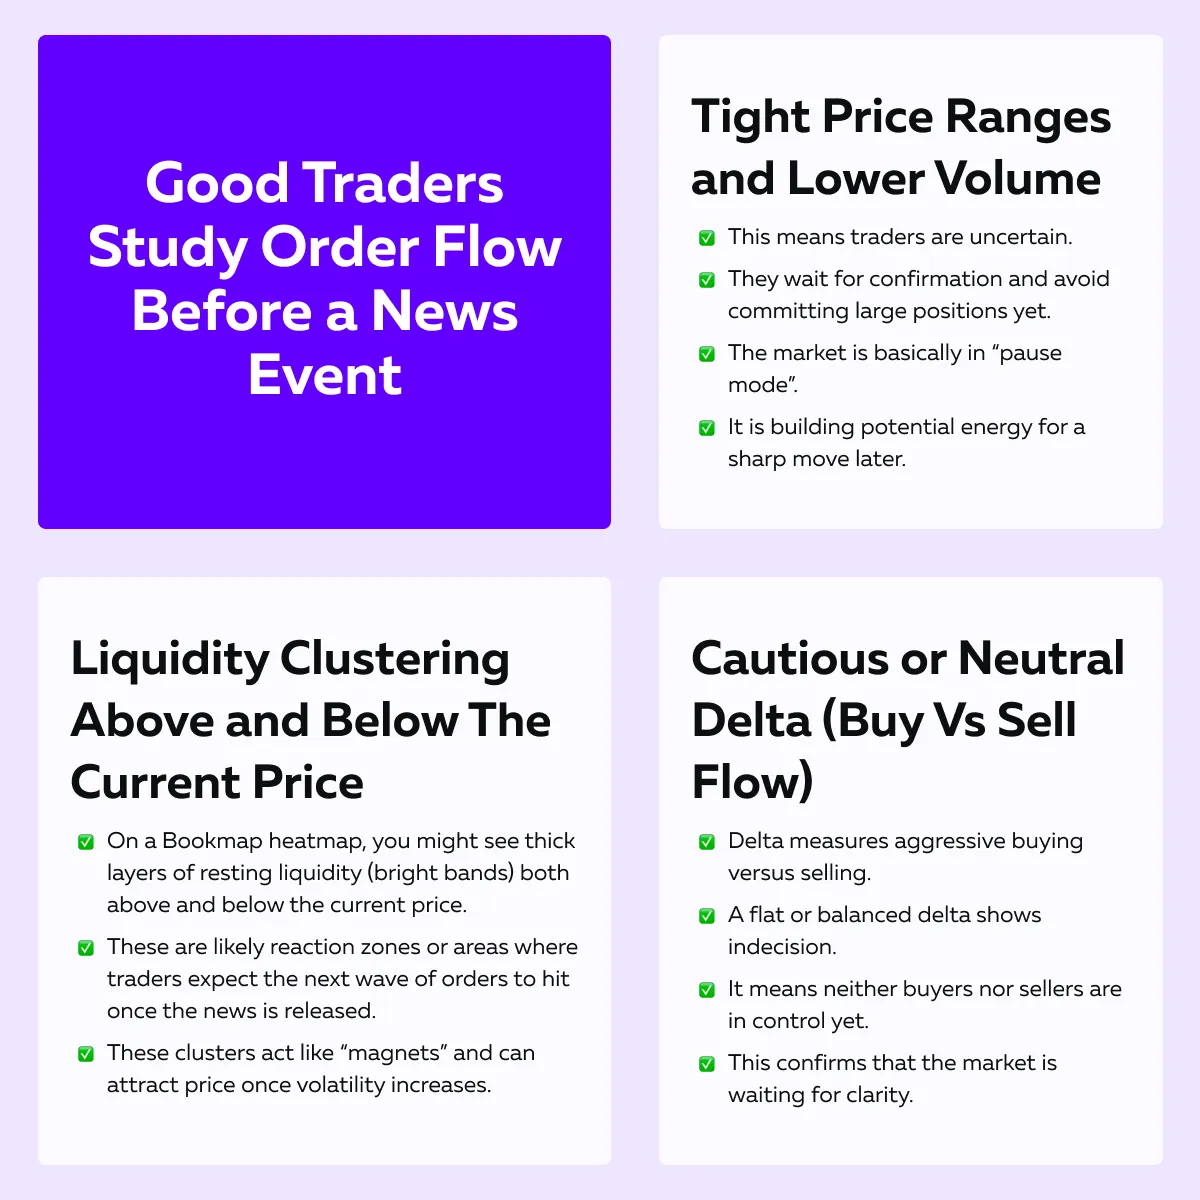
Pre-Event Positioning: How to Prepare for the Release
When you trade news with order flow, the real preparation happens before the headline drops. Good traders don’t guess what the news will be! Instead, they study how other participants are positioned in the hours leading up to the event. Let’s understand how this happens:
See real-time market reactions with Bookmap’s order flow visualization → Compare Packages.
How to Read the Clues (Bias Scenarios)?
Remember, your goal isn’t to predict the headline. Instead, it is to anticipate the reaction path. Watching how liquidity moves just before the release helps you form scenario-based plans. Let’s see how:
| If Liquidity Starts Pulling Above The Current Price | If Liquidity Builds Below The Current Price: |
|
|
To execute this successfully, you can use Bookmap to monitor liquidity behavior. Using it, you can easily see where orders are stacking or being pulled. Next, you can plan your scenarios as follows:
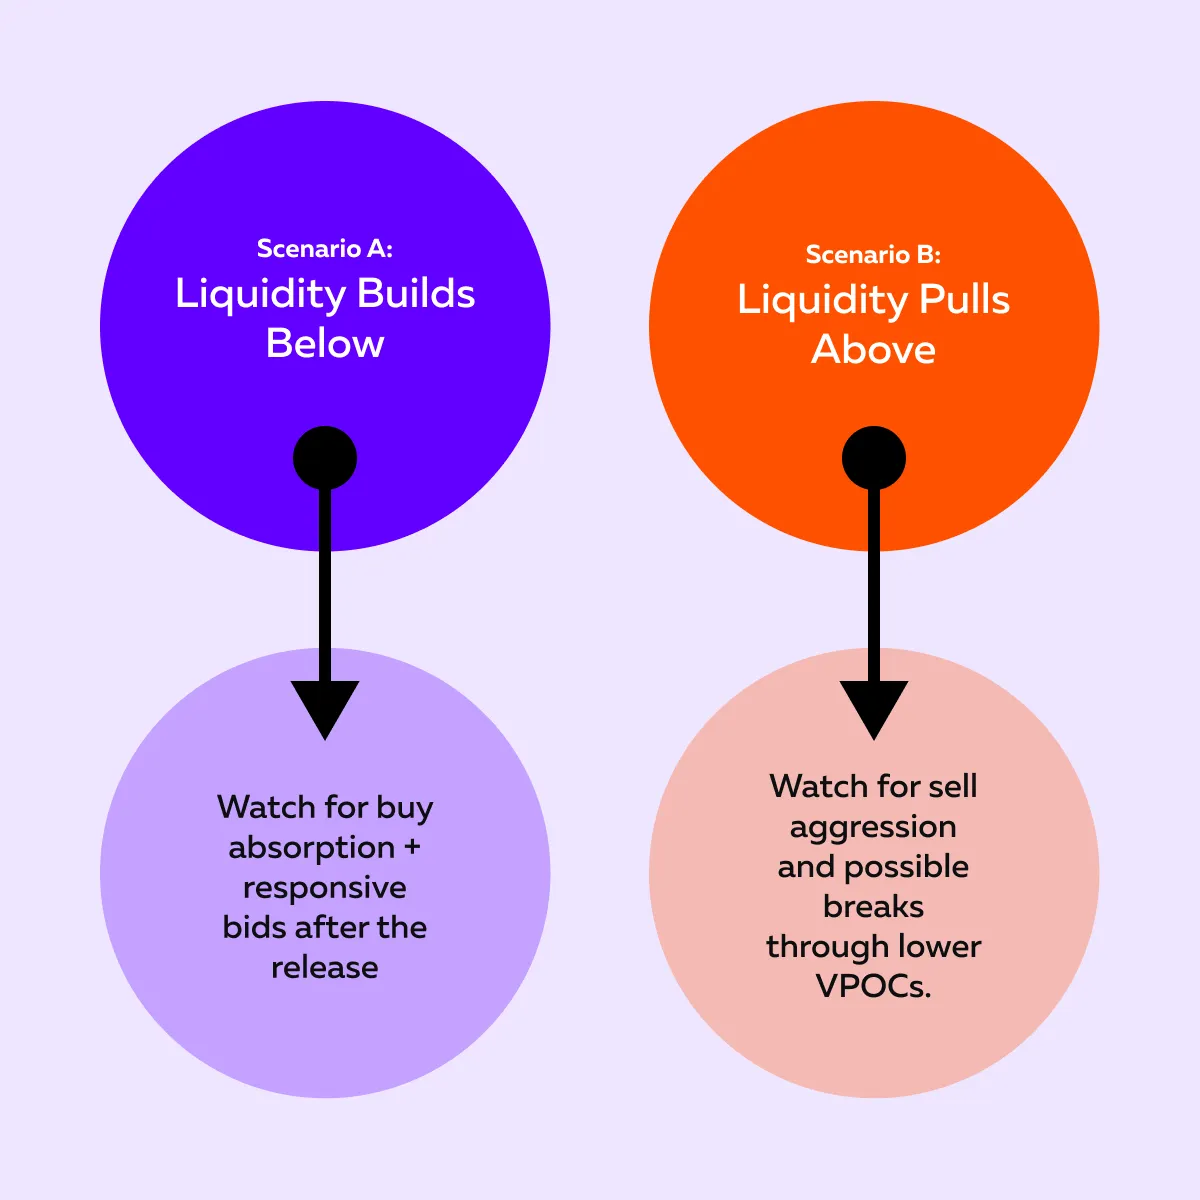
Additionally, set alerts and wait for confirmation from the order flow once the headline hits. Don’t pre-emptively enter positions on assumption. Identify reaction zones before news hits using real-time order book data → Compare Plans.
Reading the Initial Reaction
When trading news with order flow, the first few seconds and minutes after a headline are crucial. That’s because algorithms and large participants react instantly when tariff-related news breaks, such as a new tariff increase or rollback. Let’s explore how this happens:
All this creates temporary chaos! As a trader, you will see unusual candles, sudden spikes, and huge prints on the tape. During this first reaction, you must watch for these three key elements:
1. Speed of Trades (Aggression Without Support)
Let’s say you see a sudden burst of market orders (aggressive buying or selling), but the order book is thin. Now, this usually means momentum without real backing. On Bookmap, this looks like rapid trade prints with little visible liquidity (few bright layers).
Such momentum usually reverses quickly because it is driven by:
- Short-lived emotion
or
- Algorithmic overreaction
These are not genuine repositionings from big players. These moves, often referred to as “emotional flow” by Tom B., may appear strong but are structurally weak.
2. Liquidity Pullback (Vanishing Orders)
Next, watch what happens to resting liquidity (limit orders) during the first burst. If you see liquidity disappearing from one side of the book (for example, bids vanish below the price), that side of the market no longer supports the move.
This lack of opposition leads to exaggerated price movements. Due to this, price can travel far with very little volume because the other side has stepped away. However, once liquidity reappears, it often signals the emotional move’s end. Trade news with clarity, not chaos → Compare Plans.
3. Absorption (Hidden Opposition)
Absorption is one of the most important order flow concepts. It happens when aggressive traders keep hitting the market, but the price fails to move further. But why does this happen? That’s because a large player (or multiple players) is:
- Absorbing the flow
and
- Quietly taking the other side through iceberg or layered limit orders.
On Bookmap, you’ll see heavy trade volume hitting a price level. And then, price stalls or bounces despite continued aggression. Interpret this as a sign of “strong opposition” and as the first clue of a likely reversal.
An Example to Further Your Understanding

Tom B. explains in his session that during a tariff escalation headline, ES futures spiked upward as buyers chased the news. On the heatmap, you could see a wall of green prints as aggressive buyers jumped in. But just a few ticks higher, Bookmap revealed massive absorption. There was large sell liquidity quietly taking the other side.
The result? Within seconds:
- The buying stopped,
- The absorption held, and
- The market reversed sharply.
Traders who entered impulsively on the headline got trapped at the highs. Meanwhile, traders watching order flow on the Bookmap waited and refrained from trading.
Post-Event Structure: When Volatility Becomes Opportunity
After major tariff headlines hit, the first few minutes are full of emotional and algorithmic reactions. You will often notice the following:
However, once the first wave of aggressive trading subsides, markets begin to rebalance. Liquidity providers and larger participants return. They start creating new zones of interest. At this stage, you’ll often observe three clear signs in the order flow:
Sign I: Absorption Stabilizes
The market reaches a level where volume remains steady, but the price stops moving sharply. This means:
- Buyers and sellers are back in agreement,
and
- A new “fair value” is emerging after the emotional move.
On Bookmap, this appears to be a “dense cluster of trades” where the tape slows down and the price holds steady. In auction market theory, this forms a new balance area, which serves as the basis for the next structured trade.
Sign II: Liquidity Reforms
As volatility cools, new resting orders start appearing above and below the new range. Let’s see how you can interpret them:
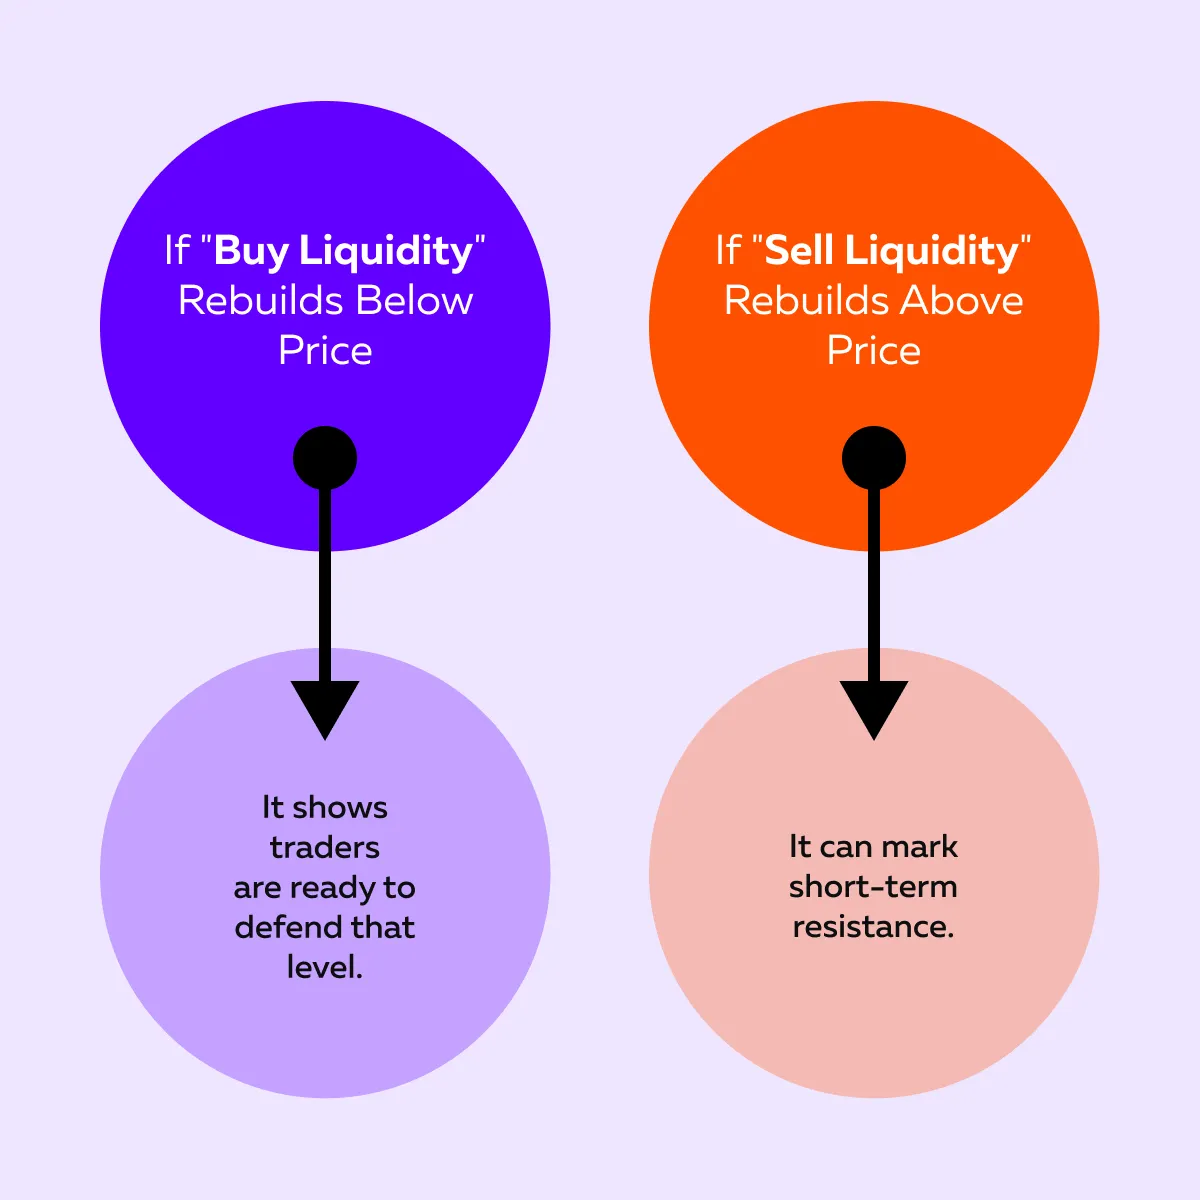
Now, these are your new reference levels. You can refer to them to decide on your entry, exit, and stop zones.
Sign III: Delta Confirms Direction
By watching the delta, you can confirm whether real participation is joining the move. Let’s see how:
- Let’s say delta turns positive after a selloff. Now, it means buyers are stepping back in.
- On the other hand, let’s assume that delta stays negative, and the price holds steady. This means that selling pressure remains dominant.
By making such an interpretation, you can easily see whether the market is preparing for continuation or reversal.
For More Clarity, Let’s Study Tom B’s Tariff Example.
The price first spiked sharply when the headline hit. Many traders chased that move as they thought it signaled new momentum. But as the excitement faded:
- There was increased selling pressure,
and
- The market pulled back toward the earlier range.
Now, once that initial volatility cooled off, something important appeared on the order flow:
- Buyers began rebuilding liquidity.
and
- New buy orders were stacking at lower prices.
This shows that participants were now willing to step in and support the market. As sellers continued to hit the tape:
- Their aggression slowed,
and
- Volume increased.
However, the price stopped falling! That signaled “exhaustion,” which is the point at which sellers ran out of strength. This combination of fresh liquidity forming under price and absorption of selling created a structured continuation setup. Once the last wave of sellers finished:
- Buyers took control again,
and
- The market resumed upward.
So, what can you learn from this example? Waiting for the post-news structure gives you clarity and control. When the dust settles and liquidity reforms, you can start trading with confirmation and execute profitable trades.
Case Study: Tariff Reversal on ES Futures
- Want to learn how order flow reveals the real story behind what looks like a normal price breakout?
- Want to learn how to use Bookmap to see the reversal building long before it appeared on the price chart?
Read this case study:
1. Before the News
Before the tariff announcement, the ES market was in a tight trading range. Liquidity bands were visible both above and below the current price, which means:
- Buyers and sellers were balanced,
and
- Waiting for new information.
Additionally, volume was steady but not aggressive. Be aware that this kind of structure is common before major economic or trade-related headlines.
2. Headline Hits
The tariff-related news or rumor appeared. It indicated that the trade tensions might be easing. In response, the automated trading systems (algorithms) immediately started buying. As a result:
- ES futures spiked upward within seconds.
- The tape showed a surge in aggressive buying.
- Price jumped several points almost instantly.
To an untrained eye or a price-action trader, this looked like a breakout. They thought it was a confirmation that the market was going higher. But what happened next told a different story!
3. Liquidity Disappears (It’s a Warning Sign)
As the spike extended, liquidity vanished from the order book. Bids below the price were pulled, which means no real support remained if the move failed. Now, this is a classic “liquidity vacuum”. In it, price moves fast because there’s nothing left to trade against.
For order flow traders, this is an early red flag. When aggressive orders push through empty liquidity, the move is fragile. It often reverses just as quickly as it started.
4. Absorption Appears
Besides the disappearance of liquidity, absorption also starts to happen a few ticks above the new high. On Bookmap, you could observe the following:
- Heavy sell imbalances appeared at the top of the spike.
- Large limit sell orders absorbed the buying pressure (without allowing the price to continue rising).
- Despite a strong buying delta, the market stalled.
Now, this was the turning point! Absorption means that big players were using the buying frenzy to offload positions. It is the opposite of what retail traders thought was happening.
5. The Reversal
Later, once the buyers ran out of fuel, the market snapped back. Price fell sharply due to the absence of:
- Resting bids below
and
- Absorption capping the top.
As a result, the price returned to its pre-event range within minutes. The same traders who chased the breakout were now trapped.
Watch liquidity shift live during major announcements → Compare Packages.
Conclusion
Till now, you must have understood that trading tariff or macro news isn’t about guessing the headline. Instead, it is about reading the market’s reaction intelligently. When the news hits, you, as a trader, should focus on order flow (not emotions).
That’s because order flow reveals:
- Where real buyers and sellers step in,
- Where liquidity vanishes, and
- Where momentum is likely to fade.
Such knowledge allows you to spot genuine opportunities instead of noise. Furthermore, to gain 100% trading clarity and edge, you can start using Bookmap. It lets you visualize liquidity, absorption, and delta in real time. So, don’t try to outguess the news. Read the reaction. Start observing real-time order flow reactions during major events → Compare Packages.
FAQ
1. How do you trade news events without getting caught in fake moves?
Avoid jumping in on the first spike. That’s because it is usually influenced by algorithms and emotion. Let the initial reaction settle, and then watch for absorption or liquidity rebuilding on Bookmap.
These signals show when the market finds balance again and let you trade with structure instead of noise.
2. What’s the best way to prepare for tariff or macro announcements?
Plan ahead. As a trader, you should:
- Mark important liquidity zones above and below the current price
and
- Build both bullish and bearish scenarios.
That way, no matter which direction the headline moves, you already know where the price is likely to react and where safe entries may appear.
3. How can order flow help during high volatility?
Using order flow, you can see what’s really driving the move. It shows whether strong price swings come from real buying and selling or just short-term emotion.
Furthermore, when you spot aggressive traders failing to move the price, interpret it as a sign of exhaustion and a possible reversal.
4. Can Bookmap help manage risk during news trading?
Yes, using Bookmap, you can visualize live liquidity and absorption. It lets you see where the market is likely to pause or reverse. This knowledge allows you to:
- Time your trades better,
- Avoid chasing fake breakouts.
- Manage risk based on actual market behavior.
Sign Up Now