See volume profile more clearly in real time.
Compare plans to access deeper market visibility for volume profile.
Education
September 21, 2024
Updated
SHARE
Volume Profile & Order Flow: Tools for Deep Market Insight

In today’s trading world, making informed decisions is more important than ever. To do this, traders often turn to powerful tools like Volume Profile and Order Flow analysis. These tools shed light on what’s happening behind the scenes in the market.
Let’s dive into the essence of Volume Profile and Order Flow and see their transformative impact on trading strategies.
Volume profile trading focuses on understanding how volume price analysis reveals where market participants are most active. By studying how volume accumulates at specific price levels, traders gain insight into supply and demand dynamics that are not visible on standard price charts alone.
Understanding Volume Profile
Volume Profile is an advanced market analysis technique that allows traders to visualize the distribution of trading volume across various price levels over a specific time period.
A careful analysis helps traders gain valuable insights into the supply and demand dynamics in the market, helping them pinpoint:
- Key levels of support and resistance
- Potential price reversal points, and
- Zones of high trading activity
At its core, volume profile trading helps traders identify areas where price is accepted or rejected. These zones often align with high-volume nodes and value areas, which can influence future price behavior as the market revisits them.
Volume Profile isn’t a solo act; it is often used in conjunction with price charts to enhance trading decisions and gain a better understanding of market behavior.
Market Profile vs. Volume Profile
Market Profile and Volume Profile are both used to analyze market structure, but they focus on different elements:
- Market Profile visualizes the distribution of trades over time, often using a TPO (Time Price Opportunity) chart to show where price spent the most time during a trading session.
- Volume Profile, in contrast, focuses solely on volume traded at different price levels, regardless of time, offering insights into liquidity and key trading zones.
Key Differences Between Market Profile and Volume Profile
| Feature | Market Profile | Volume Profile |
|---|---|---|
| Focus | Time-based price distribution | Volume-based price distribution |
| Key Tool | TPO Chart | Volume Footprint Chart |
| Best For | Identifying value areas based on time | Spotting high and low volume zones |
| Common Use Case | Analyzing auction market theory | Finding liquidity pools and trade execution zones |
This distinction is important when applying auction market theory. Market Profile charting emphasizes time spent at price to define value, while volume profile focuses on where real participation occurred. Many traders use both approaches together to understand how auctions form and where meaningful trade execution takes place.
While Market Profile emphasizes where price has spent the most time, Volume Profile identifies areas where significant trading activity has taken place, making it an essential tool for understanding order flow and liquidity zones.
What is the Difference Between Market Profile and Volume Profile?
Market Profile and Volume Profile, while related, focus on different aspects of market analysis. While both methods provide insights into market dynamics, Volume Profile focuses exclusively on the relationship between price and trading volume.
Market Profile focuses on the time at which trades occur. It creates a visual representation of the price distribution based on periods, usually within a single trading day.
On the other hand, Volume Profile emphasizes the volume traded at different price levels, regardless of the timeframe.
How Do Traders Incorporate Volume Profile in Market Analysis?
Volume Profile is a powerful tool for traders to gain insights into market behavior. It’s often considered a valuable addition to a trader’s toolkit when combined with other technical and fundamental analysis methods.
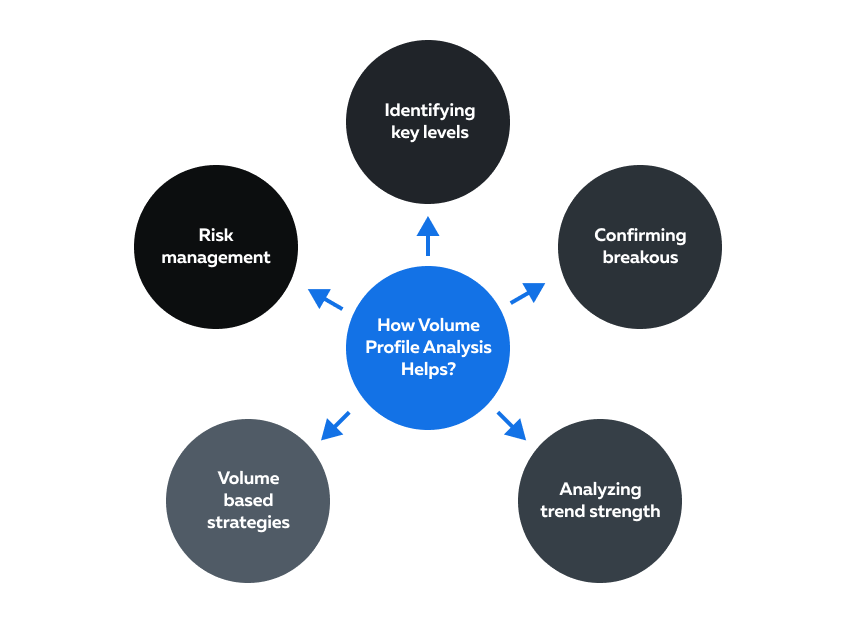
Traders incorporate Volume Profile into their analysis in several ways:
-
Identifying Key Levels:
-
Traders use Volume Profile to pinpoint significant support and resistance levels based on high-volume nodes.
-
These levels can offer valuable insights into potential price obstacles and reversals.
-
-
Confirming Breakouts:
-
Volume Profile can help confirm the strength of a breakout.
-
A breakout accompanied by high volume is often seen as more valid and likely to lead to a sustained price move.
-
-
Analyzing Trend Strength:
-
Traders assess trend strength by observing changes in volume distribution alongside price trends.
-
Consistent volume supporting a trend reinforces its potential for long-term sustainability.
-
-
Developing Volume-Based Strategies:
-
Traders can develop trading strategies that utilize Volume Profile, such as:
-
Trading bounces off high-volume nodes or,
-
Breakouts from low-volume areas.
-
-
Common volume profile strategies include trading value area breakouts, reacting to rejection from high-volume nodes, and targeting low-volume areas where price can move quickly. These approaches rely on recognizing how price responds when it leaves accepted value and enters areas of thinner participation.
-
-
5. Implementing Risk Management:
-
Understanding volume distribution can assist in setting stop-loss levels.
-
Additionally, it helps in identifying potential areas of low risk where price is less likely to retrace.
-
-
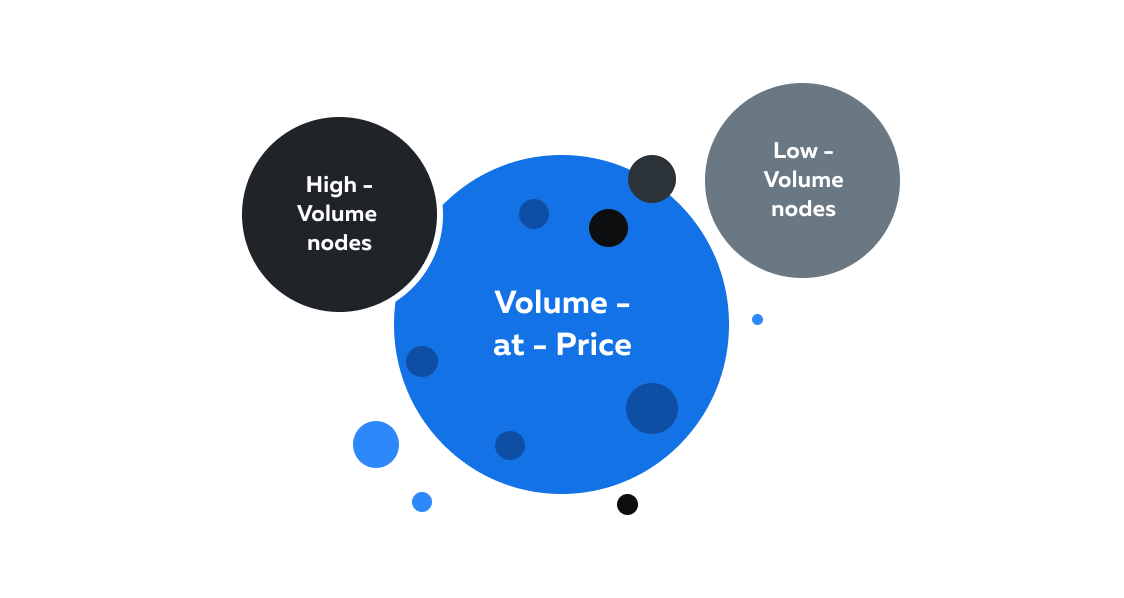
Key Components of Volume Profile
The Volume Profile technique comprises several key components that collectively offer a detailed perspective on:
-
Market sentiment
-
Key levels of interest
-
Potential turning points
Let’s delve into these components, unraveling their significance for traders navigating financial markets.
|
Component |
Meaning |
Practical Application |
|
Volume-at-Price |
|
Through analysis of volume distribution across different price levels, traders can identify significant price levels where:
|
|
High-Volume Nodes |
|
|
|
Low-Volume Nodes |
|
|
How to Leverage Bookmap for Effective Volume Profile Analysis
Bookmap is a market visualization trading tool. It provides traders with a real-time, dynamic, and highly visual representation of market activities making it easier to understand the dynamics of supply and demand. Additionally, the platform is capable of:
-
Displaying limit orders
-
Showcasing evolving volume transactions, and
-
Illustrating the auction process in the order flow
The Practical Application of Volume Profile With Bookmap
-
-
Visualizing Order Flow:
- Bookmap allows traders to see the incoming buy and sell orders as they are executed; granting traders a backstage pass into the market’s pulse.
-
This allows them to witness the live interaction between buyers and sellers.
-
This viewpoint spills the beans on how orders align and how the market crowd reacts at various price levels.
-
-
Depicting Limit Orders:
-
Using Bookmap, traders can observe the limit orders placed in the order book and how they interact with the executed market orders.
-
This provides crucial insights into the levels where traders are willing to transact at specific prices.
-
Traders use this information to identify areas of potential support and resistance.
-
-
Dynamic Volume Profile:
- By adjusting session ranges and visible history, traders can apply fixed range volume profile analysis or build composite profiles across multiple sessions. This flexibility allows both intraday and swing traders to study how volume distributions evolve over time rather than relying on static snapshots.
-
Instead of showing historical volume at fixed price levels, Bookmap displays the precise volume of transactions as they occur in real time.
-
This means that traders can see volume building up and fading away as the market moves.
-
It gives a more accurate representation of the evolving volume profile.
-
Identifying Key Levels:
-
Using Bookmap, the high-volume areas and low-volume areas are instantly recognizable.
-
This real-time visualization of data helps traders in:
-
Spotting changes in volume distribution as market sentiment shifts.
-
Identifying potential support and resistance levels for making trading decisions.
-
-
-
Confirming Breakouts and Reversals:
-
Bookmap facilitates traders in observing:
-
how volume responds to price fluctuations
-
whether a breakout is backed by strong volume
-
whether a reversal is occurring due to a significant shift in trading activity
-
-
Reliable answers (which can be found by using Bookmap) to these questions help traders confirm the breakouts and reversals.
-
-
Scalping and Short-Term Trading:
-
Scalpers and short-term traders use Bookmap’s real-time data representation to spot sudden spikes in volume and gauge rapid price movements.
-
This helps them capitalize on quick opportunities that arise due to the fluid order flow.
-
Grasping Order Flow
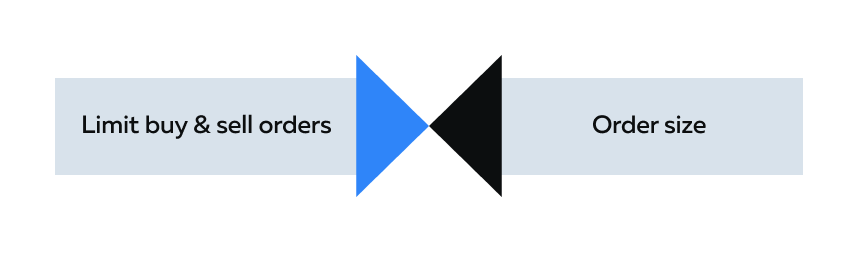
Order flow refers to the real-time stream of buy and sell orders entering the market. It’s the dynamic interaction between these orders that drives price fluctuations. Two key elements of order flow are:
|
Components |
Meaning |
Indication |
|
Limit Buy and Sell Orders |
|
|
|
Order Size |
Order size refers to the number of units or contracts in a particular buy or sell order. |
|
What Insights Do Traders Gain from Order Flow Analysis?
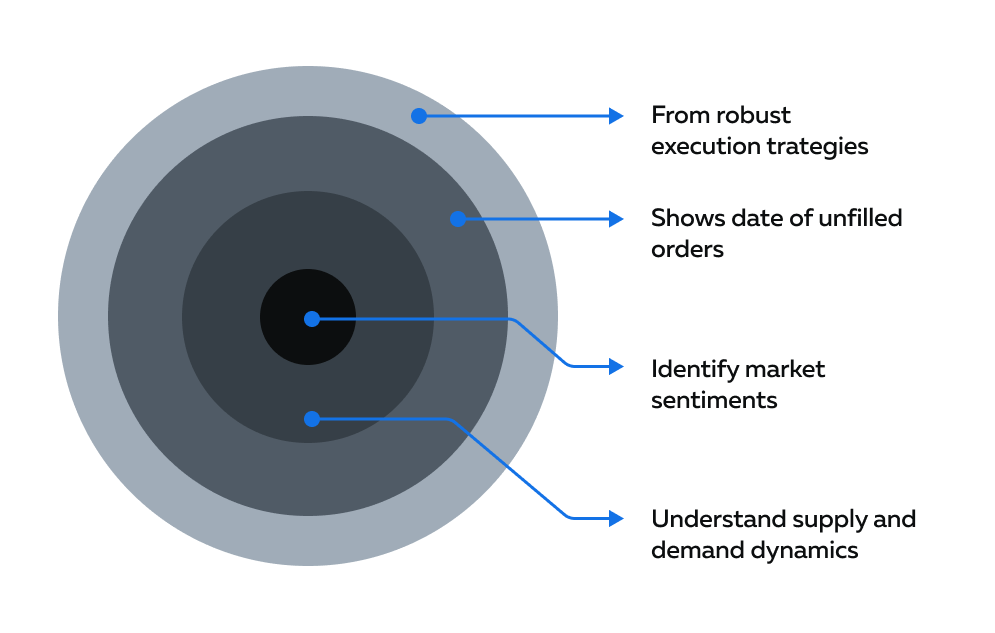
A comprehensive understanding of the order flow analysis offers insights into market participants’ behaviors and strategies. This is how traders leverage this technique:
-
Identify Market Sentiments:
-
A rapid influx of buy orders indicates bullish sentiment.
-
Conversely, an uptick in sell orders suggests a bearish sentiment.
-
-
Understand Supply and Demand Dynamics:
-
Areas with a cluster of limit buy orders act as support levels.
-
Whereas areas with limit sell orders may act as resistance.
-
-
Get Data About Unfilled Orders:
-
Unfilled limit orders in the order book signal potential price turning points.
-
These levels represent areas where participants expect the price to reverse.
-
-
Craft Robust Execution Strategies:
-
Observing the speed at which orders are executed can reveal:
-
High-frequency trading strategies
-
Scalping or algorithmic trading patterns.
-
-
Most traders use this understanding to form robust trading strategies.
-
How Does Bookmap Enhance Order Flow Analysis?
Order flow analysis focuses on the detailed flow of buy and sell orders. Bookmap significantly enhances order flow analysis in the following ways:
|
The Benefit |
The Meaning |
How Does it Help Traders? |
|
Real-time Visualization |
|
|
|
Historical Analysis |
Traders can analyze both current and historical order flow data.
|
This allows traders to understand how order flow dynamics have influenced price movements in the past. |
|
Heatmap Visualization |
Bookmap uses a heatmap-style display to show areas of high trading activity. |
At a glance, traders can identify zones of intense buying or selling, which can be pivotal for making informed decisions.
|
|
Depth of Market |
Traders can view the depth of the market (DOM) to see the volume and order sizes at various price levels.
|
This depth helps traders anticipate potential price movements, giving them an edge in formulating strategies. |
Merging Volume Profile with Order Flow: A Comprehensive Insight
Volume Profile and Order Flow are powerful standalone market analysis tools. When used in tandem, they equip traders with an enriched understanding of market dynamics. Here, we’ll dissect the similarities and differences between them:
|
Similarities |
Differences |
|
|
|
|
|
|
Which Provides a Clearer Picture?
The choice between Volume Profile and Order Flow depends on the trader’s preferences and trading style. Some traders may find Volume Profile sufficient for their analysis, as it helps identify significant price levels and understand market behavior over a specific time frame.
Others may prefer the immediacy and detailed information provided by Order Flow, which offers insights into real-time supply and demand.
The Combined Usage:
-
Many experienced traders find that using both Volume Profile and Order Flow together provides a more comprehensive view of market activity.
- This combined approach supports a broader supply and demand analysis. Volume Profile highlights where participation has clustered historically, while Order Flow reveals how current participants interact with those levels in real time. Together, they provide a clearer picture of auction behavior and execution intent.
-
By integrating information from both methods, traders can gain a deeper understanding of:
-
Price levels
-
Market sentiments, and
-
Potential turning points.
-
How Does Bookmap Contribute?
Bookmap offers tools that comprehensively visualize both Volume Profile and Order Flow comprehensively. Its heatmap feature helps traders identify areas of high liquidity and order concentration, reflecting the essence of Order Flow.
Simultaneously, Bookmap’s volume dots provide insights into the traded volume at specific price levels, corresponding to the principles of Volume Profile. Whether a trader leans more toward Volume Profile or Order Flow – Bookmap serves as a versatile platform that accommodates both approaches.
Common Questions About Volume Profile Trading (FAQ)
Are you interested in day trading or longer-term investing?
Volume profile trading can support both styles. Day traders often focus on session-based profiles, while longer-term traders analyze composite profiles across multiple sessions.
Which software is typically used to view volume profile data?
Traders use platforms that provide detailed volume-at-price data and historical context. Bookmap visualizes this through real-time volume dots and liquidity heatmaps.
Do you focus on developing or static value areas?
Some traders prefer developing value areas that update in real time, while others rely on static levels from completed sessions. Both approaches can be effective depending on trading style.
Ready to master volume profile and order flow? Bookmap makes it simple. Sign up now and upgrade your trading game.
Conclusion
Volume Profile and Order Flow are paramount tools that grant traders a profound understanding of the market. While Volume Profile meticulously examines volume distribution, assisting in the identification of pivotal support and resistance zones, Order Flow provides a real-time lens into the ebb and flow of buy and sell orders, illustrating the nuances of supply and demand.
Bookmap as a trading tool visualizes both concepts, showcasing limit orders, and executed trades. It offers an edge by displaying current and historical data, aiding breakout confirmation, sentiment analysis, and trend assessment.
In short, combining Volume Profile and Order Flow gives traders a clear view of the market, helping them navigate the ups and downs of buying and selling with confidence.
Sign Up Now