See market volatility more clearly in real time.
Compare plans to access deeper market visibility for market volatility.
Education
February 24, 2024
SHARE
Why is Volatility Important in Trading?
Financial market volatility is defined as an asset’s liability to rapid and unpredictable price changes. It is often referred to as a negative thing and used as a synonym of risk, but volatility is also the basis of trading profits.
Volatile Market Environments
Naturally Volatile Markets
Best Indicators for Market Volatility
What Causes Market Volatility?
Market Volatility Examples
Conclusion
Volatile Market Environments
One of the first things that new trades learn about the financial markets is that prices are constantly changing as the market adjusts to supply and demand of liquidity.
Volatility in markets can be caused by a multitude of factors, such as breaking news or an asset breaking through a large price level.
Financial markets can also be sensitive to sentiment, which can cause rapid changes to liquidity in the dual-market process.
Naturally Volatile Markets
Some markets are naturally more volatile than others. For instance, most commodity markets such as gold and oil are known to have more violent price movements. These markets are more volatile simply because they have thinner liquidity, and thus it takes less capital to move the market.
If this is confusing to you, it may be because you don’t have a solid grasp of order flow. For a primer, watch our 4-part order flow educational course on YouTube.
Best Indicators for Market Volatility
You can somewhat reduce the uncertainty caused by market volatility by looking to various indicators for insight into volatility. Here are a few of the most common.
Bollinger Bands
Developed by technician John Bollinger, this indicator puts the price of the asset you are analysing into a band of two standard deviations (both positively and negatively) based on a simple moving average in the middle.
When prices reach the upper bands, this indicates the market may be overbought. When prices reach the lower bands, the market may be oversold. Since the bands are based on standard deviation, the bands expand and compress based on market price volatility.
Average True Range (ATR)
The Average True Range (ATR) measures the price-range across a set number of bars, the default being 14. The bars can be based on any time frame, no matter if it’s minutes or weeks.
An expanding ATR signifies increasing volatility, and the reverse for decreasing volatility.
The ATR is often used to calculate entry, exit, and position sizing. If a trader places their stop loss 1.5x or 2x (of the current ATR value) away from their entry price, they can avoid being stopped out by natural fluctuations in the market and adjust for market volatility.
VIX
Sometimes referred to as the fear index, the VIX is the CBOE’s (Chicago Board Options Exchange) Volatility Index. The number outputted by the VIX is based on volatility expectations from the S&P 500’s options products.
As a general rule, a higher VIX (greater than 30) translates to greater levels of fear and uncertainty in the stock market, whereas a lower VIX below 20 can mean stability—or sometimes complacency.
What Causes Market Volatility?
Financial market volatility is primarily the result of uncertainty. This can be caused by anything from interest rates to inflation rates, geopolitical events, or an interconnection of multiple factors.
Uncertainty
Prices are supposed to represent “truths” in the market. When things are unclear, price behavior will by extension be unclear, which is usually what leads to whipsawing markets.
Uncertainty often precedes fear, which is why many see volatility as something negative.
Liquidity
As mentioned with the subtopic Naturally Volatile Markets further up in this article, volatility is often caused by a lack of liquidity. Financial crises are often highly volatile because liquidity is leaving the market.
A thin or illiquid market can result in large price fluctuations triggered by relatively small transactions.
Market Volatility Examples
We’ve discussed some of the ways to measure volatility and where it comes from, but how does it look on the chart?
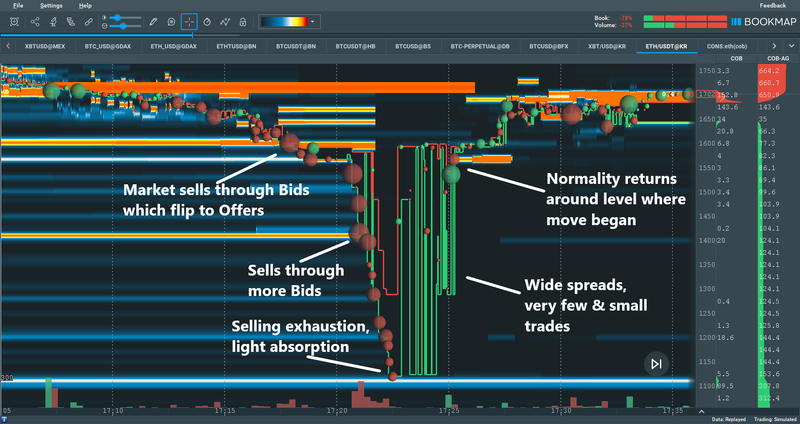
Fig 1: A flash crash in ETHUSD leads to large market volatility.
As can be seen in Fig 1 above, a flash crash on ETHUSD in 2020 lead to heavy market volatility, and that it how it was captured on the Bookmap heatmap. You can read more about this flash crash in this article.
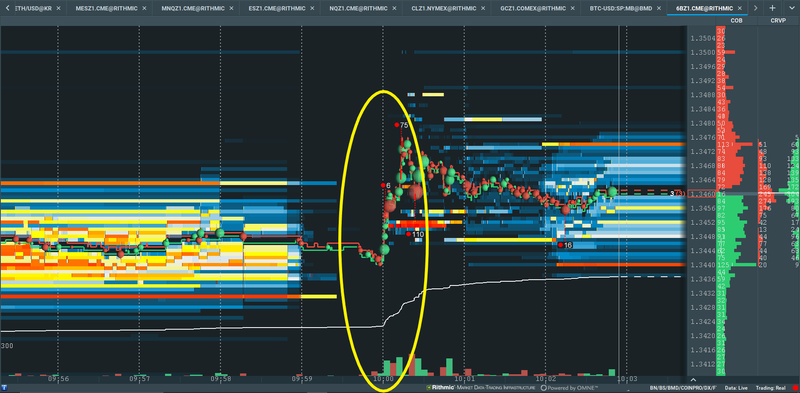
The prescheduled release of UK CPI (Consumer Price Index) leads to volatility in GBP futures.
News releases, scheduled or breaking, often result in market volatility.
The amount of volatility seen from pre-scheduled releases depends on expectations. If the data is inline with market expectations, it usually doesn’t lead to much market volatility (unless the release itself is of extremely high importance). If a news release comes with a highly unexpected number, though, then it usually also includes intense market volatility.
By contrast, breaking news is almost always unexpected, so usually leads to volatility straight away, depending on the importance and expected impact of the news.
Conclusion
Volatility can make or break a trader. On one hand, it is needed to make profit, but on the other hand, if it’s not managed correctly, it can wipe you out.
Knowing exactly where the orders lie and what the intentions of market participants are can greatly improve your chances of successfully trading around volatility.
Try it out today for free. Click here to get started.
Sign Up Now