See market activity more clearly in real time.
Compare plans to access deeper market visibility for market activity.
Crypto
October 26, 2024
SHARE
How to Increase Your Edge When Trading Crypto
The cryptocurrency market is the first truly global digital asset class that trades 24 hours a day, 7 days a week. The countless exchanges and trading instruments available in this market can mean that it is difficult to know what the true price of any particular cryptocurrency or pair really is.
With Multibook (Bookmap’s new data feed), traders can now see this cross-exchange order flow in a single chart. The heatmap will visualize the behavior of liquidity from all market participants in real-time, and the volume delta will be truly cumulative.
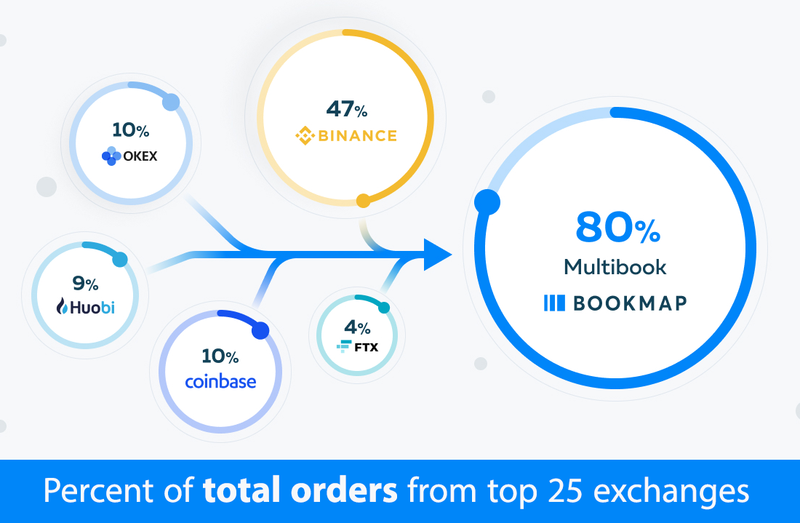
Fig 1 – Even the largest exchanges share just a fraction of the total market liquidity. Combining them leads to a more global view of the market.
Where To Find Multibook
There are two places that traders can find Multibook: on the web and on the desktop version. Using Multibook on Bookmap Web gives you the ability to view data from previous sessions, allowing you to zoom out as far back as 1 month.
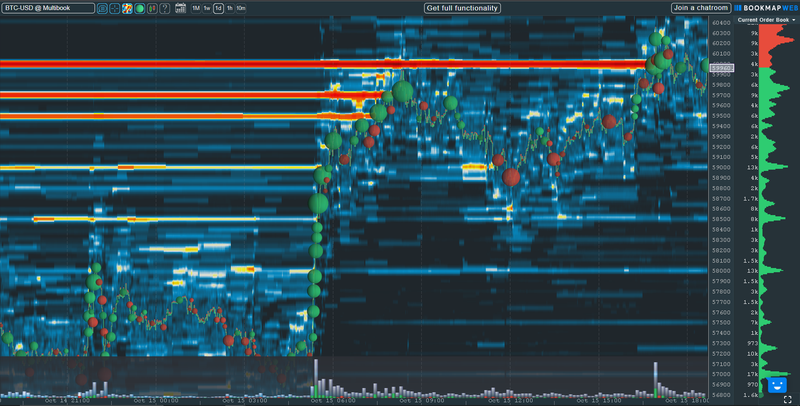
Fig 2 – You can change the lookback period when looking at Multibook instruments on Bookmap Web by clicking on 1m, 1w, 1d, 1h, or 10m at the top of the chart.
The desktop version is also compatible with Multibook Customizer, which gives absolute control over the ability to create and modify your own synthetic instruments, mixing and matching any instruments from any of the supported exchanges. You can watch a short YouTube video about how it works here.
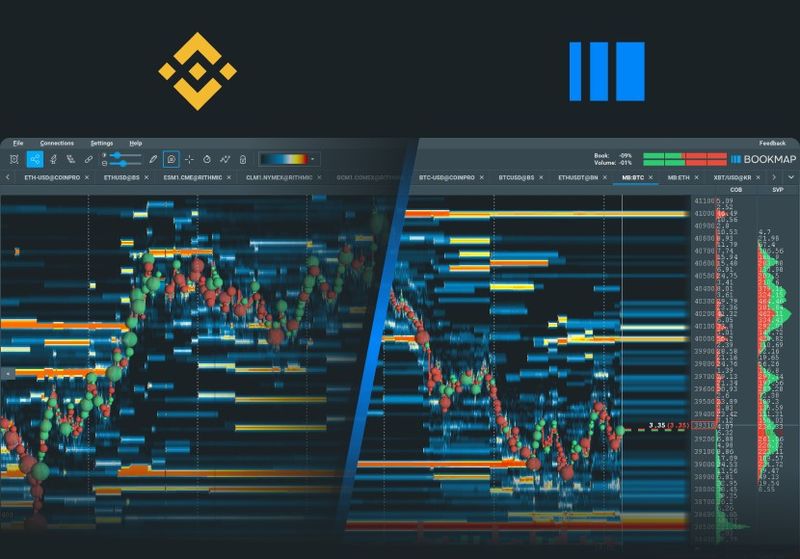
Fig 3 – Multibook Customizer lets you mix and match any of the instruments you are subscribed to.
The Visual Order Flow Advantages of Multibook
Absorption & Exhaustion
As already mentioned, even if you are viewing the order book of the largest cryptocurrency exchange, you see only part of the picture. The trading activity and liquidity levels on the rest of the exchanges remain hidden from you. Using Multibook gives you the bigger picture.
Let’s have a look at an example on a Bookmap chart.
We can see how prices are rising rapidly at the beginning of the chart, aggressive buyers fully consuming and trading through large offers at 52,000. But just a few minutes later, large offers at 52,500 absorb the buying momentum, and even though the offers are fully consumed, buying tapers off and sellers enter the market.
![<p><span style="font-weight: 400;">Fig 4 – Coinbase Pro (previously GDAX) is one of the biggest crypto exchanges for spot.[/caption]</span></p>](https://blog.bookmap.com/wp-content/uploads/2021/10/fig4.png)
Fig 4 – Coinbase Pro (previously GDAX) is one of the biggest crypto exchanges for spot.[/caption]
For many traders using Bookmap, this would have been a high-probability signal to short the market, and prices did drop consistently for the next three hours. But just looking at the Coinbase Pro chart shows no significant area of liquidity for a profitable exit of the trade, and about 2 hours after the reversal, prices suddenly rebound for no clear reason.
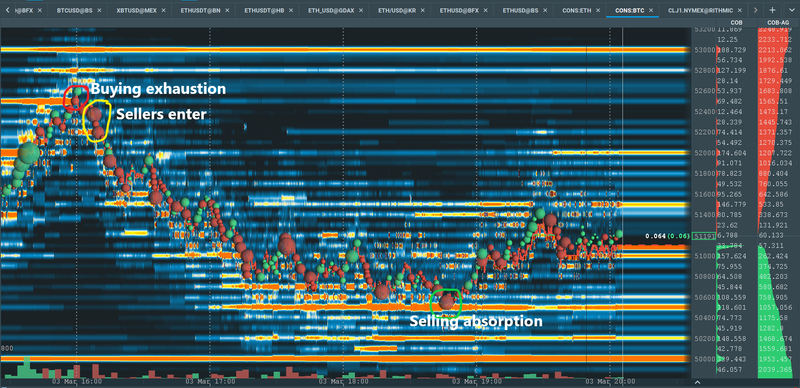
Fig 5 – Multibook provides a clear picture of selling absorption.
However, looking at the Multibook chart above shows a clear level of selling absorption on the bids at 50,500. A trader that took the short opportunity could now take full or partial profits here, or even go long, depending on their particular approach to trading cryptocurrencies. Either way, the Bookmap heatmap of a BTCUSD pair from a single exchange showed a clear potential entry signal, but only in combination with Multibook would the trader have had the opportunity to seize as much of the $2k move as possible.
Long-Term Liquidity Levels
Using Multibook on Bookmap Web allows for greater lookback periods, perfect for swing traders that want to get a bird’s-eye view of the market. Even if you’re a day trader, it’s always worth knowing if the prices you’re trading today are now approaching a historically important long-term level of liquidity in the order book. It’s not just about size; often the liquidity that has been resting in the order book for a long time signals greater intent, and thus an increased chance of the level holding.
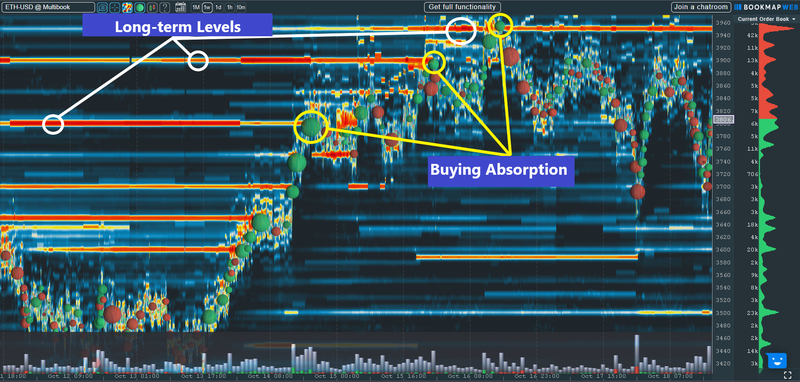
Fig 6 – Long-term levels on the Offer lead to buying exhaustion.
As we can see on this Multibook of ETHUSD on Bookmap Web, the $3,800, $3,900, and $3,950 long-term liquidity levels led to buying absorption and reversals. Liquidity levels don’t always hold, but in combination with other analysis methods, watching longer-term liquidity levels on the heatmap is a fantastic way to increase your edge when trading crypto.
Cross-Exchange Arbitrage
Since different instruments trade on different exchanges, they can trade at different prices—even if they are based on the same underlying asset. This means that sometimes the price of one of the many instruments can become temporarily dislocated from the rest, and trade at significantly different levels. If you have accounts across multiple crypto exchanges, being able to always choose the best price could provide another edge and improve the PnL of your trading strategy over time.
It can also be a great trading opportunity.
Consider the ETHUSD flash crash that occurred on Kraken at the beginning of this year. On February the 22nd, the rate on Kraken fell from 1,600 to a low of 1,120 in a matter of minutes.
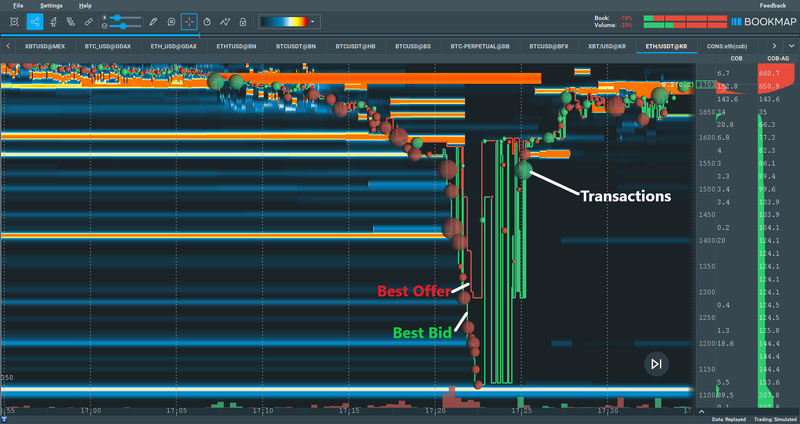
Fig 7 – The ETHUSD flash crash as viewed in Bookmap’s Replay Mode.
The bids at 1,600 were fully consumed, and then that price level immediately flipped to the offer. The level absorbed a brief moment of market buying, before prices tanked, rapidly falling through large bids at 1,400 to trade into smaller bids just above 1,100.
Spreads then widened and very few trades were transacted during this time, the first reasonably sized volume dots appearing as spreads narrowed towards where the move down started at 1,600.
While it seems that a market participant did manage to successfully trade this move (the red dot being a market sell that traded into somebody’s bid at 1,120), it’s impossible to know whether this transaction was a market participant closing a short trade, a market maker balancing their books, or a trader betting that the momentum was about to reverse. Either way, the reality is that trading this move would be very difficult, not to mention risky.
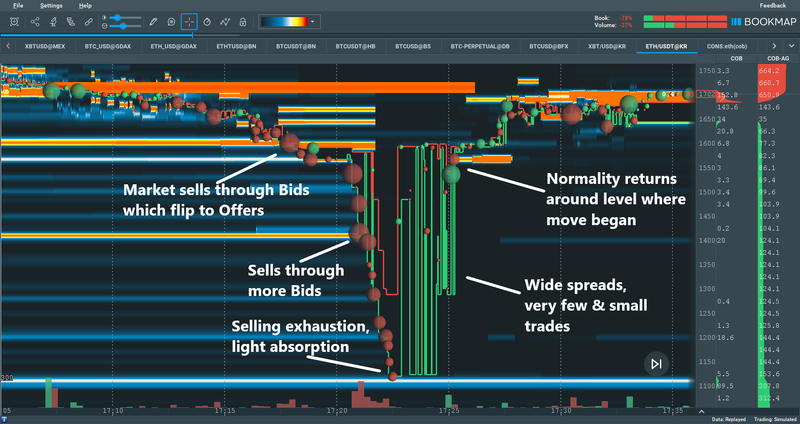
Fig 8 – ETHUSD flash crash as seen within Multibook.
Looking now at a Multibook of ETH based on 5 exchanges including Kraken, we see a clearer picture. The other exchanges only traded as low as 1,510, the volume bubbles for Kraken being literally off the charts.
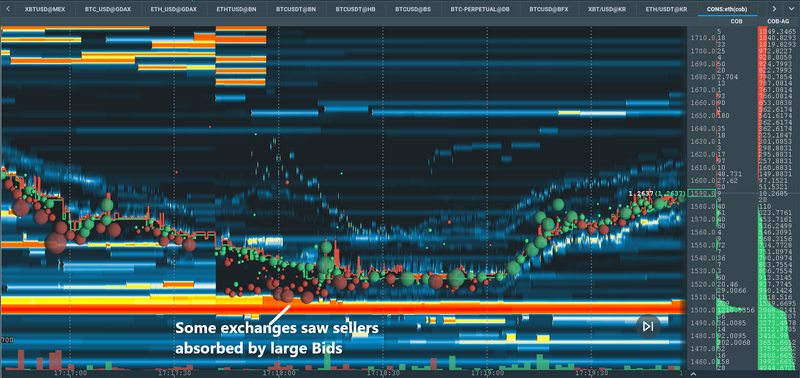
Zooming into the Multibook’s heatmap further, we can see that some exchanges saw selling absorption on the large bids just above 1,500. As the selling momentum stalled, this could have been taken as confirmation that this rapid move down was reaching oversold levels. It did in fact turn out to be the low of the day, the pair making a short-term higher high minutes later and trading back up into the 1,600-1,700 zone almost as quickly as it fell.
Whether a trader utilized these indications to initiate a trade or simply to manage risk all comes down to individual trading preferences and style. The bottom line is, Multibook can provide an edge even in highly volatile markets.
Greater Insight into Price Discovery: Combining Multibook Customizer with Bookmap Indicators
To gain absolute control over the order flow you see, a trader should use Multibook Customizer. Being able to mix between spot and futures products across exchanges not only gives you a more complete picture of the market and the chance to spot arbitrage opportunities, but it could also be vital for sentiment analysis.
Some of the latest academic research on bitcoin suggests that the price discovery can more often than not take place on the futures market, rather than the spot market. In a constantly developing market like crypto, having the ability to customize the combination of instruments you are visualising will give you the highest chance of being able to identify the leading order flow.
Now combine Multibook Customizer with the fleet of indicators on Bookmap Desktop, and you have something really powerful.
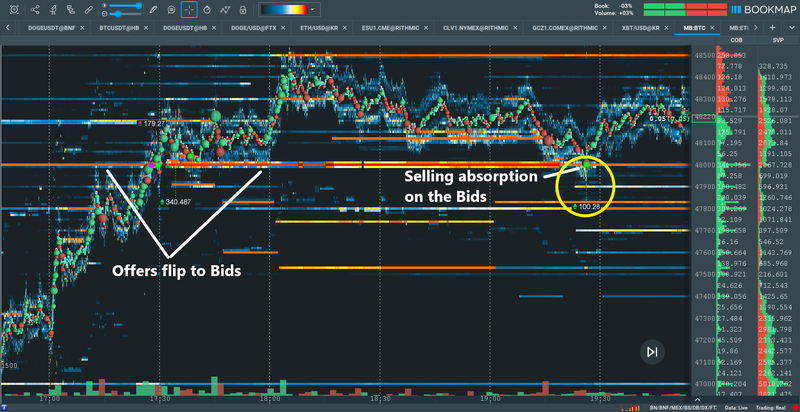
Fig 10 – Using Multibook in conjunction with the array of trading tools and indicators such as the Cumulative Volume Delta (CVD) or the Absorption Indicator can unlock extra insights into crypto order flow.
As can be seen in figure 10, a Multibook of BTCUSD showed aggressive buyers trading through $48,000 offers, which afterwards flipped to bids at the same price. Two hours after the breakout, price retraced to retest the level, leading the Absorption Indicator highlighting that over 100 BTC was absorbed within 0.01 seconds. This turned out to be the exact swing low, and prices were free to continue the move higher.
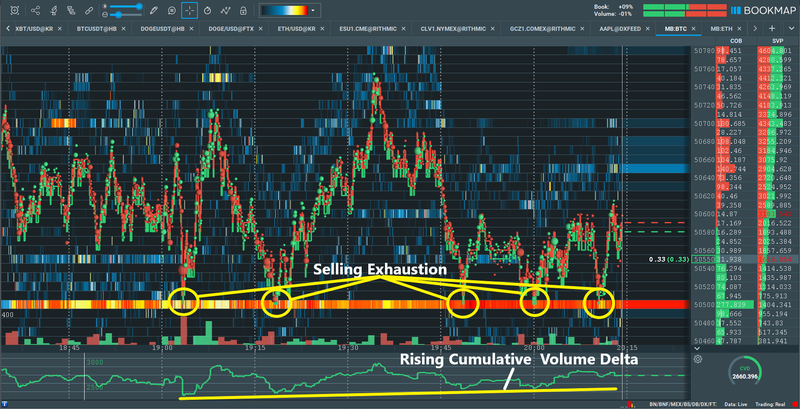
Fig 11 – Aggressive sellers don’t want to trade into bids and the CVD is rising.
In figure 11, we see another example of combining Multibook (Customizer) with a Bookmap indicator—in this case the Cumulative Volume Delta (CVD).
The Best Bid line (in green) is visible due a lack of volume dots each time price touches the 50,500 liquidity level, meaning nobody wants to sell into the bids there. At the same time, the CVD is rising, showing a positive cumulative volume traded, further indicating that aggressive selling is exhausting. This can increase confidence to take long positions due to both the large liquidity support holding, as well as a lack of aggressive selling.
Conclusion
Cryptocurrencies are a truly international asset class, and this brings with it both positives and negatives. For traders, the increased interconnectivity provides the potential for more alpha generation. But all these exchanges with their different prices can be dangerous water to tread, even for the best of traders. Multibook simplifies the market by consolidating it all into a single, easily accessible, and customizable chart. If used correctly, Multibook provides that ever so vital edge in this often extremely volatile space.
Sign Up Now