See yield curve more clearly in real time.
Compare plans to access deeper market visibility for yield curve.
Education
March 29, 2024
Updated
SHARE
Yield Curve Dynamics: Impact on Markets and Trading Strategies
 Seasoned investors always refer to simple graphs of interest rates. Do you know why? An analysis of interest rates across different timeframes can help you understand market shifts and gauge economic health.
In this article, we’ll study different types of yield curves—Normal, Inverted, and Flat—and see how traders use them to predict economic conditions. Furthermore, you’ll get to know how yield curves impact investor sentiments and affect their behavior.
Lastly, you’ll explore some popular trading strategies that will help you execute trades with enhanced accuracy. Let’s begin.
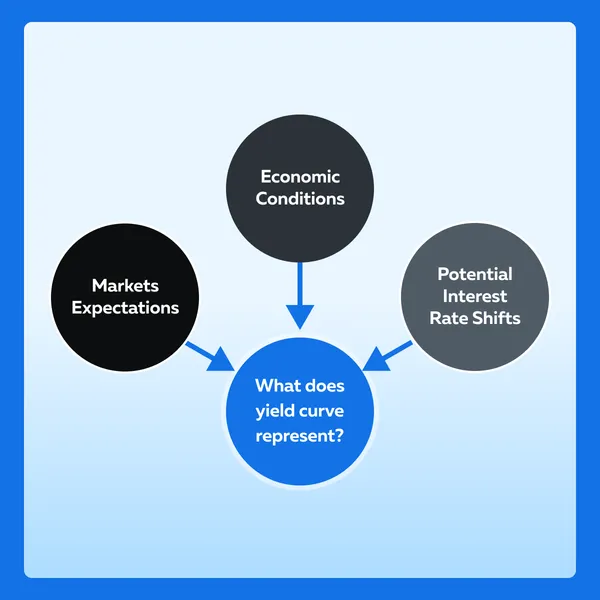
What are Yield Curves?
A yield curve is a graphical representation of interest rates across various maturities of fixed-income securities. The plotted rates represent the relationship between the following:
- Interest rate (or cost of borrowing) and
- Time to maturity of debt.
There are three major components of the yield curve:
- Short-Term Interest Rates
-
-
- These are rates of securities with shorter maturities, typically up to one year.
- Short-term rates are influenced by:
- Central bank policies,
- Economic indicators, and
- Immediate market conditions.
-
- Intermediate-Term Interest Rates
-
-
- These are rates of securities with maturities ranging from one to ten years.
- Intermediate-term rates offer a mid-range perspective based on:
- Economic growth expectations and
- Inflation outlooks.
-
- Long-Term Interest Rates
-
- These are rates of securities with maturities beyond ten years.
- Long-term rates are sensitive to:
- Broader economic trends,
- Inflation expectations, and
- Market sentiments.
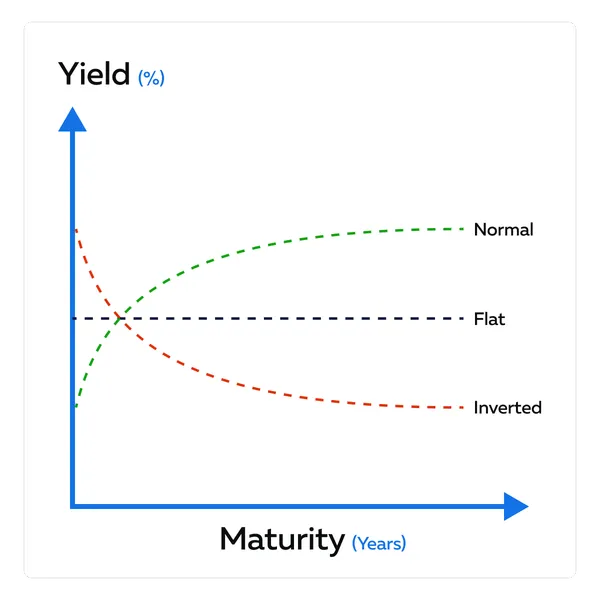
Different Shapes of Yield Curves
The shapes of yield curves are studied in three different versions – Normal, Inverted, and Flat. An understanding of these shapes helps us to understand:
- Market sentiment and
- Economic forecasts.
Read the table below to learn more about these shapes:
| What is the shape? | When is it formed? | How does it impact the economy? | Real-life Examples |
| Normal Yield Curve | Short-term interest rates are lower than long-term rates | Signals a healthy economic environment with expectations of sustained growth. |
|
| Inverted Yield Curve | Short-term rates surpass long-term rates | This curve indicates potential economic downturns and signals troubling economic conditions in the future. |
|
| Flat Yield Curve | Minimal difference between short-term and long-term rates | Signifies uncertainty in future economic trends. |
|
Bull Flatteners and Bull Steepeners
Let’s begin with understanding the key differences between them:
| Types | What is it? | What does it indicate? | How do interest rates get impacted? |
| Bull Flatteners |
|
Moderate economic growth | Short-term rates decrease, while long-term rates experience a more significant decline. |
| Bull Steepeners |
|
Economic expansion | Short-term rates decrease, while long-term rates remain relatively stable or decline slightly. |
What Leads to the Formation of a Bull Flattener?
A bull flattener is formed when there is a narrowing spread between short-term and long-term interest rates. Here are some common factors that catalyze the formation of a bull flattener:
- Expectations of Declining Interest Rates
-
-
- Investors, who expect economic challenges or a potential recession, shift their preferences towards longer-term securities.
- This shift causes long-term interest rates to decrease more than short-term rates.
-
- Central Bank Policies
-
-
- If central banks signal or implement policies to lower short-term interest rates, it can result in a decrease in short-term rates.
- However, long-term rates may also decrease, though the decline is relatively less pronounced.
-
- Economic Uncertainty
-
-
- During periods of economic uncertainty, investors tend to seek the safety of longer-term assets.
- This preference change leads to increased demand for long-term bonds.
- An increased demand for long-term securities contributes to the flattening of the yield curve.
-
- Flight to Safety
-
- Investors, who seek refuge in safer assets, divert their investments towards long-term bonds.
- This diversion again causes long-term rates to decrease relative to short-term rates.
Real-World Events that Triggered Bull Flatteners
By analyzing several real-world events that trigger bull flatteners, we can see how a combination of economic challenges, geopolitical uncertainties, and central bank actions contributed to the flattening of the yield curve. Let’s explore some popular events below:
| Real-life Event | Onset | Impact |
| Global Financial Crisis (2008) | The collapse of major financial institutions marked the onset of the global financial crisis. |
|
| COVID-19 Pandemic (2020) | The outbreak of the COVID-19 pandemic led to widespread economic uncertainty and market volatility. |
|
| Trade Tensions and Tariff Concerns (2019) | Occurred due to escalating trade tensions between the U.S. and China and tariff threats. |
|
| Brexit Uncertainty (2016-2019) | Began due to prolonged uncertainty surrounding the United Kingdom’s withdrawal from the European Union (Brexit). |
|
| Eurozone Debt Crisis (2011-2012) | Happened due to escalating concerns over sovereign debt in several Eurozone countries. |
|
How to Trade During Bull Flatteners
Traders can employ the following practices:
- Long-Term Bond Purchases
-
-
- Investors can purchase long-term bonds to benefit from potential price appreciation.
-
- Barbell Strategy
-
-
- Investors can combine long-term bond purchases with short-term bond investments.
- This strategy aims to balance the portfolio by benefiting from potential capital gains on long-term bonds while maintaining liquidity with short-term bonds.
-
- Options Strategies
-
-
- Investors can implement options strategies like buying put options on short-term bonds.
- Buying put options provides downside protection for short-term bonds in the event of unexpected market movements.
-
- Curve Steepener Trades
-
- Investors can execute curve steepener trades by simultaneously:
- Selling short-term bonds and
- Buying long-term bonds.
- This strategy capitalizes on the expectation that short-term rates will decrease more than long-term rates.
- Investors can execute curve steepener trades by simultaneously:
Bear Flatteners and Bear Steepeners
Let’s begin with understanding the key differences between them:
| Types | What is it? | What does it indicate? | How do interest rates get impacted? |
| Bear Flatteners |
|
Rising interest rates lead to a more pronounced increase in short-term rates relative to long-term rates. | Short-term rates rise more rapidly than long-term rates, resulting in a flattening of the yield curve. |
| Bull Steepeners |
|
Possible economic expansion, where long-term rates are expected to rise more than short-term rates | Long-term rates experience a more pronounced increase compared to short-term rates, leading to a steepening of the yield curve. |
What Leads to the Formation of a Bear Flattener?
- Expectations of Rising Interest Rates
-
-
- Investors anticipate that interest rates will increase in the future.
-
- Short-term rates rise more than long-term rates.
-
-
- This rise happens as investors adjust their portfolios.
-
- Tightening Monetary Policy
-
-
- Central banks signal a more restrictive monetary policy, including interest rate hikes.
- Anticipation of higher short-term rates contributes to a bear flattener as investors adjust positions.
-
- Strong Economic Growth Signals
-
- Robust economic indicators suggest sustained economic expansion.
- Investors anticipate rising short-term rates, leading to a bear flattener.
Real-World Events that Trigger Bear Flatteners
| What was the event? | What was it? | How DID IT happen? |
| Interest Rate Hike Cycles (2004-2006) | The U.S. Federal Reserve implemented a series of interest rate hikes | Anticipation of rising short-term rates led to a bear flattener as investors adjusted portfolios. |
| Post-Inflationary Period (1980s) | A period during which high inflation was tackled in the 1980s | As central banks implemented measures to control inflation, investors anticipated rising short-term rates. |
How to Trade During Bear Flatteners
- Short Positions in Long-Term Bonds
-
-
- Investors can take short positions in long-term bonds.
- When anticipating a flattening yield curve, shorting long-term bonds allows traders to benefit from potential price declines.
-
- Interest Rate Derivatives
-
-
- Investors can utilize interest rate derivatives like futures contracts.
- Traders can use derivatives to:
- Hedge against potential losses or
- Speculate on interest rate movements during a bear flattener.
-
- Inverse ETFs
-
-
- Investors can consider inverse exchange-traded funds (ETFs) that track bond indices.
- Inverse ETFs aim to provide returns opposite to the performance of the tracked bond index.
- This situation allows traders to profit during a bear flattener.
-
- Options Strategies
-
- Investors can implement options strategies such as buying put options on long-term bonds.
- Buying put options provides a hedge against potential price declines in long-term bonds during a bear flattener.
Impact on Market Dynamics
Changes in the yield curve impact various asset classes, like equities, fixed-income securities, and currencies. Let’s understand it in depth:
| Equities | Fixed-income Securities | Currencies |
|
|
|
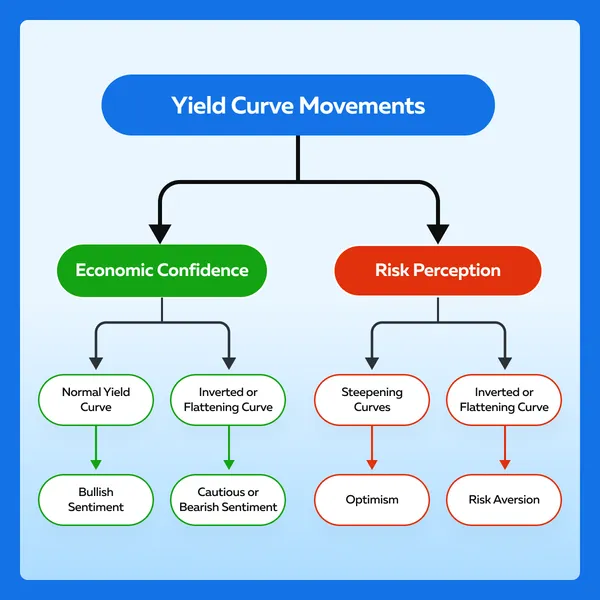
What is the Relationship Between Yield Curve Movements and Investor Sentiment?
Investor sentiments can be measured through their:
- Confidence in the economy, and
- Perception of risk.
The shapes of the yield curve are widely used to interpret these sentiments. Let’s study the graphical representation below:
Some Historical Examples
In the past, there have been several events related to yield curve dynamics that influenced market trends and investor behavior. Let’s study some relevant events:
- 2007-2008 Financial Crisis
-
-
- Yield Curve Movement: Inverted Yield Curve (2006).
-
- Impact:
-
-
-
- The inverted yield curve served as a warning signal of economic challenges.
- Investors, reacting to the inversion, adjusted portfolios.
- This adjustment contributed to a bearish market sentiment.
- The subsequent financial crisis witnessed widespread market declines.
-
-
- Post-Financial Crisis Recovery (2010-2019)
-
-
- Yield Curve Movement: Normalization of the yield curve.
- Impact:
- As economies recovered from the financial crisis, the yield curve normalized.
- This normalization contributed to a positive economic outlook and boosted investor confidence.
- The equity markets experienced a decade-long bull market.
-
- Global Economic Uncertainty (2019-2020)
-
-
- Yield Curve Movement: Flattening due to trade tensions and geopolitical uncertainties.
- Impact:
- Trade tensions and global uncertainties led to a flattening yield curve.
- Investors, concerned about potential economic challenges, shifted towards safer assets.
- Fixed-income securities were favored during volatile periods.
-
- Post-COVID-19 Pandemic (2020-2021)
-
- Yield Curve Movement: Central banks implementing rate cuts in response to the pandemic.
- Impact:
- Central banks worldwide implemented rate cuts to mitigate economic challenges posed by the pandemic.
- Yield curves responded with adjustments.
- Investors sought safety during volatile periods.
Trading Strategies and Risk Management
Traders who adopt trading strategies to capitalize on yield curve movements are better poised to:
- Gain profits,
- Do risk management, and
- Adapt.
Let’s have a look at some popular trading strategies:
Riding the Steepening Curve Strategy
Riding the steepening curve strategy is a proactive approach for traders aiming to capitalize on yield curve dynamics. It presents profit opportunities and traders can successfully implement it by continuously monitoring market conditions.
| What to do? | Why do so? |
| Take positions that benefit from the yield curve steepening. | In a steepening curve, long-term interest rates rise relative to short-term rates. |
How to Implement the Strategy
The primary objective of implementing this strategy is to profit from the price appreciation of longer-term bonds as their yields decrease with rising prices. See the graphical representation below for the correct implementation:
Let’s understand this strategy better with a hypothetical example.
The Scenario
Long-term interest rates are rising more rapidly than short-term rates.
The Strategy
| What to do? | How to do it | Why do so? |
| Take a long position on 10-year Treasury Bonds. | Buy 10-year Treasury bonds. | It is anticipated that the yield on these bonds will decrease as their prices rise in response to the steepening curve. |
| Take a short position on 2-year Treasury Notes. | Simultaneously sell 2-year Treasury notes. | It is anticipated that the yield on these shorter-term notes will be minimally effected or may even marginally increase when compared with the longer-term bonds. |
The Execution
- Execute a buy order for 10-year Treasury bonds.
- Execute a sell order for 2-year Treasury notes.
The Profit
- As an investor, you will benefit from the potential price appreciation of 10-year bonds, while gaining from the yield differential between the two maturities.
Betting on the Flattening Curve Strategy
In this strategy, investors bet on a flattening yield curve in a situation where long-term rates are higher than short-term rates. The underlying anticipation is that yields on these shorter-term instruments will be minimally affected or may even marginally increase compared to longer-term bonds during a flattening curve.
The Implementation
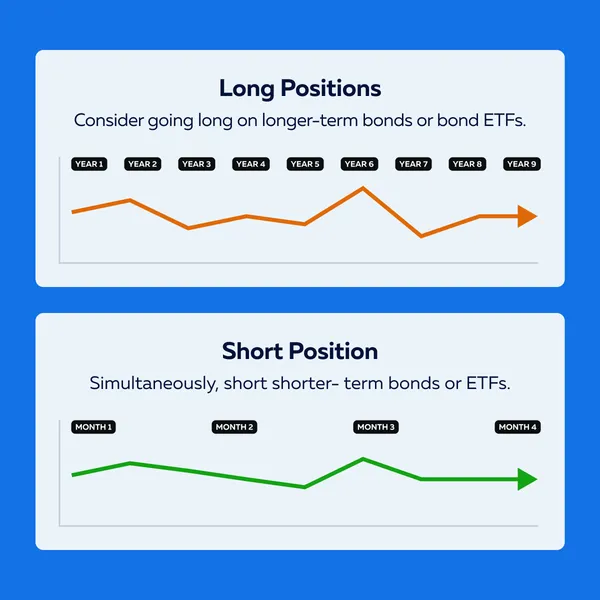
Traders can take long or short positions that benefit from the yield curve flattening. Refer to the table below:
| Long Positions | Short Positions |
|
|
Let’s understand this strategy and its execution through a hypothetical example:
The Event
When anticipating a flattening yield curve, an investor should take the following actions simultaneously:
- Buy 2-year treasury notes and
- Sell 10-year treasury bonds.
The Execution
An investor can execute these curve-based strategies in three different ways. Let’s learn each of them via step-by-step guidance:
Method I: Yield Curve Spread Trades
The objective of this execution method is to capitalize on the yield spread between two different maturities. See the step-by-step execution:
- Analysis: Analyze the yield curve to identify a desired spread trade opportunity.
- Selection: Choose the specific maturities you want to trade (e.g., 2-year and 10-year).
- Long Position: Execute a buy order for the lower-yielding maturity (e.g., 2-year).
- Short Position: Simultaneously execute a sell order for the higher-yielding maturity (e.g., 10-year).
- Monitor and Adjust: Regularly monitor the spread and adjust positions based on changing market conditions.
Method II: Butterfly Trades
The objective of this execution method is to take advantage of changes in the yield curve slope. See the step-by-step execution:
- Understanding Slopes: Identify the desired change in the slope of the yield curve.
- Positioning: Open positions with a combination of long and short positions at three different maturities (e.g., 2-year, 5-year, and 10-year).
- Execution: Execute simultaneous buy and sell orders for the selected maturities to create the butterfly spread.
- Monitoring: Continuously monitor the positions and assess the impact on the yield curve slope.
- Adjustment: Adjust positions as needed to align with evolving market expectations.
Method III: Yield Curve Arbitrage
The objective of this execution method is to exploit price differentials in related securities. See the step-by-step execution:
- Identifying Discrepancies: Identify securities with price differentials do not align with their relationship in the yield curve.
- Simultaneous Trades: Execute simultaneous buy and sell orders to exploit the pricing inefficiency.
- Monitoring: Regularly monitor the prices of related securities and the yield curve to ensure alignment.
- Profit Taking: Close positions when the pricing inefficiency is corrected, collecting profits.
Why is Risk Management Important?
Risk management is paramount when implementing yield curve-based strategies. It helps to:
- Safeguard against potential losses,
- Protect from volatility in interest rates,
- Hedge from market uncertainties, and
- Provide a framework to respond to changing sentiments.
Here’s how traders can manage their risks:
- Diversify positions across different maturities and securities to spread risk.
- Size positions appropriately to manage exposure to potential losses.
- Continuously monitor market conditions and adjust positions accordingly.
- Implement stop-loss orders to limit potential losses in case of adverse market movements.
Conclusion
Understanding the different shapes of yield curves – Normal, Inverted, and Flat – is crucial for crafting effective trading strategies. The yield curves show interest rates across different maturities and help investors forecast economic conditions and market sentiment.
To maximize trading accuracy, traders can use strategies like Bull Flatteners, Bull Steepeners, Bear Flatteners, and Bear Steepeners. Using them, they can capitalize on yield curve movements and economic shifts.
The yield curve’s predictive power and its profound effect on market behavior cannot be underestimated. Historical examples, such as the 2008 financial crisis and the COVID-19 pandemic attest to the same.
By implementing various trading strategies and practicing robust risk management practices, traders can capitalize on profitable opportunities.
Are you curious about how the yield curve and market cycles are connected? Dive deeper into the relationship between interest rates, market cycles, and trading strategies by exploring our comprehensive guide on ‘Market Cycles: The Key to Timely Trading Decisions.‘ Gain valuable insights on navigating market fluctuations. Click here to read more.
Sign Up Now