
What is Nanotick?
Quite simply the most comprehensive source of atomic tick data for all CME group futures and options available. Captured at the Aurora data center with nanosecond atomic clock synchronized time stamps.
Why use Nanotick with Bookmap?
Precise market data Enhanced market transparency Deeper price action insights
- The most precise raw market data & high precision receive times
- Historical full market by order visualisation
- Nanosecond resolution full trade records and BBO
- Replay the market and view an HD video-like stream
- Observe stop orders, matching engine cycles iceberg orders and sweeps
- Replay in full simulation mode with own orders overlaid onto the book
To download free sample Nanotick data please go to
www.nanotick.com
Here we present a sequential series of screenshots that demonstrate how discrete data elements within Nanotick may be displayed incrementally and added to the total visible data.
BBO + Order Book Heat map
The screenshot below shows BBO overlay on a heatmap.
The heatmap provides a means to visualise those price levels supporting the highest liquidity and the evolution of the microstructure with time. The price level with the highest liquidity is white. Those price levels with less liquidity are progressively darker pro rate. Those levels with no price liquidity are black.
The heatmap is produced from Nanotick data and contains all market data events with high precision receive time at Co-Location.

Volume traded – Volume Dots, Volume column and volume bars
Volume Dots represent transacted volume. Each dot represents the aggregate volume that has been executed during a time period. The size of the dot and the color represent the amount of traded volume from the aggressor side. Aggressive buys are green and aggressive sells are red. The same information may also be displayed within the tile below the heatmap.
Zooming in on a specific volume dot will ultimately render this into specific trades and match events
The power of visualization
Nanotick has such precise timestamping that modifications to liquidity before and after market announcements may be easily visualized.
- Zoom in to highest resolution – Nanoseconds
- The image shows liquidity removal prior to scheduled news with potential for market impact.
- Note also that market makers with higher latencies cancelling in a second “feathered” pattern in response the the prior activity
Stop orders
Nanotick retains all order IDs and transact times and thus it is possible to identify stop orders.
Please consider the following image from Bookmap
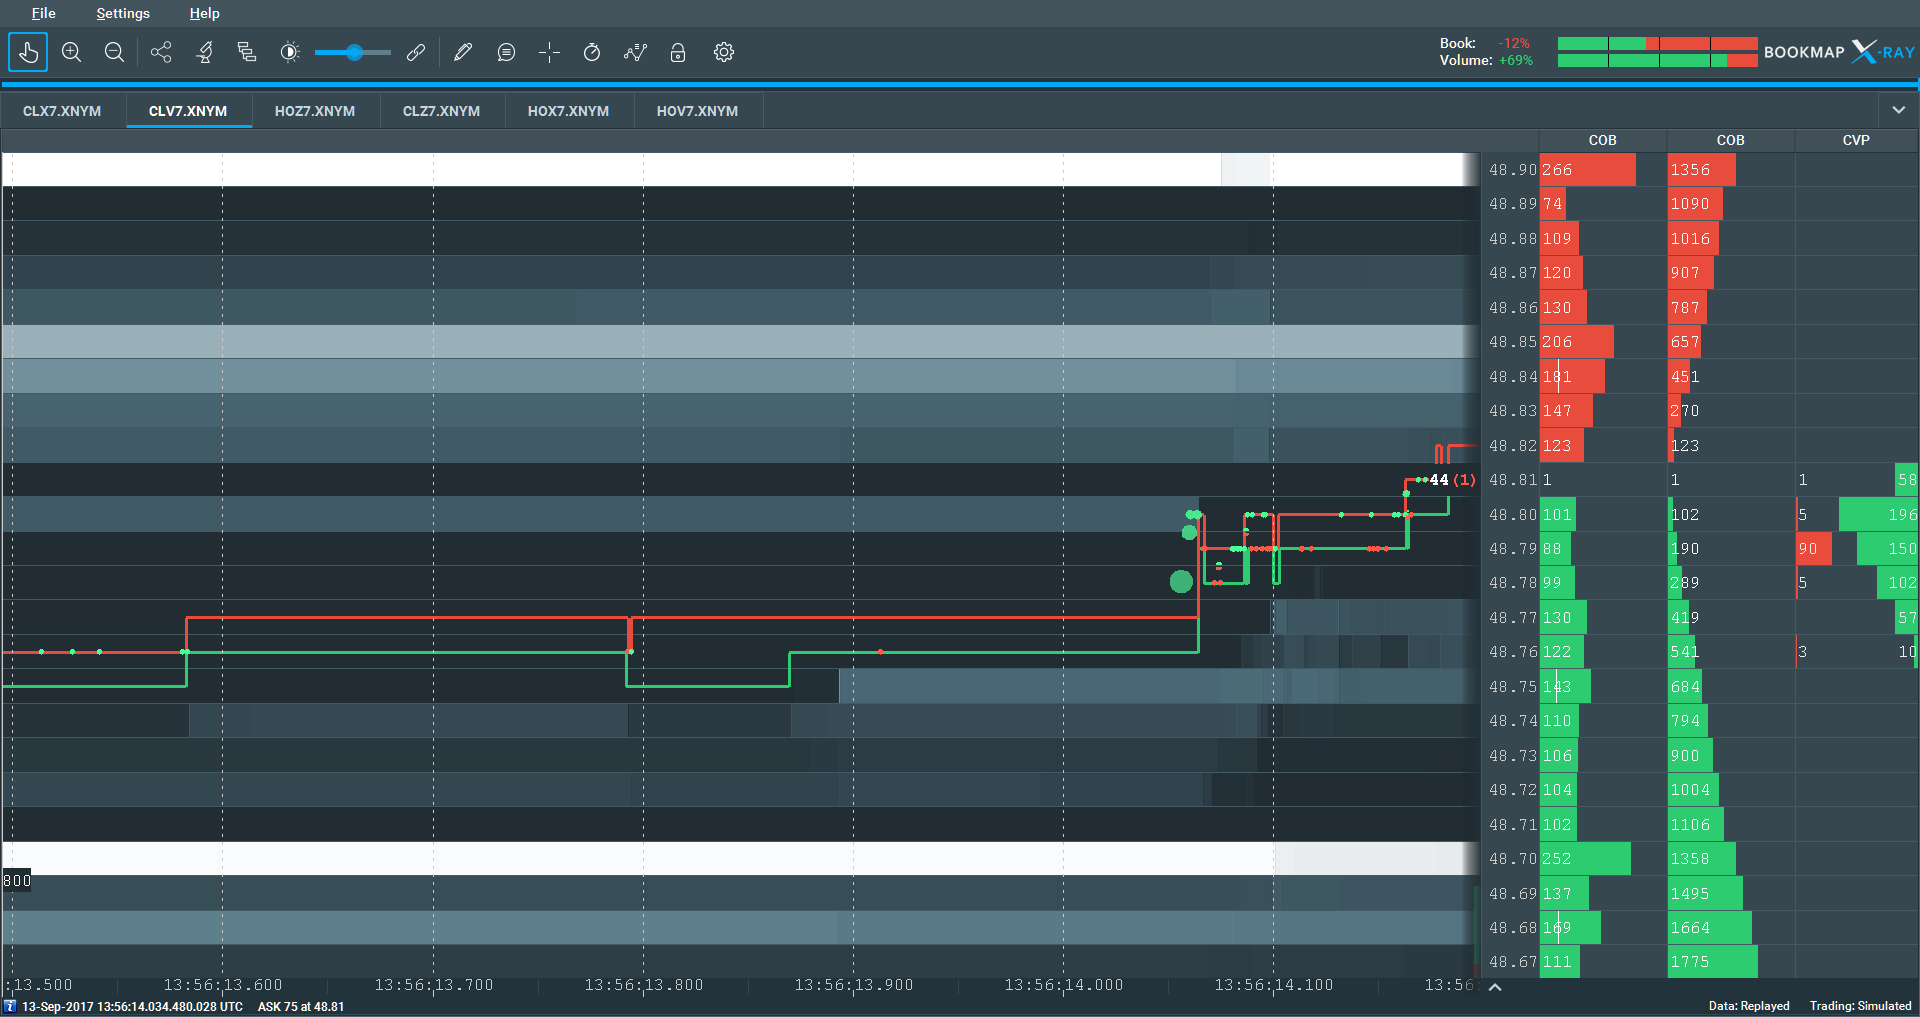
The presence of stop orders only becomes apparent with the benefit of zoom into the region on the right hand elements of the heatmap
Please note that the heatmap is based on book updates that are sent by the exchange at the end of match events and trade reports. Thus the heatmap will always lag the true state of the orderbook. This may be observed at level 48.80 when the orderbook has been swept but seemingly liquidity remains in the book for a under one millisecond after the late trade print.
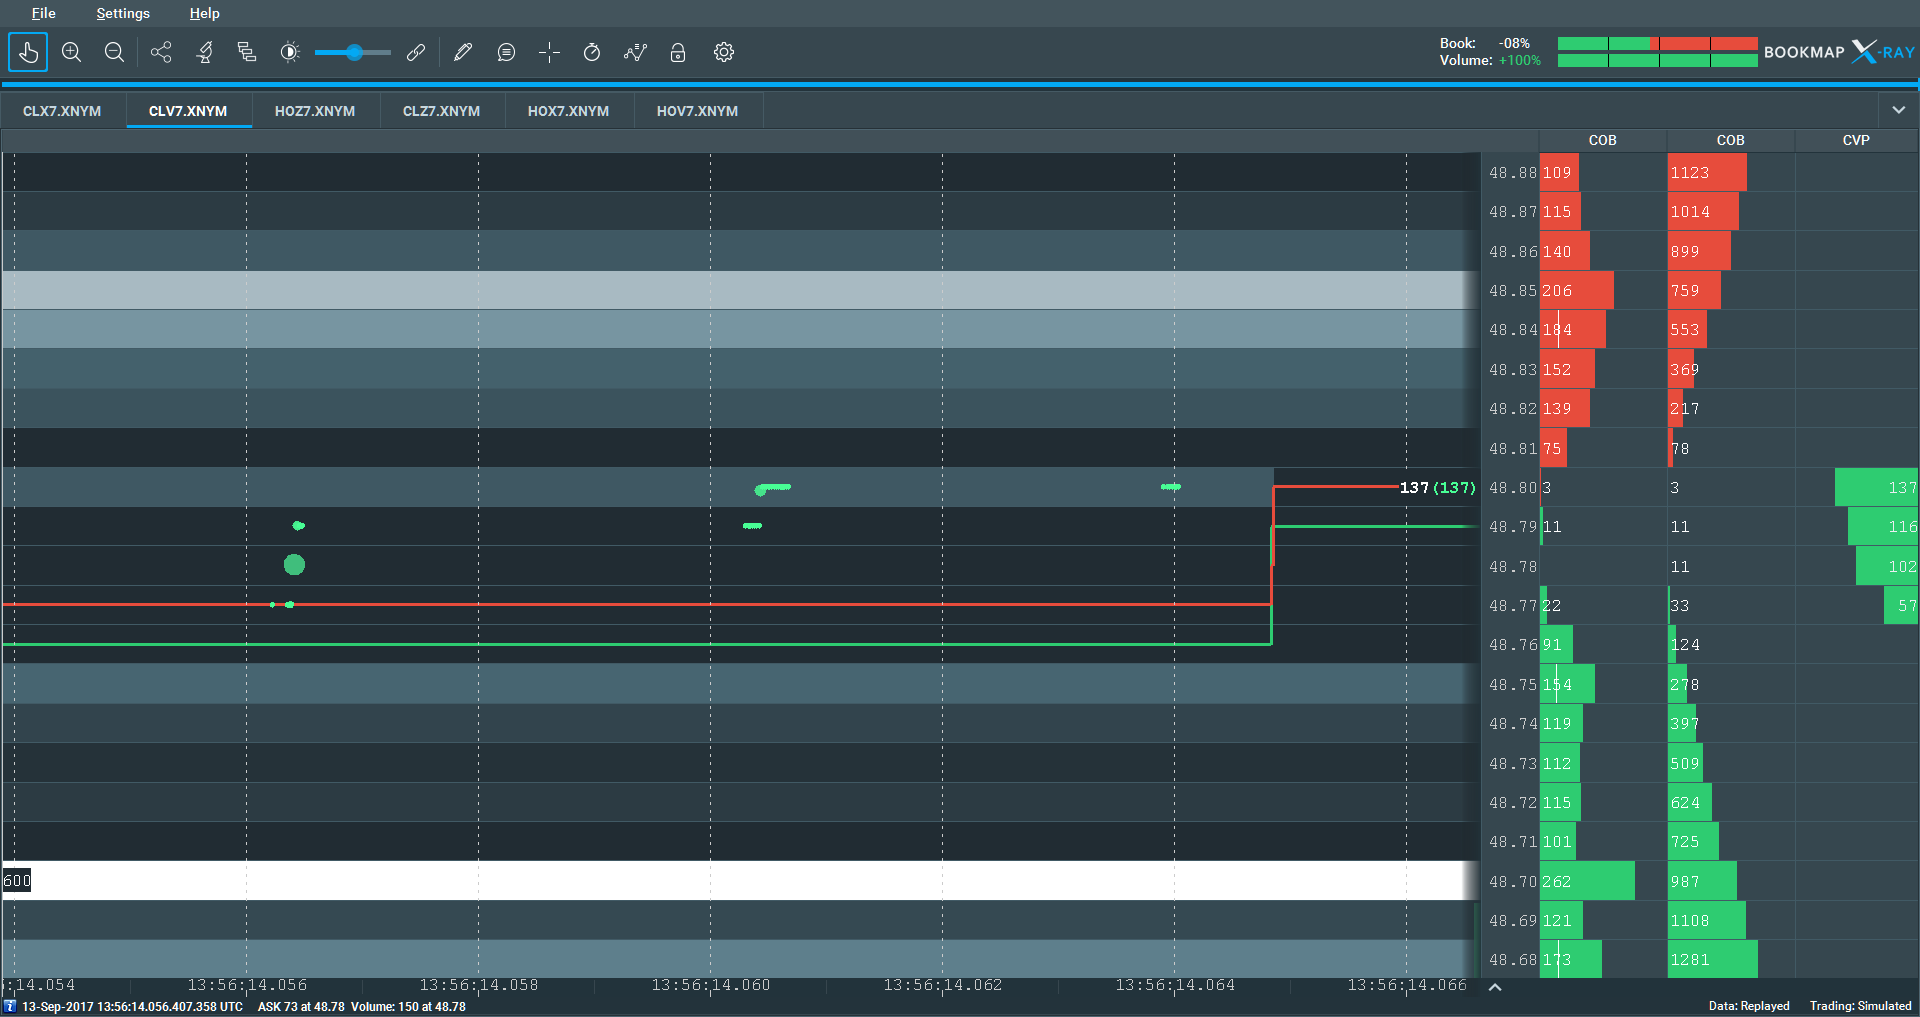
Zooming in again on the group of trades at 13.56.14. 064 shows that these trades arose at matching engine frequency and are not the result new orders entering the market in response to trade events and the ensuing market data book updates.
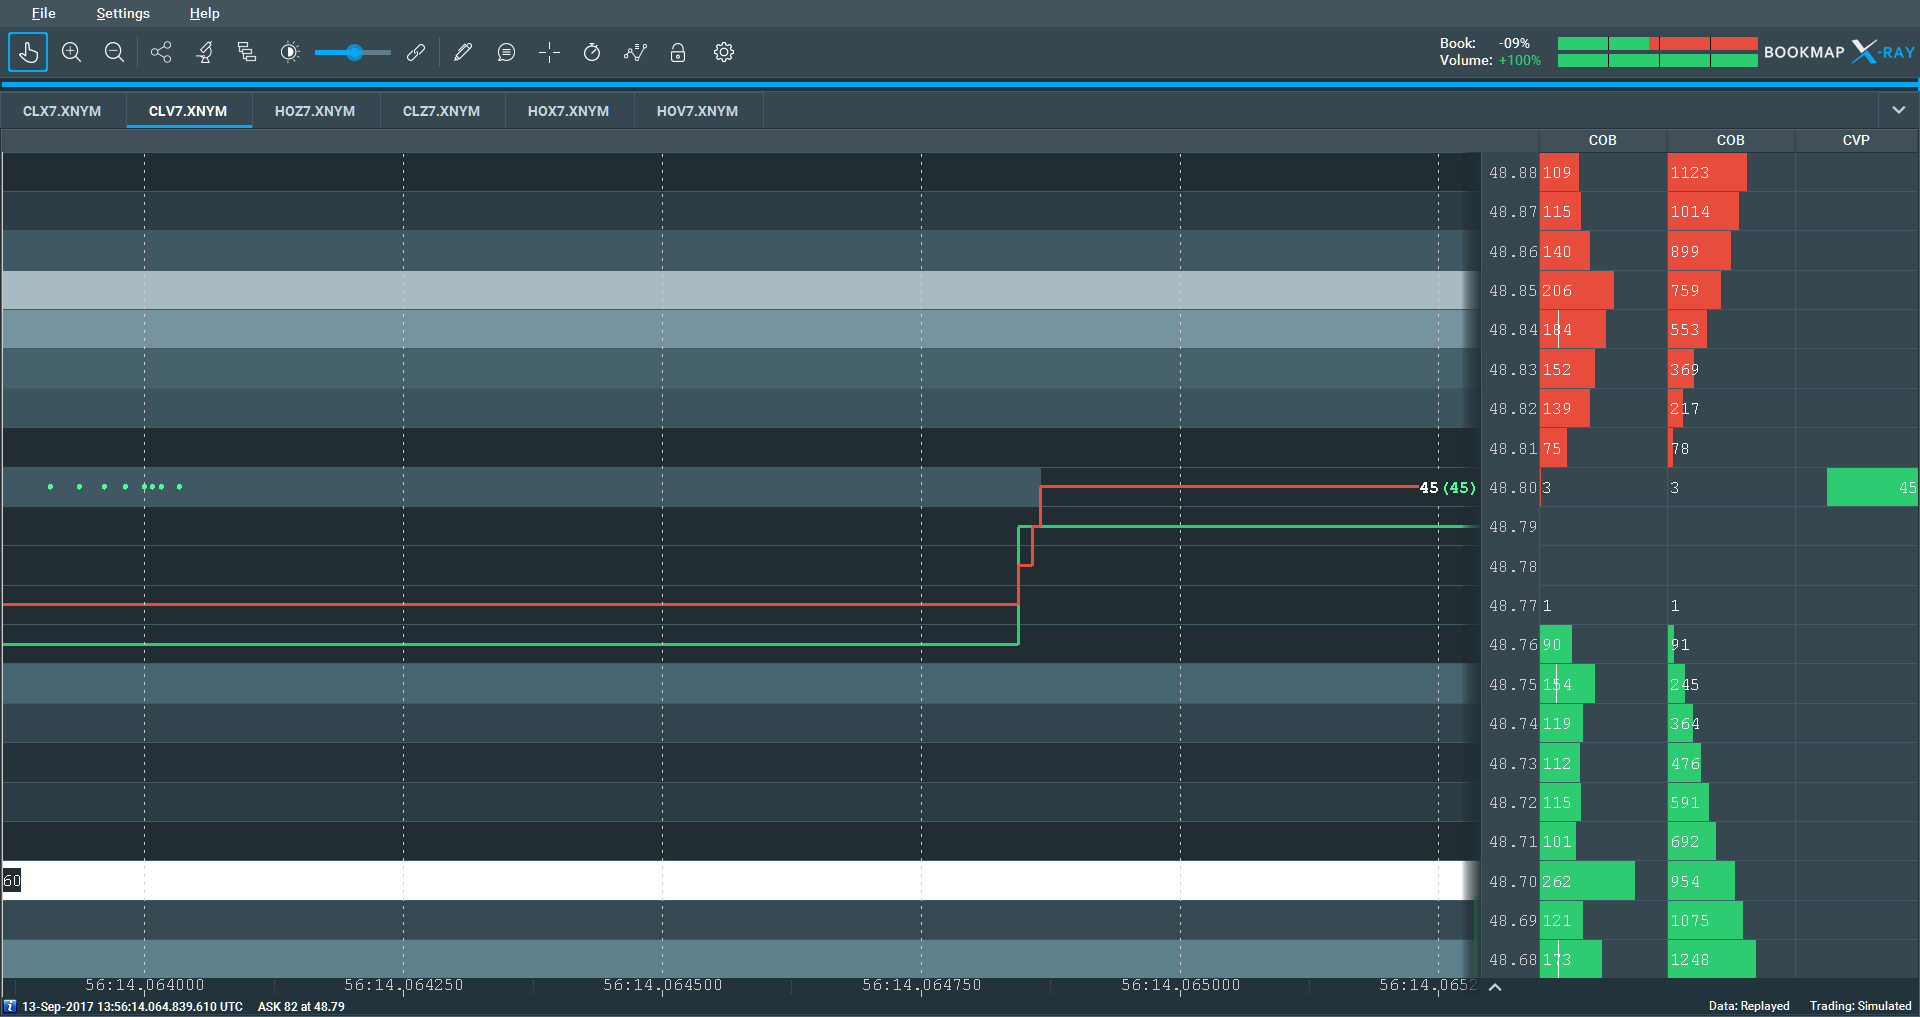
Examination of the nanotick data itself and the aggressive order IDs shows the residual quantity on the offer at the 48.80 level being consumed by a stop. Again note the time differential between the offer liquidity being finally consumed shortly after 12:56:14.064000 and the book update message at 12:56:14.064850.
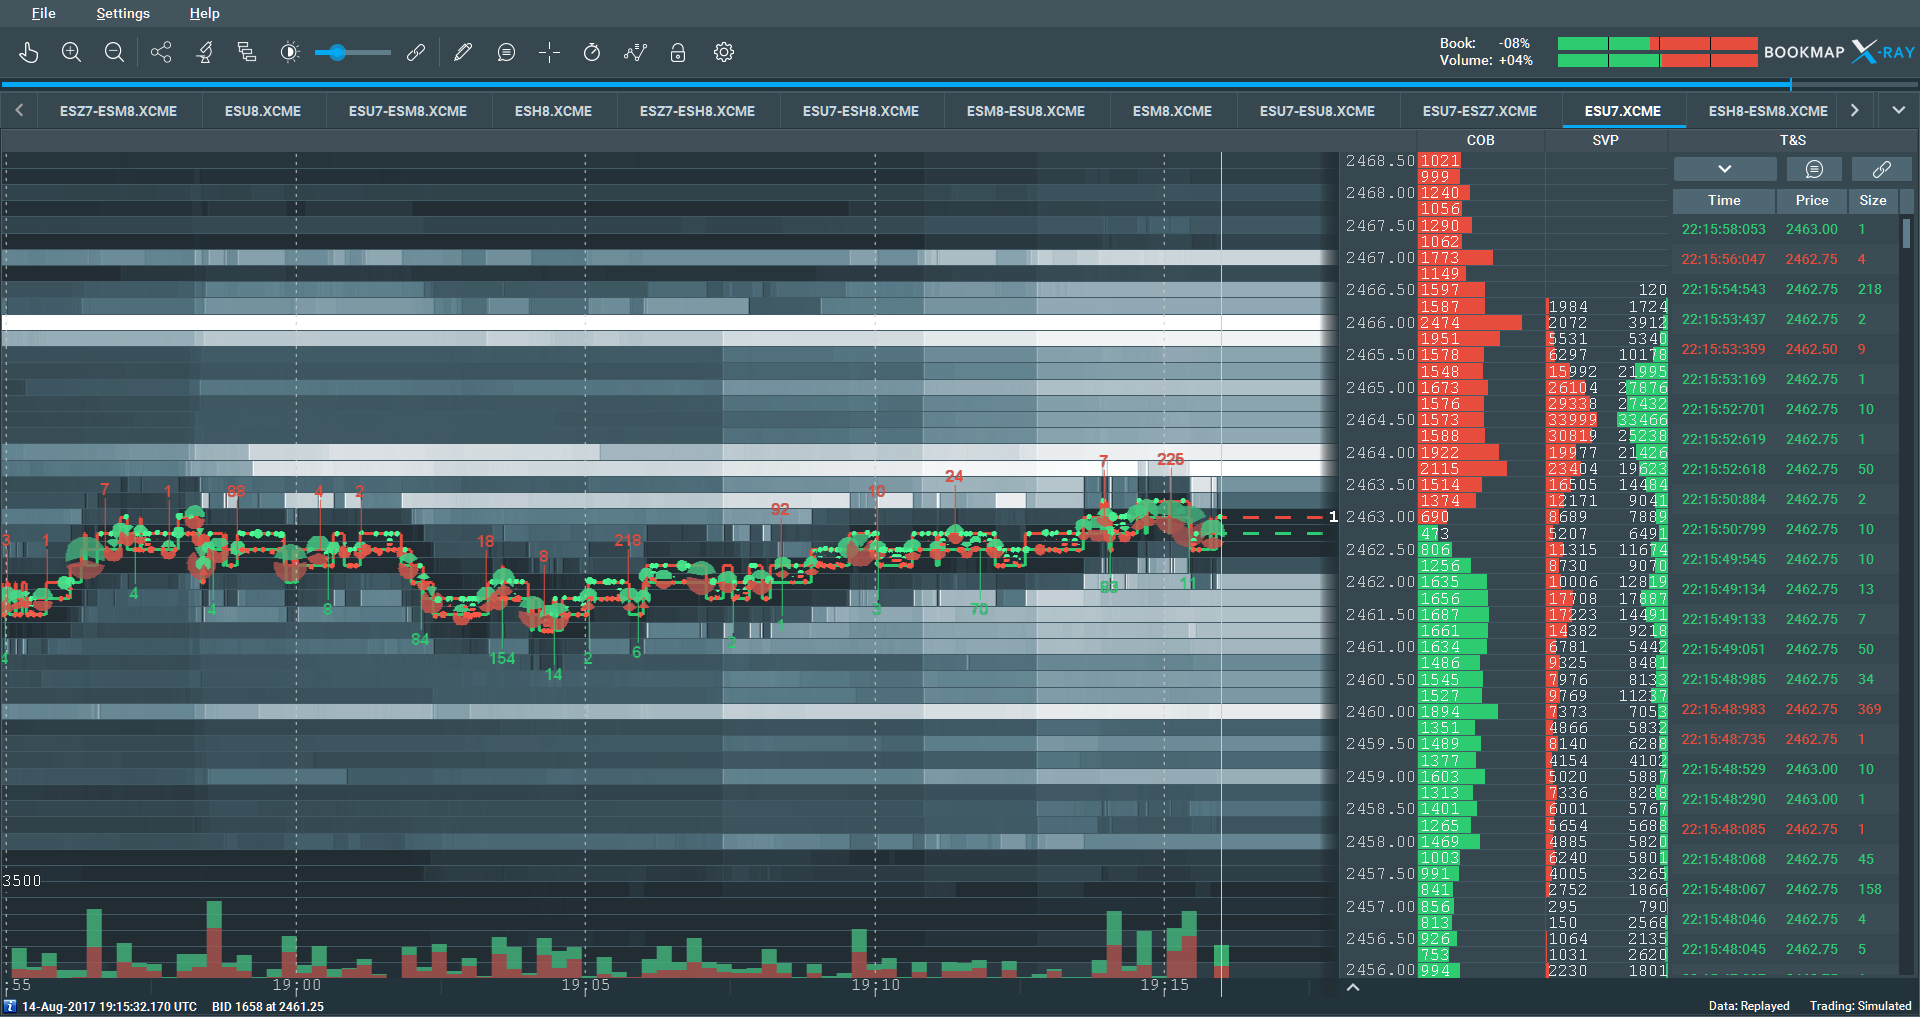
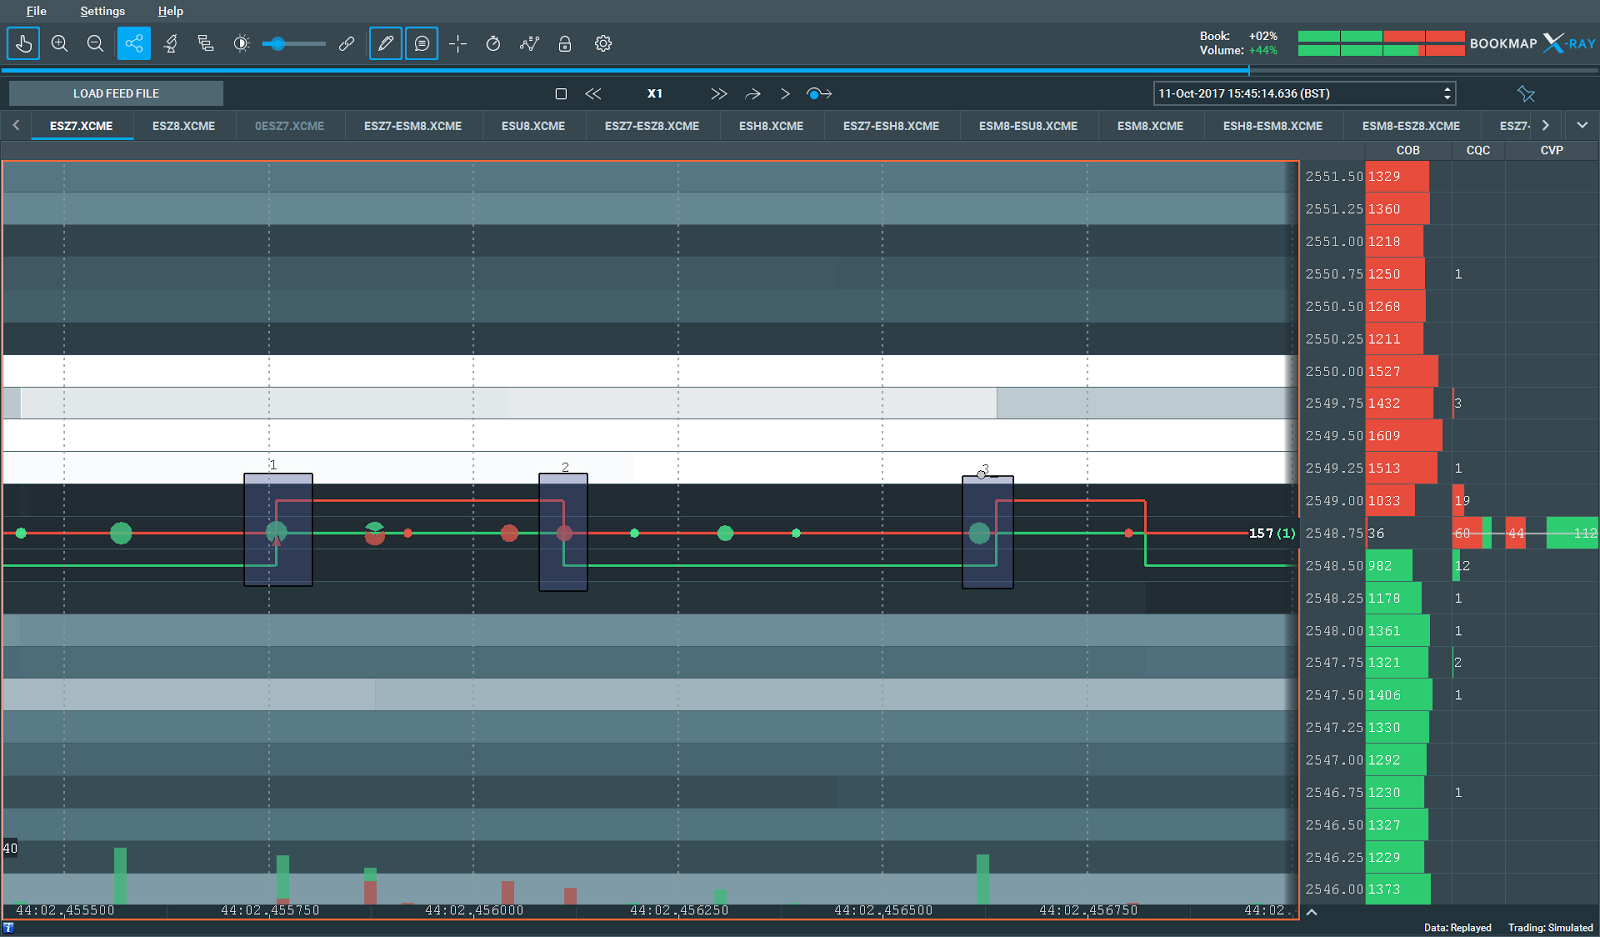
Support and resistance visualization
Nanotick contains information on every order at every price level across the entire book. The ultra high resolution packet capture data also contains all spreads and strategy books enabling a consolidated view of all liquidity across a product complex.
One way to leverage this is by trading support and resistance levels in the market. Below is a great example of resistance levels in action. The Bookmap heatmap highlights the huge excess of liquidity on the offer and the price repeatedly attempts to break through to new highs and fails. If you look at figures 1 and 2 above you can see how the high level view of the entire day within Bookmap highlights these key levels even when they are quite distant from the current price action.
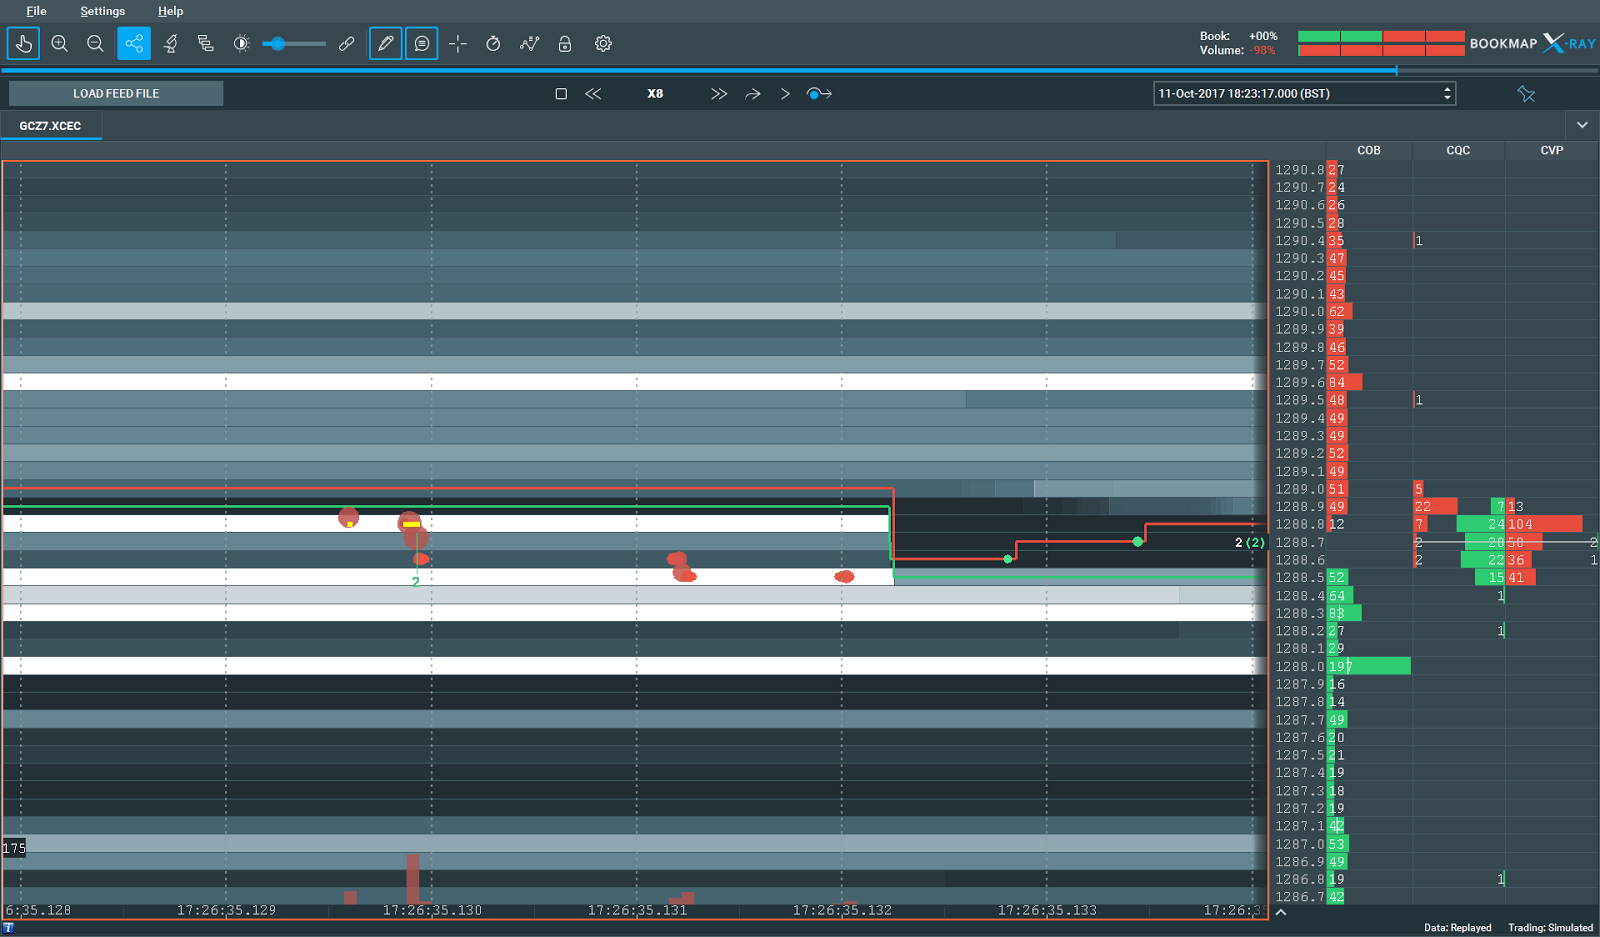
Visualising the impact and market data consequences of of large trades.
The image below shows the bid side of the book being swept by an aggressive sell order from 1288.9 to 1288.6 with the residual being filled at 1288.5. Again note the delay with the CME book update message based on the receive time of the packet.
Large trades can span multiple packets and book updates are added after the completion of a match event. This is a compelling case for applying the trade data to book images ahead of the book update disseminated by the CME itself. Functionality within a coming release of the Onix directConnect CME MDP3.0 feedhandler API will do exactly this for a significant latency advantage over traditional systems.
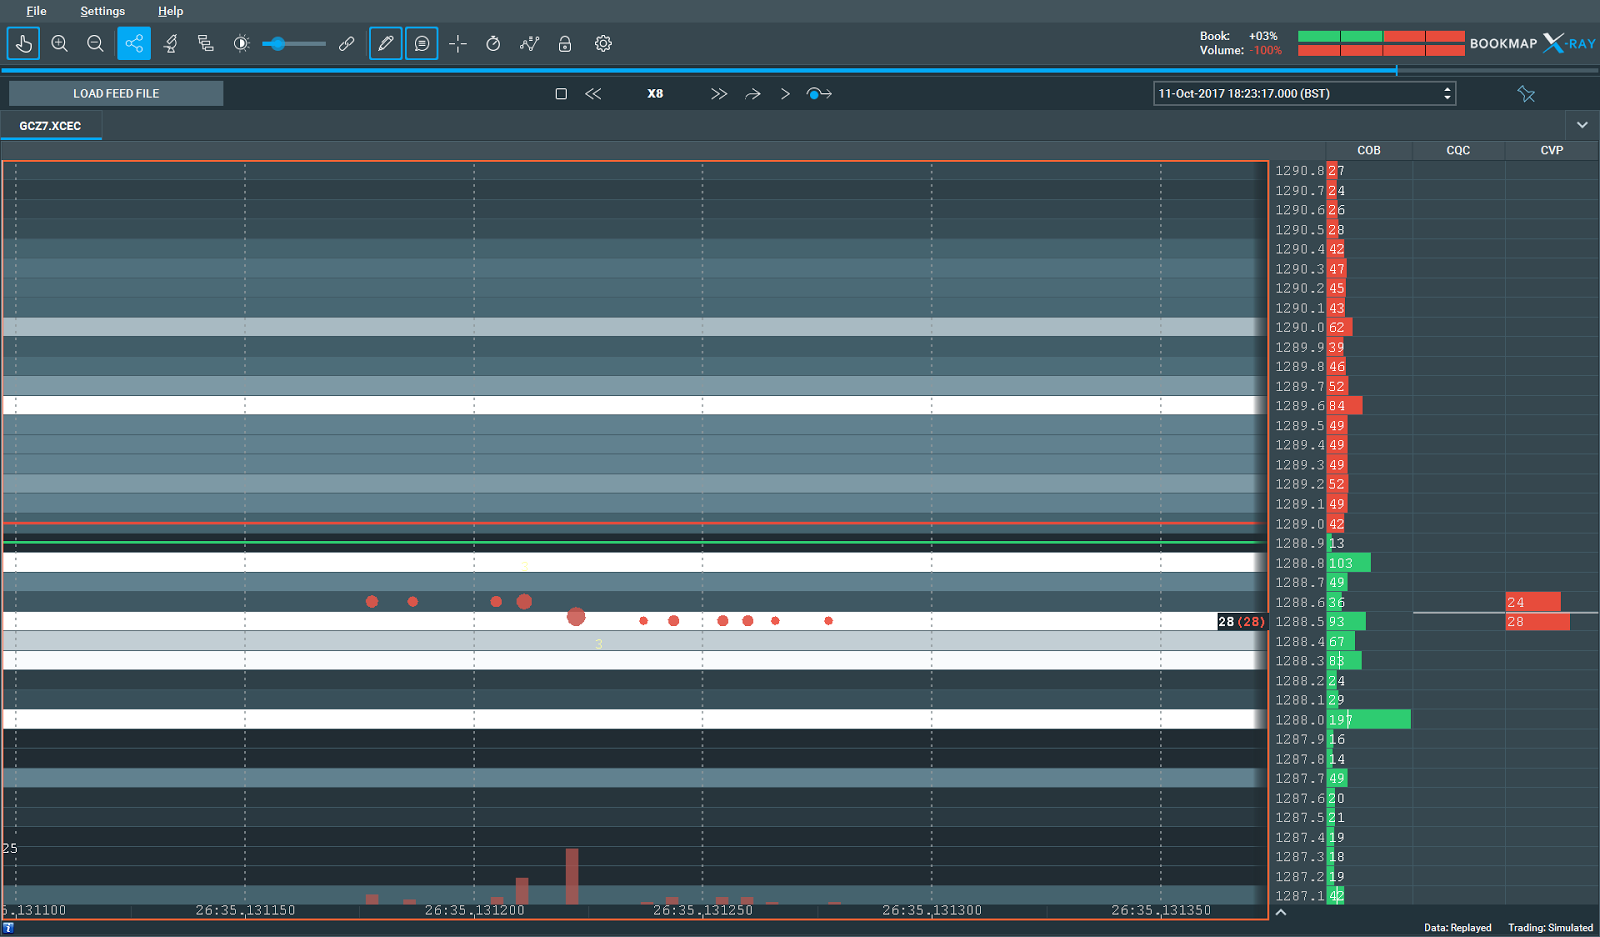
Iceberg orders
Given the lossless granularity of the Nanotick data Bookmap is able to render precise additional information about iceberg orders. In this example using CME front month gold futures 1288.5 trades but the extant liquidity at that price level remains unchanged. Bookmap flags the 28 lots as iceberg quantity and those trades that arise as the iceberg refills.
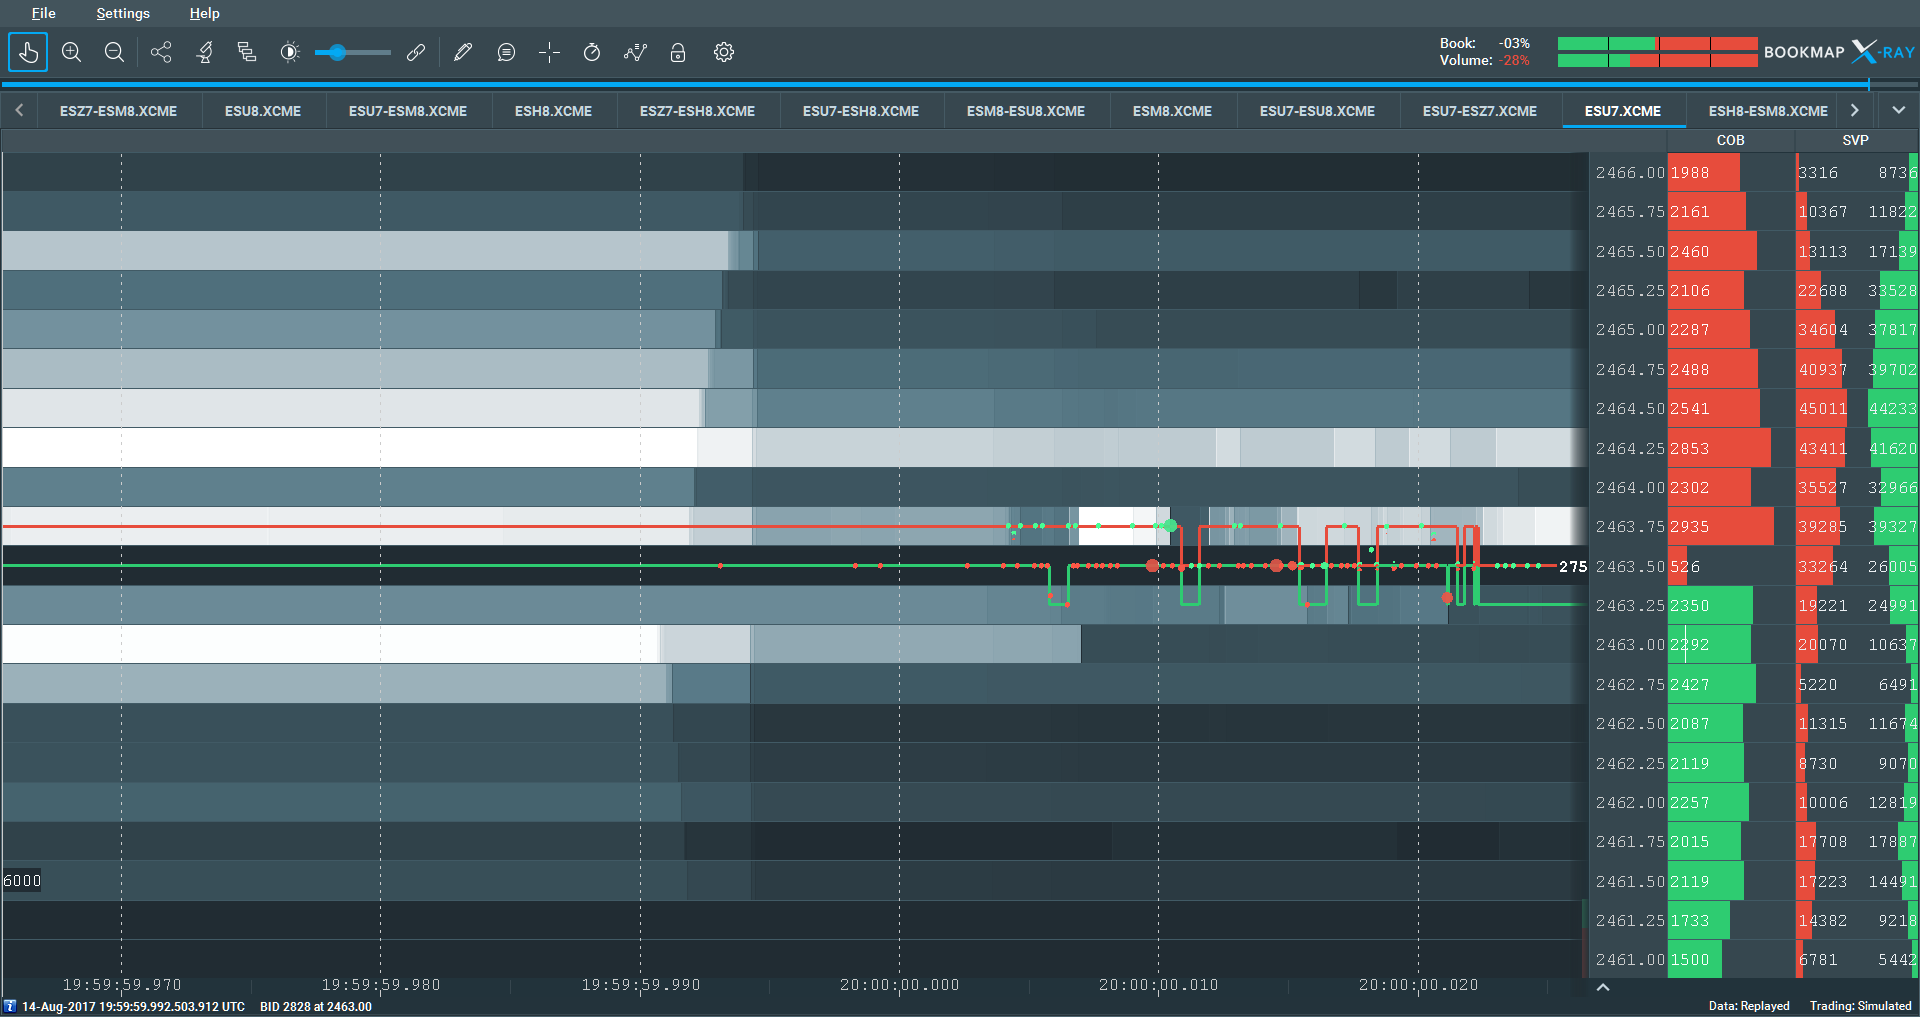
Participant detection and exploitation
With industry standard tick data at second or millisecond resolution a visual decoding of the events below is generally on a best guess basis. With Nanotick’s proprietary GPS, PPS and atomic clock based timestamping technologies the full tick stream can be displayed with the maximum resolution via the Bookmap zoom feature.
In the example below liquidity is cancelled off the bid and added to the offer as a result of a significant print of sold quantity. The resolution of Nanotick shows we that these events are not synchronous, the line formed vertically in the heatmap shading down the centre of the image below is non-continuous as individual cancels, amends and replace orders are submitted and processed by the exchange matching engine at slightly different times.

With this state of the art high resolution visual inspection becomes a research tool to form new hypotheses for machine learning or data mining based strategies. When a market participant’s footprint is both regular and repeated with respect to how the management of live orders the emergent patterns within Nanotick data can be visualised with Bookmap and then exploited by the development of algorithms using the long and easily accessible Nanotick historical data archive.